Fault And Power Loss Analysis On 11kv Feeder
Lines And Cost Implication On Ado-Ekiti Power
Distribution Network
P. K. Olulope, A.M. Adebimpe
ABSTRACT: Fault, power loss and increasing demand for power by the various consumers pose a great challenge to the stakeholders in the energy sector. This study presents analysis of fault and power loss on 11kV network in Ado-Ekiti power distribution system. In order to achieve this aim, operational problem involving network unavailability due to fault occurrences and power loss due to outage are valuated and analyzed using descriptive statistical method. In the course of the study, outage events and durations, downtime of disconnected loads and nature of faults were observed and captured for analysisusing statistical method. It is alarming, as this study reveals that substantial portion of the total power supplied to Ado-Ekiti in four years was lost as a result of the faults on the four (4) 11kV feeders in the State capital. Analysis of the result shows that frequent open circuit and earth faults are the causes of the losses and the implications on the economy in four years under consideration was estimated at one hundred and eight million, eight hundred and thirty five thousand, nine hundred and sixty eight naira (N108, 835, 968 .00). The percentage contribution of each feeder to the total fault of the network between 2008 and 2011 range from approximately 17% to 31% while the percentage contribution of each feeder to the load loss of the network range from approximately 17% to 33%. It was observed that reduced outage on the feeders and quick response to faults whenever it occurs are the ways of eliminating or reducing the losses.
Keywords: Power, Distribution system, Fault, Outages, Feeders, power loss, Energy, power outage, Ring Main Unit ————————————————————
1.
INTRODUCTION
Distribution system is the largest portion of the electrical power system [1]. It can be defined as the part of a power system that distributes power to various customers in ready-to-use form at their place of consumption [2]. Distribution system is the medium through which electric power is conveyed in bulk from the power distribution station to the various end users [3]. It holds a very significant position in the power system since it is the main point of the link between bulk power and consumers [4], [5]. 11kV network links the 33kV primary distribution network to township main and suburb local customer load centres. Ado-Ekiti is fed from 1x15MVA & 1x7.5MVA 33/11kV distribution station through four 11kV feeders. The feeders are: Okesa, Basiri, Ajilosun and Adebayo. At the load points, 17 (50kVA), 43 (100kVA), 28 (200kVA), 32 (300kVA), 6 (315kVA), 57 (500kVA) and 1 (750kVA) distribution transformers further reduce the voltage from 11kV to 415V for customers’ consumption. Admittedly, the shocks from the electricity crisis in Nigeria have created some wedges in the national wheel of effective management of industrial and the other socio-economic development programmes in Nigeria [6]. The occurrence of power outages is very high and alarming in Nigeria. There are several areas of national life that power outage should never occur but power outage for several days is common and could happen just anywhere in the country.
In 2009, the Nigeria presidential palace was not spared and power outage became so frequent that ever since, the state house is powered 24 hours with generators. The last Junior World cup played in Nigeria in 2009 really brought out some embarrassing moments when the whole pitch was thrown into darkness. The Muritala Mohammed International Airport was not spared despite being the main gateway in the south into and out of this country [7], [8]. In the midst of this however, Nigeria’s demand for energy and electricity is increasing rapidly [9]. Owing to the fact that the basic function of the electric power distribution system in a power network is to receive power at one or more supply points and to deliver it to the various loads, therefore, the best distribution system is one that will, cost effectively, efficiently and safely, supply adequate and uninterrupted electric service to both present and future probable loads [10]. It must be emphasized that adequate attention should be paid to the power distribution network by subjecting it to review regularly for improvement and efficiency [11].
2. METHODOLOGY
The approach adopted for the study is as follows: Collection of relevant documented information about the Ado-Ekiti distribution network. Such documents include; electrical map, faults records, loading of the feeders, feeder lengths and conductor capacity. The electrical map shows the arrangement of the feeders, connection of ring main unit (R.M.U), span of each feeder and the positions of each distribution transformers and circuit breakers. Fault records show clearly the occurrence of fault on the feeders and how frequent the fault occurs. Inventory of distribution transformers gives a clear picture of names of feeders, voltage level and route length of feeders. Moreover, documented information on feeder loading reveals the loading of each feeder while the feeder length indicates the source and terminal of each feeder. In the course of this study, we had an interactive session with some of the members of staff of the power regulatory body (BEDC), Ado-Ekiti. We asked a number of questions as touching the challenges of the power distribution in the district especially _____________________________
P. K. Olulope, A.M. Adebimpe
Department of Electrical and Electronic Engineering, Ekiti State University (EKSU), Ado-Ekiti, Ado-Ekiti, Nigeria. [email protected]
337 the challenges posed by fault and load loss. They were able
to give answers to the questions and made us understand how they have been coping with the challenges. The analysis of the collected data was done in a way as to categorize the faults, number of occurrence between January, 2008 and June, 2011. The causes of the faults on the feeders, the load loss associated with each fault and the economic implication.
2.1 Data Analysis
The collected data was analyzed using numerical statistical technique. The outage events were grouped into monthly and annual aggregates considering the feeders in turn as shown in Tables 1- 4. This includes downtime load loss calculated on monthly basis and analyzed on yearly basis.
The downtime load loss DTLLm was evaluated using equation (1):
1
∑
2
where is annual Downtime Loadloss, DTLLm is Loadloss on month m of the year.
For Okesa feeder in January 2008:
The values of Li are obtained from Table A.1 of appendix.
Analogically, DTLLm was evaluated for all the feeders and the results presented in Tables 1, 2, 3 and 4.
Table 1: Monthly Summaries of Downtime Load Loss [MW] Data for 2008.
FEEDER
MONTHS
JAN FEB MAR APR MAY JUNE JULY AUG SEPT OCT NOV DEC OKESA 04.28 30.02 53.07 37.86 07.11 25.81 23.03 29.20 32.78 21.12 22.84 03.75 BASIRI 18.13 05.20 09.59 30.31 - 27.96 11.28 14.38 11.91 146.55 10.28 23.77 AJILOSUN 08.47 28.87 51.09 78.86 05.54 25.64 12.14 45.67 37.31 56.07 58.67 61.99 ADEBAYO 08.13 80.99 08.52 27.64 27.64 23.93 65.16 - 12.87 88.10 21.12 38.42 TOTAL 39.01 145.08 122.27 174.67 40.29 103.34 111.61 89.25 94.87 311.84 112.91 127.93
Table 2: Monthly Summaries of Downtime Load Loss [MW] Data for 2009
FEEDER
MONTHS
JAN FEB MAR APR MAY JUNE JULY AUG SEPT OCT NOV DEC OKESA 57.56 10.20 08.88 23.35 13.57 56.72 10.08 13.01 20.23 00.25 02.94 10.97 BASIRI 19.78 07.03 26.43 - 15.76 00.59 20.16 36.62 05.81 40.21 07.37 09.85 AJILOSUN 17.37 57.06 02.34 60.83 40.68 30.48 51.34 16.79 - 13.28 23.14 70.99 ADEBAYO 07.54 06.78 16.65 23.42 20.80 19.14 11.23 20.59 13.47 18.10 07.23 09.47 TOTAL 102.25 81.07 54.30 107.60 90.81 106.93 92.81 87.01 39.51 71.84 40.68 101.28
Table 3: Monthly Summaries of Downtime Load Loss [MW] Data for 2010
FEEDER
MONTHS
JAN FEB MAR APR MAY JUNE JULY AUG SEPT OCT NOV DEC OKESA 47.23 07.27 12.97 10.14 08.74 60.02 122.73 09.87 06.63 00.39 06.56 03.82 BASIRI 93.84 10.42 04.54 15.67 41.26 123.66 28.89 06.61 09.51 44.32 04.25 04.44 AJILOSUN 63.42 10.36 07.11 04.06 45.81 105.85 45.89 19.72 03.67 10.13 02.91 14.03 ADEBAYO 65.07 00.34 04.78 02.87 00.19 50.23 36.09 49.50 02.93 02.79 00.31 08.39 TOTAL 269.56 28.39 29.40 32.74 96.00 339.76 233.60 85.70 22.74 57.63 14.03 30.68
Table 4: Monthly Summaries of Downtime Load Loss [MW] Data for 2011
FEEDER
MONTHS
JAN FEB MAR APR MAY JUNE JULY AUG SEPT OCT NOV DEC
OKESA 00.17 87.98 39.61 24.62 04.52 00.39 99.90 83.27 19.40 102.83 54.36 90.91 BASIRI 00.11 00.20 03.97 42.52 - 11.36 16.28 06.69 128.73 01.04 36.93 04.22 AJILOSUN 02.83 15.24 09.49 09.65 15.37 21.78 40.15 190.49 50.09 43.05 73.70 86.67 ADEBAYO 00.98 - 03.03 33.30 17.93 07.25 62.70 89.09 86.65 117.11 32.51 137.73
TOTAL 04.09 103.42 56.10 110.09 37.82 40.78 219.03 198.10 284.87 264.03 197.50 319.53
Table 5: Annual Summaries of Downtime Load loss (MW) for 2008-2011
Table 6: Summaries of fault frequency on Feeders for 2008-2011
FEEDERS YEARS TOTAL
2008 2009 2010 2011
OKESA 59 48 54 143 304
BASIRI 35 43 55 67 200
AJILOSUN 51 54 59 173 337
ADEBAYO 45 50 36 126 257
TOTAL 190 195 204 509 1098
Table 7 shows the summary of the year-by-year revenue loss as a result of the faults on the feeders. Revenue loss = Cost of 1kWh x Yearly Downtime x1000 where 1kWh = N19.20.
Table 7: Annual Summaries of Revenue Loss (N) for 2008-2011
3.
Results and Discussion
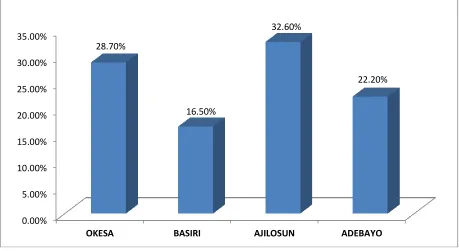
The load loss reading of the four feeders in four years shown in Table 5 reveals that Ajilosun has the highest load loss of 1746.09MW (32.60%) as shown Figure 1. This is followed by Okesa, Adebayo and Basiri. Ajilosun feeder with rated power of 6.3MW has the highest load loss because of the incessant outage of the feeder as a result of fault. It recorded the highest number of outages and in overall accounts for 30.8% of the outages as a result of fault in four years (figure 2). Okesa feeder which is next on
the load loss table has a rated power of 5.4MW and second to the highest fault frequency. It also accounts for 27.8% of outages in the period covered by this study. Adebayo feeder with highest customer population and rated power of 4.6MW has a considerable high load loss of 1361.07 MW. This is because of its low fault frequency. Basiri has the lowest load loss because of its low fault frequency. It accounts for the lowest percentage (17.3%) of the outages in the four years under examination.
FEEDERS
YEARS
GRAND TOTAL
2008 2009 2010 2011
OKESA 290.87 227.76 296.37 607.96 1422.96
BASIRI 309.36 189.60 387.41 252.05 1138.42 AJILOSUN 470.32 384.30 332.96 558.51 1746.09
ADEBAYO 374.88 174.42 223.49 588.28 1361.07
TOTAL 1445.43 976.08 1240.23 2006.80 5668.54
FEEDERS
YEARS GRAND
TOTAL
2008 2009 2010 2011
339
Figure 2: Percentages of Load Losses in Respective Feeder between 2008 and 2011
Figure 2: Percentages of Fault occurrences in Respective Feeders between 2008 and 2011
3.1 Revenue Loss and Fault
The cost implication of the load loss is presented in Table 8. This shows what the Benin Electricity Distribution Company (formally PHCN) would have saved in Ado-Ekiti power distribution network if the losses were avoided.
Table 8: Summary of revenue loss in Naira
As shown in Table 8 above, year 2011 presents the highest revenue loss. In the years under review, about 35.4% of the total revenue was lost in the year 2011, 25.5% of the revenue was lost in 2008, 21.9% of the revenue was lost in 2010 while 17.2% of the total revenue in four years was lost in the year 2009. Considering the cost of generating a unit of energy, this lost contribute to the rising cost of electricity
in the land. The percentage contribution of each feeder to the total fault (PCF) of the network between 2008 and 2011 range from 17.3% to 30.8% as shown in Figure 2.
4. Conclusion
It could be seen from the analysis that a substantial part of generated power (5668.54MW) is lost in the distribution
0.00% 5.00% 10.00% 15.00% 20.00% 25.00% 30.00% 35.00%
OKESA BASIRI AJILOSUN ADEBAYO
28.70%
16.50%
32.60%
22.20%
Years 2008 2009 2010 2011 Total
Revenue Loss
system through the 11kV feeders. Faults in the system contributed immensely to the power loss and the cost implication of one hundred and eight million, eight hundred and thirty five thousand, nine hundred and sixty eight naira (N108,835,968.00) reflected that the consumers have been paying for the lost energy because the billing is done on monthly basis. Losses must be reduced to barest minimum in electricity distribution which is the final stage in the delivery of electricity to end-users to make it more efficient.
5. References
[1]. A. Goran, ―Modelling and Analysis of Electric Power Systems‖, Lecture 227-0526-00, ITET ETH, Zurich, 2008.
[2]. L. Ramesh, S. Chowdhury, A. Natarajan and C. Gaunt, ―Minimization of power loss in distribution networks by different techniques‖, International Journal of Energy and Power Engineering, 2009, 2(1).
[3]. I. A. Adejumobi and O. I. Adebisi, ―Power Loss Reduction on Primary Distribution Networks Using Tap-Changing Technique‖, International Journal of Research and Reviews in Applied Sciences, Vol. 10, issue 2, February, 2012, pp. 272.
[4]. J. B. Gupta, (2013). ―A Course in Power Systems‖, (Generation and Economic Considerations; Transmission and Distribution, Switchgear and Protection), S.K. Kataria and Sons, 4885/109, Prakash Mahal, Dr. Subhash Bhargav Lane, Opposite Delhi Medical Association, Daryaganj, New Delhi-110002.
[5]. W. H. Kersting, ―Distribution System Modeling and Analysis‖, 2002, CRC Press, LLC, 2000 N.W, Corporate Blvd., Florida, 33431.
[6]. D. J. Obadote, ―Energy Crisis in Nigeria: Technical Issues and Solutions‖, Power Sector Prayer Conference, June 25-27, 2009.
[7]. O. Anyaeji, ―New Initiatives on Electric Power Transmission and Distribution in Nigeria‖, 6th Annual German-African Energy Forum, Hamburg, Germany, April 22-24, 2012. pp 28.
[8]. A. A. Ijewere, ―The Management of Electricity Power Supply in Nigeria: Problem and Prospects‖, International Journal of Scientific & Engineering Research, Vol. 2, Issue II. November-2011. pp 185.
[9]. O. Arobieke, S. Osafehinti, S. Oluwajobi, and O. Oni, ―Electrical Power Outage in Nigeria: History, causes and Possible Solutions‖, Journal of Energy Technologies and Policy, International Institute for Science, Technology and Education. Vol. 2, No.6, 2012, pp 18-23.
[10]. A. S. Pabla, ―Electric power Distribution‖ McGraw-Hill Publishing Company Limited, 2008.
[11]. L. M. Faulkenberry, and W. Coffer, ―Electrical Power Distribution and Transmission‖, Dorling Kinersley Pvt. Ltd. Licencees of Pearson Education in South Asia, 482, F.I.E, Patparganj, Delhi, 110092, India, 2008.
[12]. C. Ndungu, and N. Livingstone, ―Improving Power Distribution Efficiency on Power Lines‖, Journal of Energy Technologies and Policy, vol. 2, No. 4, 2012.
[13]. D. P. Kothari, and I. J. Nagrath, ―Power System Engineering‖, (Second Edition), Tata McGraw-hill Publishing company Limited, 7 West Patel Nagar, New Delhi, 110008, 2008.
[14]. V. K. Mehta, and R. Mehta, ―Principles of Electrical Engineering‖, S. Chand & Company Ltd. 7361, Ram Nagar, New Delhi, 2007.
[15]. E. C. Chinwuko, C. O. Mgbemena, P. S. Aguh, and W. S. Ebhota, ―Electricity Generation and Distribution in Nigeria: Technical Issues and Solutions‖, International Journal of Engineering, science and Technology, Vol. 3, No.11, Nov., 2011.
[16]. M. Goudarzi, B. Vahidi, and R. A. Naghizadeh, ―Optimum Reactive Power Compensation in Distribution Networks Using Imperialistic Competitive Algorithm‖, sci.int (Lahore), 25(1), 2013, pp. 27 – 31.
APPENDIX
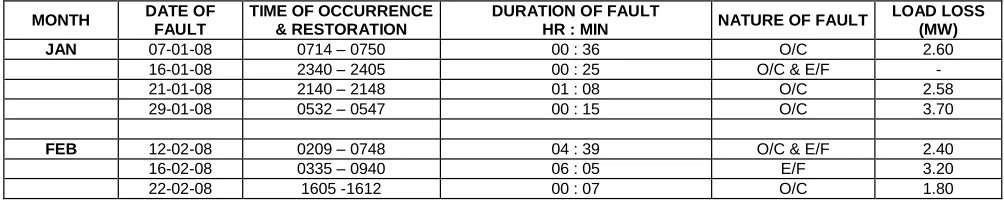
Table A.1: FAULTS LOG ENTRY ON 11kV FEEDERS IN ADO-EKITI POWER DISTRIBUTION NETWORK (2008) OKESA
FEEDER
MONTH DATE OF FAULT TIME OF OCCURRENCE & RESTORATION DURATION OF FAULT HR : MIN NATURE OF FAULT LOAD LOSS (MW)
JAN 07-01-08 0714 – 0750 00 : 36 O/C 2.60
16-01-08 2340 – 2405 00 : 25 O/C & E/F -
21-01-08 2140 – 2148 01 : 08 O/C 2.58
29-01-08 0532 – 0547 00 : 15 O/C 3.70
FEB 12-02-08 0209 – 0748 04 : 39 O/C & E/F 2.40
16-02-08 0335 – 0940 06 : 05 E/F 3.20
341
MARCH 05-03-08 1715 – 1750 00 : 35 O/C & E/F 2.20
09-03-08 2039 – 2048 00 : 09 O/C 3.15
26-03-08 1600 – 1740 01 : 40 O/C & E/F -
27-03-08 0805 – 1115 03 : 10 O/C & E/F 3.10
30-03-08 2204 – 0850 11 : 46 E/F 3.70
APRIL 02-04-08 1010 – 1025 00 : 15 O/C & E/F 2.93
05-04-08 1906 – 1915 00 : 09 O/C 2.30
13-04-08 1514 – 1655 01 : 41 O/C & E/F 1.78
19-04-08 0705 – 1610 09 : 05 O/C & E/F 3.45
27-04-08 0950 – 1148 01 :58 O/C & E/F 2.20
MAY 01-05-08 1809 – 1853 00 : 44 O/C & E/F -
12-05-08 2140 – 2156 00 : 16 O/C -
16-05-08 1141 – 1207 00 : 26 O/C 2.95
29-05-08 1232 – 1440 02 : 08 O/C & E/F 3.05
JUNE 06-06-08 1118 - 1145 00 : 27 O/C 1.60
07-06-08 1836 - 1940 01 : 04 O/C & E/F 2.05
12-06-08 1414 - 1633 02 : 19 O/C & E/F 2.15
18-06-08 2045 - 2115 00 : 30 E/F 4.30
25-06-08 0432 - 1018 05 : 46 O/C 2.40
30-06-08 0904 - 1111 02 : 07 O/C 2.00
JULY 02-07-08 1602 - 1700 00 : 58 O/C & E/F 1.80
09-07-08 1227 - 1615 03 : 48 O/C & E/F 2.90
13-07-08 0520 - 0928 04 : 08 O/C 2.05
19-07-08 1324 - 1358 00 : 34 O/C & E/F -
27-07-08 1717 - 1850 01 : 33 O/C & E/F 2.65
AUG 01-08-08 0520 - 0848 03 : 28 O/C & E/F 1.95
02-08-08 1500 - 1837 03 : 37 O/C & E/F 3.40
09-08-08 1732 - 1847 01 :15 O/C 1.80
16-08-08 1200 - 1407 02 : 07 O/C & E/F 4.40
28-08-08 1908 - 1918 00 : 10 O/C 1.70
SEPT 04-09-08 1055 - 1305 02 : 10 O/C & E/F 2.45
07-09-08 0712 - 1414 07 : 02 O/C & E/F 3.00
13-09-08 1645 - 1658 00 : 13 O/C 2.10
21-09-08 0513 - 0826 03 : 13 O/C & E/F 1.90
27-09-08 1900 - 1911 00 : 11 O/C 3.20
OCT 14-10-08 2025 - 2220 01 :55 O/C & E/F 2.41
16-10-08 2100 - 2155 00 : 55 O/C & E/F 1.95
19-10-08 1812 - 1930 01 : 18 O/C & E/F 1.92
24-10-08 0535 - 1213 06 : 48 O/C 1.11
25-10-08 1320 - 1335 00 : 15 O/C & E/F -
1816 – 1831 00 : 15 O/C & E/F 3.15
27-10-08 1705 – 2024 03 : 19 O/C & E/F 2.00
NOV 03-11-08 1742 – 1744 00 : 02 O/C & E/F 3.14
05-11-08 1828 – 1830 00 : 02 O/C & E/F -
09-11-08 1804 – 1820 00 : 16 O/C 2.67
14-11-08 1325 – 1500 01 : 35 O/C & E/F 3.10
20-11-08 0213 – 0225 05 : 12 E/F 2.75
25-11-08 1055 – 1209 01 : 14 O/C & E/F 3.58
DEC 06-12-08 1609 – 1812 02 : 03 O/C & E/F 1.80
07-12-08 0210 – 0223 01 : 13 O/C -
21-12-08 1228 – 1330 01 : 02 E/F -
27-12-08 2302 – 2305 00 : 03 O/C & E/F 3.20