145
Near Infrared Technology And Multivariate
Analysis Approach For A Rapid Authentication Of
Patchouli Oil
Zulfahrizal, Syaifullah Muhammad, Agus Arip Munawar, Tari Tarigan
Abstract: The main objective of this present study is investigate the ability of near infrared technology combined with multivariate analysis for patchouli oil authentication. Crude patchouli oil was mixed with palm oil in different proportions: 75% crude patchouli oil: 25% palm oil, also 50%:50% of crude patchouli and palm oil respectively. Near infrared spectra data in form of absorbance spectrum were acquired in wavelength range from 1000 to 2500 nm with intervals of 2 nm. Classification models used to distinguish pure patchouli oil and its adulterations were established using principal component analysis (PCA) and linear discriminant analysis (LDA) with maximum 7 latent variables. The results showed that pure crude patchouli oil can distinguish pure patchouli oil and its adulterated ones. The maximum total variance for classification model is 94% with 2 principal components of PCA and 2 latent variables of LDA. The primary chemical properties of oil samples correspond to authentication are patchouli alcohol and fat content in wavelength range around 1378-1926 nm. Based on obtained results, it may conclude that near infrared technology in tandem with proper multivariate analysis is able to be used as a rapid and non-invasive method for patchouli oil authentications and adulterant detections.
Keywords: NIR technology, patchouli oil, authentication, patchouli plant, detection, rapid.
—————————— ——————————
1 INTRODUCTION
Indonesia is one of the biggest essential oil producing countries that is quite important in world trade, one of which is patchouli (Pogostemon cablin Benth) which is much in demand by developed countries. Indonesia and Philippines are the countries in Southeast Asia producing very high patchouli oil. Patchouli oil contains patchcouli alcohol (Patchcouli camphor) which makes it has its own characteristics from other essential oils. Indonesia's patchouli oil production centers are in West Sumatra, South Sumatra, North Sumatra, Riau and Aceh. Patchouli oil is used as an industrial raw material such as perfume, pharmaceutical, cosmetics, soap, and other industrial products. Patchouli plants have several varieties of morphological characters, namely P. cablin (Aceh patchouli), P. heyneanus (Java patchouli) and P. hortensis (patchouli soap). A very important characteristic in oil production including patchouli oil is the aroma of patchouli alcohol (PA), because it is an indicator of the quality level of the original aroma as well as whether or not the quality of the patchouli oil [1], [2]. The main component that determines the quality of patchouli oil with levels of not less than 30% is the PA level. Patchouli oil PA levels have a significant influence on the quality of the aroma produced [3]. Patchouli is a type of essential oil producing plant, known as patchouli oil. Patchouli belongs to the Labiatae tribe, the Lamiales in the Angiosperge class. Types of patchouli that have been known in Indonesia include Pogostemon cablin Benth, known as Aceh patchouli, which has a PA level of 5-2.5%, Pogostemon heyneanus, known as Javanese patchouli with a PA level of 0.5-1.5%, and Pogostemon hortensis which known as patchouli soap with PA levels 0.5-1.5% [4], [5]. Patchouli plant is one of the important essential oil producing plants, known as patchouli oil.
This plant contains the main component of PA, which is a compound of sesquiterpenes with the molecular formula C15H26O. High PA levels in patchouli oil mean that the better
the quality of the oil. Patchouli alcohol functions as a binding material for fragrances so that the fragrance lasts longer [1], [6]. This plant has long been used in general in traditional Asian medicines, especially China, India, and Arabic, which is efficacious as an aphrodisiac (strong medicine), anti-stress, and anti-septic, relieve headaches and fever. While the oil is used as a therapeutic aroma, fragrance oil, treat skin by accelerating skin regeneration, removing eczema and acne scars and insectsProduct counterfeiting is a very interesting issue, both food products and essential oils, especially patchouli oil. For consumers or producers, forgery itself has advantages and disadvantages. Counterfeiting products usually mix low-value products with high-value products [7]. Patchouli oil which is very expensive is usually falsified with palm oil, keruing oil or kerosene. Usually to find out the authenticity of patchouli oil, laboratory tests are carried out where this test uses certain chemical methods and analyses [8]. However, most of these methods are time consuming, expensive, complicated sample preparations and laborious [9], [10]. Thus, it is unsuitable to be employed in patchouli oil industries. A recent development in technology seeks to find a suitable technology that can be applied in agriculture [11], [12]. Along with the development of technology found a more practical way to solve the above problems namely non-destructive test technologies such as near infrared reflectance spectroscopy (NIRS). NIRS technology has been proven capable of analyzing various agricultural products such as milk, wine, fruit juices and other agricultural products [13]–[20]. Therefore, this research attempted to use NIRS technology to overcome the problem of counterfeiting patchouli oil in the form of crude oil. The purpose of this present study is to develop a multivariate analysis model for estimating the authenticity of patchouli oil and palm oil by comparing the principal component analysis (PCA) and linear discriminant analysis (LDA) methods.
————————————————
All authors are currently working in ARC Syiah Kuala University, Jl. T Hasan Krueng Kalee No.3, Darussalam Banda Aceh 23111 – Indonesia.
2 MATERIALS AND METHODS
2.1 Patchouli oil samples
In this study the material used was patchouli oil from Atsiri Research Center Syiah Kuala University and processed palm oil obtained from merchant shops around Darussalam Banda Aceh. In each sample 100% patchouli oil, 100% palm oil, 75-25% mixed oil and 50-50% mixed were put into a measuring cup. For 50 ml pure patchouli oil then put in 10 bottles, 50 ml palm oil (packaged) put in 10 glass bottles 5, mixed 75% pure patchouli oil with volume (37.5 ml) - 25% palm oil (12, 5 ml) put a total of 50 ml into 10 bottles and mixed with 50% pure patchouli oil (25 ml) - 50% palm oil (25 ml) a total of 50 ml then put into 10 bottles. Then stir until homogeneous then put each sample into a glass bottle with a total sample of 40 glass bottles. Samples that have been put into vials with each volume of 5 ml both pure and mixed as presented in Table 1.
2.2 Spectra data of near infrared
The self-developed FT-IR was used in this study. It radiated light waves in the range of wavelengths between 1000 nm to 2500 nm or as energies in 4000 - 10,000 cm-1 [21], [22]. The instrument is controlled by Thermo Integration® software. In this research, the instrument is set with 64 scans, 2.0 cm-1 resolution, and 4x optical gain so that it can acquire the diffuse reflectance spectrum of the sample, recorded and saved in two different file formats [13], [23], [24]. The results obtained from the transformation of the reflectance value into absorbance are converted into log (1/R) form.
2.3 Outlier data detection
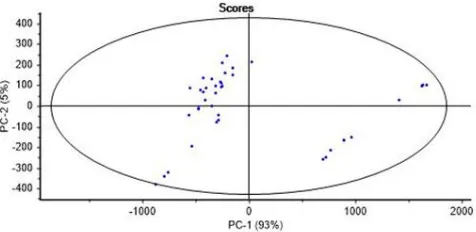
The outlier data are removed using the principal component analysis (PCA) method and the ellipse T2 Hotelling which is a way to analyze outlier data. The data taken is data that is inside the elliptical line, if it is outside the elliptical line, then the data is marked as outlier and removed. Data analysis for all samples were corrected firstly. This aims is to eliminate various kinds of noises in the sample spectrum so that the predicted results are more accurate [11], [25].
2.4 Patchouli oil authenticity classification
Classification of the mixture between patchouli oil and palm oil based on the typical spectrum obtained. The entire data is used as a dataset used to construct the patchouli oil and palm oil classification model. According to literatures, a good classification model is built using the PCA method with a latent variable (LV) smaller than 9 and a classification model for the LDA method by looking at the number of components [26], [27].
3 RESULTS AND DISCUSSION
This study uses two types of oil as samples, namely Patchouli oil (in the form of crude oil) and processed palm oil. The treatments given to the sample consisted of crude or pure patchouli oil with the symbol MN, palm oil (MS), patchouli oil 50% mixed palm oil 50% (MNC 50%), and patchouli oil 75% mixed with palm oil 25% (MNC 75%).The NIRS spectrum for oil is acquired at wavenumbers of 4000-10,000 cm-1 or 1000-2500 nm. The oil spectrum shows the average value of the absorbance spectrum, where the absorption (absorption) of NIR light by the chemical content of the oil is characterized by several peaks and valleys of the spectrum. The following spectrum of patchouli oil and palm oil that has been averaged
aims for make it easier to interpret the presence of chemicals at certain wavelengths as presented in Fig.1.
The Peaks and valleys in the NIR spectrum are formed by the interaction of substances with light fired at certain waves that correspond to these substances, NIR waves will provide information in the form of vibrations in molecular bonds due to changes when given infrared radiation. Therefore, the spectrum of the sample varies, depending on the substances contained in the sample. The typical spectrum of the two types of oil is not too different, but when viewed in more detail it is found that pure patchouli oil and refined palm oil have different diffuse reflectance values. In addition, the two oil spectrums also have a slight difference at the peak of the spectrum formed. The difference is mainly for the OH peak that is dominant in patchouli oil and the CH3 peak that is dominant in palm oil. The difference between pure patchouli oil and refined palm oil can be directly proven when palm oil is rubbed into the skin of the hands will feel slippery and does not absorb into the skin, whereas for patchouli oil when rubbed into the skin of the hands will feel hot and absorb into the skin and the scent that stung. into the nose feels the aroma of natural therapy. Outlier data or outlier data is a data that is different from other data that can interfere with the processing of information. Outlier data were detected using the Principal Component Analysis (PCA) and Hotekling 𝑇2
147
The results of checking outliers show that there is no data outside the ellipse line, so there is no data that needs to be discarded or deleted. Because there is no data deletion, all 40 samples can be used for classification. In general, there are seven vibrations (peaks and valleys) that can be seen from the NIRS spectrum. The first vibration at a wavelength range of 2150-2270 nm is the peak of NH2. According to literature, the wavelength of 2180-2200 nm was identified as a protein content. The second vibration at a wavelength of 1940 - 2020 nm is the peak which indicates the presence of R-OH molecules. The wavelength of 2000-2018 nm was identified as an abundant Patchouli alcohol content. However, the presence of R-OH is only found in patchouli oil while in refined palm oil there is no peak. The third vibration at the wavelength interval of 1970-1870 nm is a valley that indicates the presence of H-O molecules. The fourth vibration at the wavelength range of 1720-1580 nm is the peak which indicates the presence of CH, CH2, CH3 molecules indicated oil fat content. The fifth vibration at the wavelength interval of 1440-1400 nm is a valley that indicates the presence of H2O and R-OH molecules which corresponds to water content and patchouli alcohol. Moreover, the sixth vibration at a wavelength interval of 1350-1245 nm is the peak that indicates the presence of the CH3 molecule indicating the presence of fat content. The seventh vibration at a wavelength interval of 1220-1170 nm is a valley that indicates the presence of CH, CH2, CH3 molecules. Wavelength range from 1910 to 1830 nm indicates fat content. The sixth and seventh vibrations were more evident in the spectrum of refined palm oil while the patchouli oil spectrum was less visible. The results of the PCA analysis can be seen in Fig. 3.
This PCA analysis resulted in a total PC (PC1 and PC2) of 98% which meant that PCA was able to collect almost all data in two PCs to run the classification process. This fact shows that this classification works very well. It appears that there are two classification groups formed, namely the first cluster consisting of MN oil and the second cluster consisting of MS oil, 75% MNC and MNC 50%. This shows that PCA is able to distinguish between pure patchouli oil and the others. The existence of oil other than MN oil incorporated in one cluster is interesting to discuss. Where the position of MS oil, 75% MNC oil and 50% MNC in the PCA plot appears to be graded as presented in Fig 4. This explains the fact that the three oils experienced a gradual change in composition.
It can be seen that there are two classification groups formed namely the first cluster consisting of MN oil and the second cluster consisting of 75% MNC oil. This shows that PCA is able to distinguish between MN oil and 75% MNC oil. The results of this classification can be said to be very good because the data is classified at 100% where all data are collected into their respective clusters. On the other hand, the PCA analysis can also detect the adulteration od crude patchouli oil mixed with 50% of palm oil samples as presented in Fig. 5.
Based on Fig. 5, it showed that there are two classification groups formed namely the first cluster consisting of MN oil and the second cluster consisting of 50% MNC oil. This shows that PCA is able to distinguish between MN oil and 50% MNC oil. The results of this classification can be said to be very good
Fig. 2. Outlier detection by projecting spectra data onto PCA and Hotelling T2 ellipse.
Fig. 3. Authenticity classification using PCA for crude patchouli oil and mixed with 25% and 50% of palm oil.
Fig. 4. Authenticity classification using PCA for crude patchouli oil mixed with palm oil 75% : 25%.
because the data is classified at 100% where all data are collected into their respective clusters corresponds to loading plot analysis as presented in Fig. 6.
There are many peaks found, but there are three most dominant peaks. The first peak is in the length of 1940 nm - 2020 nm where the peak shows the presence of R-OH molecules identified as patchouli alcohol (PA). At the second peak for the wavelength of 1401 - 1480 nm where at the peak indicates the presence of two molecules namely H2O as the content of water content and O-H for the content of PA. And at the last peak or the third peak of the loading plot found at wavelengths of 1100 - 1900 nm are the CH, CH2 and CH3 molecules identified as fat content. The results showed that the most dominant substances affecting for PCA classification are fat and PA. The above can be understood because according to the data that the processed palm oil contains high concentrations of fat while pure patchouli oil contains approximately 30% PA content. Palm oil contained fat content that almost reached 98%. Some minor components found in fats (processed palm oil) such as sterols, tocopherols, lignin, cellulose and other components. Furthermore, the linear discriminant analysis (LDA) method uses the quadratic analysis discriminant method, where the quadratic method is a method commonly used for classification. However, the estimation of the parameters may not be the exact final position when it will be presented. Classification of plots using LDA reveal that the results of the LDA classification succeed in classifying pure patchouli oil, refined palm oil, mixed oil 75% and 50% by producing a validation accuracy rate of 82.5%. The results of the validation accuracy function are to predict the trend, so this is an advantage of the LDA method compared to the PCA method that cannot classify it for future authentications. There are four classification results, namely patchouli oil (MN), palm oil (MS), oil mixed 75-25% (MNC) and oil mixed 50-50% (MNC) can be seen in Figure 19. That the results of data classification this is significantly different between pure patchouli oil and refined palm oil and 75% or 50% blended oil. The results projected on the information can be said to be the latent variable results in LDA plots of 2 or 3 components. The LDA is a guided classification method, because this method is a category whose objects will be classified known before the model is made. For oil samples seen (oil falsified) have very close similarities. So, this shows that LDA is an effective method for the classification of oil for the purpose of authentic proof (authenticity) of patchouli oil for the presence or absence of counterfeiting.
4 CONCLUSION
This present study aimed to investigate the ability of near infrared technology in tandem with multivariate analysis for patchouli oil authentication and adulterant detection. Based on obtained results, it may conclude that near infrared technology combined with proper multivariate analysis is able to be employed as a rapid and non-invasive method for patchouli oil authentications and adulterant detections. The maximum total variance for classification model is 94% with 2 principal components of PCA and 2 latent variables of LDA. The primary chemical properties of oil samples correspond to authentication are patchouli alcohol and fat content in wavelength range around 1378-1926 nm.
5
ACKNOWLEDGMENT
We would like to thank for all support to the division of research and community services (LPPM) Syiah Kuala University especially for research funding through Penelitian Unggulan Unsyiah (PUU) research scheme 2020.
REFERENCES
[1] H. Chen, Z. Lin, and C. Tan, ―Fast quantitative detection of sesame oil adulteration by near-infrared spectroscopy and chemometric models,‖ Vib. Spectrosc., vol. 99, no. October, pp. 178–183, 2018, doi: 10.1016/j.vibspec.2018.10.003.
[2] T. Larkman, S. Garrigues, and M. De Guardia, ―Talanta Fast authentication of tea tree oil through spectroscopy,‖ Talanta, vol. 189, no. March, pp. 404–410, 2018, doi: 10.1016/j.talanta.2018.07.023.
[3] M. Kharbach, I. Marmouzi, M. El, A. Bouklouze, and Y. Vander, ―Journal of Pharmaceutical and Biomedical Analysis Recent advances in untargeted and targeted approaches applied in herbal-extracts and essential-oils fingerprinting - A review,‖ J. Pharm. Biomed. Anal., vol. 177, p. 112849, 2020, doi: 10.1016/j.jpba.2019.112849. [4] R. Xu et al., ―Spectrochimica Acta Part A : Molecular and
Biomolecular Spectroscopy Use of near-infrared spectroscopy for the rapid evaluation of soybean [ Glycine max ( L .) Merri .] water soluble protein content,‖ Spectrochim. Acta Part A Mol. Biomol. Spectrosc., vol. 224, p. 117400, 2020, doi: 10.1016/j.saa.2019.117400. [5] J. A. Cayuela-sánchez, J. Palarea-albaladejo, J. F.
García-martín, and C. Pérez-camino, ―Olive oil nutritional labeling by using Vis / NIR spectroscopy and compositional statistical methods,‖ Innov. Food Sci. Emerg. Technol., vol. 51, no. May 2018, pp. 139–147, 2019, doi: 10.1016/j.ifset.2018.05.018.
[6] D. S. Ferreira, O. F. Galão, J. A. L. Pallone, and R. J. Poppi, ―Comparison and application of near-infrared ( NIR ) and mid-infrared ( MIR ) spectroscopy for determination of quality parameters in soybean samples,‖ Food Control, vol. 35, no. 1, pp. 227–232, 2014, doi: 10.1016/j.foodcont.2013.07.010.
[7] A. A. Munawar, H. Syah, and Yusmanizar, ―Fast and robust quality assessment of honeys using near infrared spectroscopy,‖ in IOP Conference Series: Earth and Environmental Science, Nov. 2019, vol. 365, no. 1, doi: 10.1088/1755-1315/365/1/012053.
[8] Sudarjat, Kusumiyati, Hasanuddin, and A. A. Munawar, ―Rapid and non-destructive detection of insect infestations on intact mango by means of near infrared spectroscopy,‖ in IOP Conference Series: Earth and
149
Environmental Science, Nov. 2019, vol. 365, no. 1, doi: 10.1088/1755-1315/365/1/012037.
[9] Agussabti, Rahmaddiansyah, P. Satriyo, and A. A. Munawar, ―Data analysis on near infrared spectroscopy as a part of technology adoption for cocoa farmer in Aceh Province, Indonesia,‖ Data Br., vol. 29, Apr. 2020, doi: 10.1016/j.dib.2020.105251.
[10] A. A. Munawar, Kusumiyati, Hafidh, R. Hayati, and D. Wahyuni, ―The application of near infrared technology as a rapid and non-destructive method to determine vitamin C content of intact mango fruit,‖ INMATEH - Agric. Eng., vol. 58, no. 2, pp. 1–12, 2019, doi: 10.35633/INMATEH-58-31.
[11] C. Pasquini, ―Near infrared spectroscopy: A mature analytical technique with new perspectives – A review,‖ Anal. Chim. Acta, vol. 1026, pp. 8–36, 2018, doi: 10.1016/j.aca.2018.04.004.
[12] Y. Deng, Y. Wang, G. Zhong, and X. Yu, ―Simultaneous quantitative analysis of protein, carbohydrate and fat in nutritionally complete formulas of medical foods by near-infrared spectroscopy,‖ Infrared Phys. Technol., vol. 93, no. July, pp. 124–129, 2018, doi: 10.1016/j.infrared.2018.07.027.
[13] A. A. Munawar, Kusumiyati, and D. Wahyuni, ―Near infrared spectroscopic data for rapid and simultaneous prediction of quality attributes in intact mango fruits,‖ Data Br., vol. 27, Dec. 2019, doi: 10.1016/j.dib.2019.104789.
[14] Darusman, Zulfahrizal, Y. Yunus, and A. A. Munawar, ―Soil quality assessment by near infrared spectroscopy: Predicting ph and soil organic carbon,‖ Int. J. Sci. Technol. Res., vol. 8, no. 10, pp. 2512–2516, 2019. [15] Samadi, S. Wajizah, and A. A. Munawar, ―Near infrared
spectroscopy (NIRS) data analysis for a rapid and simultaneous prediction of feed nutritive parameters,‖ Data Br., vol. 29, Apr. 2020, doi: 10.1016/j.dib.2020.105211.
[16] R. Hayati, A. A. Munawar, and F. Fachruddin, ―Enhanced near infrared spectral data to improve prediction accuracy in determining quality parameters of intact mango,‖ Data Br., p. 105571, Apr. 2020, doi: 10.1016/j.dib.2020.105571.
[17] C. D. Iskandar, Zainuddin, and A. A. Munawar, ―Rapid assessment of frozen beef quality using near infrared technology,‖ Int. J. Sci. Technol. Res., vol. 9, no. 5, pp. 156–160, 2020.
[18] A. A. Munawar, D. von Hörsten, J. K. Wegener, E. Pawelzik, and D. Mörlein, ―Rapid and non-destructive prediction of mango quality attributes using Fourier transform near infrared spectroscopy and chemometrics,‖ Eng. Agric. Environ. Food, vol. 9, no. 3, pp. 208–215, Jul. 2016, doi: 10.1016/j.eaef.2015.12.004.
[19] D. Devianti, S. Sufardi, Z. Zulfahrizal, and A. A. Munawar, ―Rapid and Simultaneous Detection of Hazardous Heavy Metals Contamination in Agricultural Soil Using Infrared Reflectance Spectroscopy,‖ in IOP Conference Series: Materials Science and Engineering, Apr. 2019, vol. 506, no. 1, doi: 10.1088/1757-899X/506/1/012008.
[20] R. Agustina and A. A. Munawar, ―Electro-Optic Properties of Dried Pliek U Powder: Local Ingredients from Aceh,‖ in IOP Conference Series: Earth and Environmental Science, Nov. 2019, vol. 365, no. 1, doi: 10.1088/1755-1315/365/1/012042.
[21] R. H. Suci, Zulfahrizal, and A. A. Munawar, ―Applying LIBS-QCL spectrum coupled with principal component analysis to distinguish gayo arabica and robusta coffee,‖ Int. J. Sci. Technol. Res., vol. 8, no. 10, pp. 919–924, Oct. 2019.
[22] I. Ichwana, Z. Nasution, and A. Arip Munawar, ―near-infrared spectroscopy as a rapid and simultaneous assessment of agricultural groundwater quality parameters,‖ INMATEH Agric. Eng., pp. 233–240, Apr. 2020, doi: 10.35633/inmateh-60-26.
[23] Syahrul, Y. Yunus, P. Satriyo, and A. A. Munawar, ―Applying infrared reflectance spectroscopy to predict water quality in Aceh river,‖ Int. J. Sci. Technol. Res., vol. 8, no. 10, pp. 969–972, Oct. 2019.
[24] A. A. Munawar, Y. Yunus, Devianti, and P. Satriyo, ―Calibration models database of near infrared spectroscopy to predict agricultural soil fertility properties,‖ Data Br., vol. 30, Jun. 2020, doi: 10.1016/j.dib.2020.105469.
[25] E. Arendse, O. A. Fawole, L. S. Magwaza, and U. L. Opara, ―Non-destructive prediction of internal and external quality attributes of fruit with thick rind: A review,‖ J. Food Eng., vol. 217, pp. 11–23, 2018, doi: 10.1016/j.jfoodeng.2017.08.009.
[26] M. Ruiz-Altisent et al., ―Sensors for product characterization and quality of specialty crops-A review,‖ Comput. Electron. Agric., vol. 74, no. 2, pp. 176–194, 2010, doi: 10.1016/j.compag.2010.07.002.