983
Application Of GIS And Remote Sensing For The
Impact Assessment Of Integrated Watershed
Management Program: A Case Study Of Bassi
Block, Jaipur District
Garima Sharma, Dr R.N. SharmaAbstract: Jaipur district is characterized by low rainfall, degraded natural resources and scarcity of water resources. In Bassi block of Jaipur district, Integrated Watershed Management Program (IWMP) was implemented to effectively manage the natural resources of the area and to rehabilitate the degraded lands. This paper discusses the impact of IWMP on the land use pattern, soil moisture, vegetation and ground water resources. The assessment of the impact of the program is done with help of Geographic informative system (GIS) and remote sensing. For impact evaluation LISS-IV 5.8 m resolution satellite images are used for pre and post project impact assessment of the watershed area. The results indicate that the availability of water resources has increased in the area which changed the cropping pattern. There is significant change in the ground water level and soil moisture. The irrigated area has increased along with the decrease in the wasteland in the area. This watershed intervention in the area has improved the biodiversity and land degradation. Overall, the IWMP program at Bassi block has proved to be an effective solution for soil and water conservation.
Keywords: Ground Water Resources, Remote Sensing, Land Use Pattern, Vegetation, Watershed Management
————————————————————
1. INTRODUCTION
A watershed is a topographically delineated area that is drained by a stream system, i.e. the total land area that is drained to some point on a stream or river. A watershed is a hydrological unit that has been described and used as a physical-biological unit and also, on many occasions, as a socio-economic-political unit for planning and management of natural resources. Watershed Management is the process of implementation of best land use and water resources practices to improve and conserve the natural resources present in the watershed. The Watershed approach has conventionally aimed at treating degraded lands with the help of low cost and locally accessed technologies such as in -situ soil and moisture conservation measures, afforestation etc. and through a participatory approach that seeks to secure close involvement of the user-communities. It aims in the promotion of the economic development and improvement of the socio-economic conditions of the resource poor sections of people living in the program areas. Integrated watershed management program (IWMP) is a flagship program of Department of Land Resources (DoLR), Ministry of Rural Development, Government of India. Watershed development in India is reckoned as the engine of growth and sustainable development in the rainfed and drought-prone areas. Hence, the watershed development program in general receives good policy support at the national and state levels. The program was launched to target watershed development with a focus to improve food security, alleviate poverty and sustain the quality of the natural resource base. Rajasthan is the pioneer State in Watershed Development and is implementing the IWMP of Government of India since 2009-10. The watershed program was implemented in the study area in the year 2011-2012 under phase II.
Watershed Management is an essential measure for the overall bio-physical and socio-economic development. To combat over exploitation of natural resources, the use of advance technologies is indispensable. Geographic Information Systems (GIS) are an effective tool for storing, managing, and displaying spatial data often encountered in water resources management. Geographical Information System is mainly a system of computer hardware and software that organizes and stores geographical data for counting, analysis and individual planning. In other words, it is an information technology which analyzes spatial and non-spatial data after its collection. The present study is to produce the land use/land cover map of Bassi block by remote sensing technology in order to assess the change in the area occupied by build-up, agriculture, water resources, wasteland and forest.
2. STUDY AREA
The study area (macro-watershed no. 0703170206 & 0703170208) is located in Jaipur district of Jaipur region, the North-Eastern district of the state, falls between 491593 and 627359 Easting and 3082192 and 2924555 Northing. The district is bounded in the north by Sikar District, in the east by Alwar District, in the South by Tonk District, in the Western by Nagaur District. The total area of the district is 484.6 Sq.km. Jaipur (IWMP) 2/2009-10 Project is located in Bassi Block, of Jaipur district. The project area is between the Easting 613389 and 619095 and Northing 2961258 and 2966115, at a distance of 20 km from its Block headquarters and 45 Kms from the district headquarters. The selected micro-watershed code is 070317020804 & 070317020805, occupies an area of 1342.68 Ha. (28.04% area) out of total macro-watershed area 4786.75 Ha. The selected area falls under Bhoorla & Rajpura Patalwas Gram Panchayat. The study area is occupied by 11 census villages namely Rojwari, Baori Ka Bas, Lalawala, Chak Rojwari, Prithvipura, Bhoorlam Ramsar, Rajwas, Charangarh, Tekchandpura & Rajpura Patalwas. The study area exhibits gently flat topography with occasional ruggedness due to fluvial action. Such small sheet wash areas with less soil thickness further hosts scrub land. The watershed falls in agroclimatic zone III A. The soil is sandy loam in texture. The
________________
Research Scholar, Department of Geography, University of Rajasthan, Jaipur
average rainfall is 556 mm. The temperatures in the area are in the range between 32 to 46 centigrade during summer and 4 to 28 centigrade average temperatures during winter. The major crops in the area are Bajra, Gwar, Moong, Wheat, Barley and Mustard.
Fig.1. Location map of the micro-watershed in Bassi block, Jaipur
3. OBJECTIVES
The objectives of the study are to assess the impact of Integrated Watershed Management Program (IWMP) on the basis of:
3.1 Land cover of the study area
3.2 Change in soil moisture and ground water level. 3.3 Change in the cropped area and vegetation cover.
4. HYPOTHESIS
The hypothesis of this paper is that there is a positive impact on ground water level, cropped area, vegetation and soil moisture in the study area after the implementation of IWMP.
5. METHODOLOGY
The study of the research area is based on data of remote sensing. The satellite data has been utilized to prepare thematic maps of land-use, wasteland, vegetation, forest, soil moisture and waterbody. The Indian Remote Sensing (IRS)-P6 (ResourceSAT-1) LISS-IV satellite imageries of the year 2011-12 and year 2017-2018 are used for the pre-project and post-project assessment of the study area. The maps have been prepared in GIS environment using Arc lnfo, ERDAS and Auto-CAD software. The mapping scale for the study is 1:10000. The projection system in the study is UTM (Zone 43). The obtained images set are classified into different categories viz. built-up area; agriculture area, forest, waste land, fallow land water and crop land. The polygons were identified by independent labels on the images. The polygons identified are labelled as training sites. The training sites further developed
theme. Different colors show different categories of land cover. To see the land use categories and its changes during pre and post project, the visual interpretation method is applied. By interpreting the data of land use pattern, soil moisture, vegetation and crop pattern the impact of integrated watershed management program is analyzed in the study area. For ground water level, the wells were identified by remote sensing. The data related to depth of water level below ground level before and after the project was obtained from Department of Ground Water, Jaipur.
Table.1. Standards for the database
Database standards
Mapping scale 1:10000
Projection system UTM (Zone 43)
Spheroid WGS84
Datum WGS84
Minimum map-able unit 900sqm.
Proposed satellite data IRS ResourceSat LISS-IV Spatial resolution 5.8 meter
Spectral bands
B2 0.52 – 0.59 B3 0.62 – 0.68 B4 0.77 – 0.86 Image radiometric resolution 10 bit
Temporal resolution 5 days revisit period Image XY Positional Accuracy in
meter 0.5 mm of scale
Image classification accuracy 100/100
6. RESULT AND DISCUSSION
The impact of Integrated watershed management program is based on certain indicators at watershed level. These indicators include land use pattern, crop pattern, soil moisture, crop productivity and ground water level.
6.1 Land Use Pattern
985
Fig.2. Land Use Map-Pre Project (Year 2011-12)
Fig.3. Land-use map- Post Project (Year 2017-2018)
On the basis of the interpretation of the above satellite images, (Fig.2 and Fig.3) data of different classes of land use pattern is obtained and compared.
Table.2. Land Use data of pre-project (year 2011) and post project (year 2018)
Land Use Class
Pre-Project (2011-2012)
Post-Project (2017-2018)
Change in area
Area (ha*)
Area (%)
Area (ha)
Area (%)
Area(ha)
Agricul ture
751.775 38
55.990 32
899.224 53
66.971 95
+147.44 9
Built Up Area
71.1291 34
5.2975 17
77.1458 29
5.7456 25
+6.016
Forest 116.906 71
8.7069 14
116.529 75
8.6788 39
-0.38
Waste lands
402.877 30.005 25
248.980 12
18.543 41
-153.897
Waterb ody
00 00 0.80798
9
0.0601 77
+0.807
Source: Intepretation of Satellite Image *ha=hectares
On comparing the data of land use pattern of the year 2011 and year 2018(table 2), it is found that the total agriculture area has increased by 8% (751ha to 889 ha) after the implementation of the project. The wastelands in the study area has decreased by 37% from 408 ha in the year 2011 to 208 ha in the year 2018. The major impact has been seen on water bodies. There were no significant water bodies in the study area in the year 2011 whereas, after the implementation of IWMP the water bodies cover 0.80 ha area of the study area. The increase of built-up area and decrease of forest area during this period can be a result of growing population and urbanization in the study area.
6.2. Cropping Pattern
Table.3. Cropping pattern data of pre-project(year-2011) and post-project(year-2018)
S.No. Agriculture Class Pre Project (2011) Post Project (2018) Change in the area in ha
Area(ha) Area (%) Area(ha) Area (%)
1. Current fallow 658.6078875 87.607 600.5450595 66.784773 -50.06
2. Double Crop 16.15039446 2.148301 58.50341418 6.5059851 +42.35
3. Kharif Crop 49.93052369 6.641681 39.78624853 4.4245066 -10.15
4. Rabi Crop 27.0865752 3.603014 200.3898108 22.284736 +173.15
Source: Interpretation of satellite data
It can be observed in the table 3 that the watershed intervention has helped in increasing the double crop area by 42 ha between the year 2011 and year 2018. The fallow land is the land which is cropped for one particular season and left vacant for a short period of time to restore soil fertility. The fallow land has decreased by 50.06 ha of area. The area occupied by kharif crop has decreased by 10.15 ha however a significant improvement in the rabi crop is seen. The rabi crop area has increased 173.15 ha. Before the implementation of the project, only 27.08 ha of land was occupied by rabi crop. This has increased to 200.398 ha by the year 2018.
6.3 Wasteland
Wasteland is an unproductive land which cannot be used for crop production, built-on or any other purpose. The quality of wasteland is very poor which makes is useless. The IWMP in the study area has improved the quality of the land. Due the increase in the soil moisture the wasteland in the study area has significantly reduced.
Table.4. Wasteland data of pre-project(year-2011) and post-project(year-2018)
S.N o.
Wastel and Class
Pre Project (2011) Post Project (2018) Chan ge in Area( ha) Area(h
a) Area(ha) Area(ha) Area(ha)
1. Land with Scrub
309.56 471
76.838 517
188.207 602
75.591 418
-121.3 6
2. Land without Scrub
93.312
286 23.161483 60.7725168 24.408582 -32.54
Source: Interpretation of satellite data
According to table 4, the wasteland in the study area has been decreased by 153.89 ha. The reduction took place in both the
before the program. this has decreased to 188.207 ha after the program. In case of land without scrub has decreased from 93.312 ha land in the year 2011 to 60.77 ha land in the year 2018. This shows that land quality of the study area has improved after the implementation of IWMP in the study area.
6.4 Ground Water Level
The major impact of the IWMP is on ground water recharge and availability. During the implementation of watershed program, various soil and water conservation methods were employed in the region which helped in improving the depth of water level below ground level.
Fig.4. Well Location Map in the year 2018
987
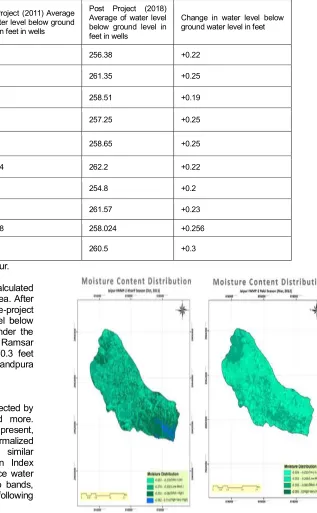
Table.5. Water level data of pre-project(year-2011) and post-project(year-2018)
S.No. Name of Villages No. of wells in the villages
Pre Project (2011) Average of water level below ground level in feet in wells
Post Project (2018) Average of water level below ground level in feet in wells
Change in water level below ground water level in feet
1. Rojwari 6 256.6 256.38 +0.22
2. Charangarh 6 261.6 261.35 +0.25
3. Tekchandpura 6 258.7 258.51 +0.19
4. Rajpura Patalwas 8 257.5 257.25 +0.25
5. Baori ka Bas 5 258.9 258.65 +0.25
6. Lalawala 5 262.44 262.2 +0.22
7. Prithvipura 2 255.1 254.8 +0.2
8. Bhoorla 4 261.8 261.57 +0.23
9. Chak Rojwari 5 258.28 258.024 +0.256
10. Ramsar 8 260.8 260.5 +0.3
Source: Department of Ground Water Resources, Jaipur.
The average of water level below ground level was calculated for all the wells found in every village of the study area. After comparison of ground water level data between pre-project and post-project, it is found the depth of water level below ground level is decreased in every village falling under the study area. The water level has improved maximum in Ramsar as seen in table 5. The water level came up by 0.3 feet whereas the minimum impact was noticed in Tekchandpura where the water level came up by 0.19 feet.
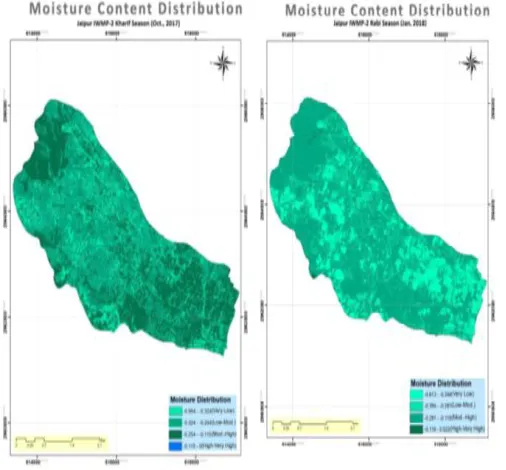
6.5. Soil Moisture
Soil moisture is the water stored in the soil and is affected by precipitation, temperature, soil characteristics, and more. These same factors help determine the type of biome present, and the suitability of land for growing crops. The Normalized Difference Water Index (NDWI) is derived using similar principles to the Normalized Difference Vegetation Index (NDVI) to enhance the spectral reflectance of surface water bodies, where the comparison of differences of two bands, green and near-infra-red (NIR) is made with the following formula –
NDWI = (Green – NIR) / (Green + NIR)
Mapping of water bodies for different seasons using this technique helped in analyzing the changes in water areas.
Fig. 7 and 8: Moisture Content in Kharif and Rabi season respectively- Post Project, year 2017-18
Satellite images of soil moisture (Fig. 5-8) is obtained for two seasons- Kharif and Rabi seasons. The soil moisture is greater in Rabi season as compared to Kharif season due to the high temperature during summers. The NDWI product is dimensionless and varies from -1 to +1 depending upon water content. High NDWI values corresponds to high soil moisture and low NDWI values shows low moisture content in the soil. From the study and interpretation of satellite image(table 6), it is found out that moisture content in soil has increased tremendously in the Rabi season post project. The area with very high moisture content has increased by 288.9% in the Rabi season. The soil moisture in the kharif season has improved. There is a reduction of area with low to nil soil moisture during Kharif season by 33%. Also, agricultural area exhibits a noteworthy level of moisture, most of which is due to ongoing cropping activities at the time of satellite data acquisition. That exhibits a healthy cropping pattern in the area
Table.6. Range of moisture content found in Kharif and Rabi season pre and post project (Year 2011-12 and year 2017-18)
S.No. Soil Moisture Kharif Season Rabi Season
Pre Project (2011) Area(ha)
Post Project (2017) Area(ha)
Change in Area (%)
Pre Project (2012) Area(ha)
Post Project (2018) Area(ha)
Change in Area (%)
1. Low - Nil 289.742208 198.793893 -31% 172.999862 162.704934 5.81%
2. Mod. - Low 657.155986 655.71157 -0.21% 742.777206 334.805153 -54%
3. High - Mod. 366.143834 487.86773 +33.24% 426.776157 841.155509 +97.09%
4. Very High 29.646191 0.315026 -98% 0.134994 4.022622 +2881.9%
Source: Interpretation of satellite data
7. CONCLUSION
The Integrated Watershed Management Program (IWMP) has positive impact on the water resources, vegetation, crop pattern and wastelands in micro watershed of Bassi block, Jaipur District. The major impact is seen on the availability of surface water and ground water resources because of which land use pattern and cropping pattern has improved. There was no significant water body found in the study area before the project however the presence of water body is noticed after the implementation of the project. The wasteland has converted into productive lands which has reduced the land degradation in the area. More land is occupied by the agriculture activities and resulted into intensifying the crop productivity. Ground water resources status has improved after the implementation of the program. The ground water level has improved in all the village in the area. The soil moisture content
summaries, the integrated watershed management program (IWMP) improved ground water and surface water resources, minimized land degradation, reduced runoff, soil loss and wasteland, enhanced vegetative cover and improved biodiversity; and finally brought prosperity to the people in the watershed villages. Effective and efficient implementation of IWMP has a potential to bring all over socio-economic development along with sustainable conservation of natural resources in watershed. The project has achieved equitable distribution of the benefits of land and water resources development and the consequent bio-mass production. Adequacy of the efforts are required in order to maintain the infrastructure developed under the scheme.
8. ACKNOWLEDGEMENT
989
9. REFERENCES
[1] C. H. Hanumantha Rao, (2000) Watershed Development in India: Recent Experience and Emerging
Issues, Economic and Political Weekly, Vol. 35, No. 45, pp. 3943-3947.
[2] Dr. Joshi K.N, (2010) Shrinking of Water Resource Due to Anthropogenic Activities in Urban Area (A case Study of Jaipur Using Remote sensing and GIS), Institute of Development Studies, Jaipur (INDIA), working paper 154 [3] Government of Meghalaya, Watershed Development
Guideline, Department of Community and Rural Development, Government of Meghalaya, Meghalaya. [4] Gupta K. Rupesh, (2011) Change Detection Techniques for
Monitoring Spatial Urban Growth of Jaipur City, Institute of Town Planners, India Journal, 88 – 104
[5] Masser, I. (2001) Managing our Urban Future: The Role of Remote Sensing and Geographic Information Systems, Habitat International, Vol.25, pp.503-512.
[6] Pathak Prabhakar, Chourasia k. Anil, Wani P. Suhas, and Sudi Raghavendra, (2013) Multiple Impact of Integrated Watershed Management in Low Rainfall Semi-Arid Region: A Case Study from Eastern Rajasthan, India, Journal of
Water Resource and Protection, 5, 27-36
[7] Sheng T.C, (1990) Watershed Management Field Manual, FAO conservation guide.
[8]S. P. Wani, K. H. Anantha, T. K. Sreedevi, R. Sudi, S. N. Singh and M. D’Souza, (2011) Assessing the Environmental Benefits of Watershed Development: Evidence from the Indian Semi-Arid Tropics, Journal of Sustainable Watershed Science & Management, Vol. 1, pp. 10-20.
[9] Sundaram A., (2012) Empirical Study on Impact of Integrated Watershed Development Project in Mizoram State of North East India, IOSR Journal Of Humanities And Social Science (JHSS) Volume 5, Issue 3 (Nov. - Dec. 2012), PP 07-13
[10] Tsihrintzis Vassilios A., Hamid Rizwan and Fuentes R. Hector. (1996) Use of Geographic Information Systems (GIS) in Water Resources: A Review, Water Resources Management, 10: 251-277
Hyperlinks
[11] https://eos.com/ndwi/