An Experimental and Modelling Investigation into the Solid-Phase
Extraction o f Pollutants from Water
A Thesis Presented to the University o f London for the Degree o f Doctor o f Philosophy in the Faculty o f Science
By Ca ro lin e El iz a b e th Gr een
Sir Christopher Ingold Laboratories Chemistry Department
ProQuest Number: U642328
All rights reserved
INFORMATION TO ALL USERS
The quality of this reproduction is dependent upon the quality of the copy submitted.
In the unlikely event that the author did not send a complete manuscript and there are missing pages, these will be noted. Also, if material had to be removed,
a note will indicate the deletion.
uest.
ProQuest U642328
Published by ProQuest LLC(2015). Copyright of the Dissertation is held by the Author.
All rights reserved.
This work is protected against unauthorized copying under Title 17, United States Code. Microform Edition © ProQuest LLC.
ProQuest LLC
789 East Eisenhower Parkway P.O. Box 1346
Abstract
The use of Solid-Phase Extraction (SPE) in the detection and monitoring of
pollutants in water is reviewed. The main emphasis of this work is on the
thermodynamic and kinetic processes involved in this extraction technique using
octadecyl (Cig) SPE disks.
The equilibrium constant K@q, and the uptake rate constant kup, have been
determined for the partitioning of twenty-one pollutants between water and a Cig SPE
disk in a ‘closed’ system utilising ultraviolet spectroscopy (UV) and gas
chromatography - mass spectroscopy (GC-MS). The offloading rate constant kofr, is
obtained indirectly from K@q and kup. The twenty-one pollutants were chosen to
represent a wide range o f solute physico-chemical properties such as dipolarity /
polarisability, hydrogen-bond acidity and basicity and size. The equilibrium and rate
constants were regressed against the corresponding solute descriptors to produce
Linear Free Energy Relationships (LFERs) for Keq, kup and koff taking on the general
form:
log SP = c + r.Ri + s.Tti" + a.Za2^ + b.ZPi^ + v.Vx
where log SP is log K«q, log kup or log kos, R2 is a solute excess molar refraction, 712^ is
the solute dipolarity / polarisability, Ea2^ and ZP2" are the solute overall hydrogen-bond
acidity and basicity and Vx is the McGowan characteristic volume of the solute. These
LFERs provide a means for predicting log Keq, log kup and log kos for a given pollutant
provided the solute descriptors are known. They also allow for some interesting
It is shown how the work in this thesis is relevant to the partitioning of
pollutants between water and a novel Aquatic Passive Sampler (APS), highlighting
areas of applicability for the physical constants determined for the system in this work
Table o f Contents
Page No.
Abstract i
Table of Contents iii
List of Tables x
Acknowledgements xiii
Chapter 1 Review o f Previous Pollutant Detection Methods
1.0 Pollutants 1
1.1 Liquid-Liquid Extraction 5
1.2 Solid-Phase Extraction 6
1.3 Biomonitoring 8
1.4 Passive Sampling 9
1.5 References 11
Chapter 2 Review o f Solid-Phase Extraction
2.0 Solid-Phase Extraction 17
2.1 The Basic Principles 17
2.2 Solid-Phase Extraction Cartridges 21
2.2.1 Design 21
2.2.2 Applications and advantages of SPE cartridges 22
2.2.3 Disadvantages of SPE cartridges 23
2.3 Solid-Phase Extraction Disks 24
2.3.1 Design 24
2.3.2 Applications and advantages of SPE disks 25
2.3.3 Disadvantages of SPE disks 26
2.4 Solid-Phase Micro Extraction 27
2.4.1 Design 27
2.4.2 Applications and advantages of SPME 28
2.4.3 Disadvantages of SPME 29
2.5 References 31
Chapter 3 Introduction to the European Union Aquatic Passive Sampler
3.0 The Aquatic Passive Sampler 35
3.1 Design of the Aquatic Passive Sampler 36
3.1.1 Theoretical considerations of design 3 8
3.2 The Rate-Limiting Membrane 40
3.2.1 Polysulphone membrane 41
3.2.2 Low density polyethylene membrane 41
3.3 The Receiving Phase 41
3.4 The Body of the Aquatic Passive Sampler 42
3.5 References 43
Chapter 4 Introduction to the Abraham Solvation Equation
4.0 Linear Free Energy Relationships 46
4.1 The Abraham Solvation Equation 46
4.1.3 The solute dipolarity / polarisability scale, 712^ 52
4.1.4 The solute hydrogen-bond acid scale, Z ai" 54
4.1.5 The solute hydrogen-bond base scale, Zp2^ 56
4.2 Applications o f the Abraham Solvation Equation 58
4.3 Multiple Linear Regression Analysis 60
4.3.1 Limitations of multiple linear regression analysis 62
4.3.2 Multiple linear regression and the Abraham Solvation Equation 63
4.4 References 66
Chapter 5 Introduction to Reaction Equilibrium and Rates
5.0 Reaction Equihbrium and Rates 69
5.1 Enthalpy 69
5.2 Entropy 70
5.3 Gibbs Free Energy 71
5.4 The Equilibrium Constant 72
5.5 The Rate of Reaction 73
5.6 Temperature Effects on Reaction Equilibrium and Rate 79
5.6.1 The van’t Hoff equation 79
5.6.2 The Arrhenius equation 80
5.7 References 82
Chapter 6 Aims o f the Present Work
Chapter 7 The Determination o f Physical Constants
7.0 Introduction 86
7.1 The Set of Pollutants 88
7.2 Determination of Equilibrium and Rate Constants Utilising Ultra Violet
Spectroscopy 89
7.2.1 Calculating the volume of the disk 90
7.2.2 Calculating the equilibrium constant 91
7.2.3 Calculating the uptake rate constant 91
7.3 Determination of Equilibrium and Rate Constants Utilising Gas Chromatography-
Mass Spectroscopy 96
7.3.1 Calculating the uptake rate constant 97
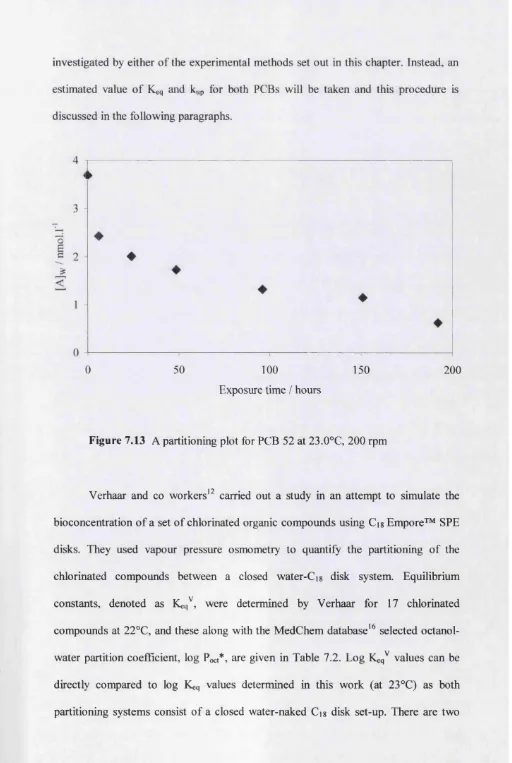
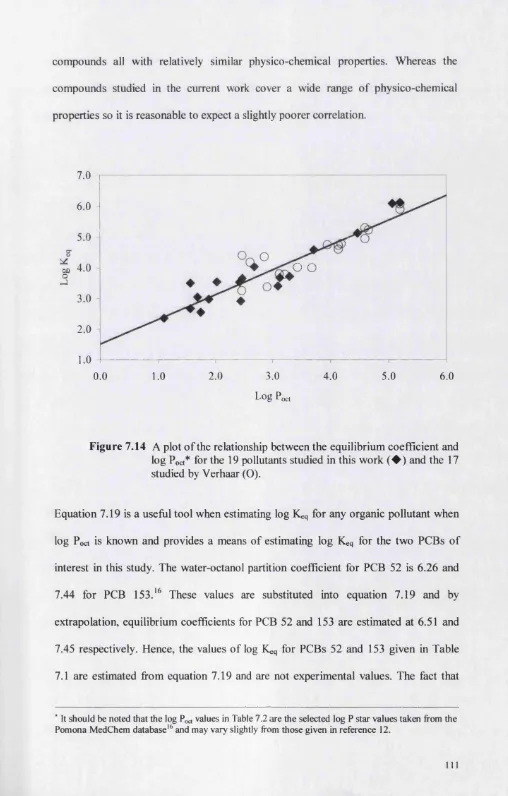
7.4 Results and Discussion 99
7.4.1 Comparing the equilibrium and rate constants to existing data 113
7.5 Experimental for the UV Spectroscopy Procedure 131
7.5.1 Materials and solutions 131
7.5.2 Instrumentation 131
7.5.3 Collection of partition data - on-line 132
7.5.4 Collection of partition data - off-line 133
7.6 Experimental for the GC-MS Procedure 134
7.6.1 Materials and solutions 134
7.6.2 Instrumentation 135
7.6.3 Collection of partition data 136
7.6.4 Pollutant extraction from water 137
Chapter 8 Effects o f Temperature and Stirring Rate on Solid-Phase Extraction
8.0 Introduction 141
8.1 Results and Discussion 144
8.1.1 Temperature effects on Keq 144
8.1.2 Stirring rate effects on K@q 149
8.1.3 Temperature effects on kup 150
8.1.4 Stirring rate effects on kup 154
8.2 Conclusions 155
8.3 References 158
Chanter 9 Characterisation o f the Water-Ci« Solid-Phase Extraction Disk System
9.0 Introduction 159
9.1 The Equilibrium Constant 165
9.2 The Uptake and Offloading Rate Constants 173
9.3 References 178
Chapter 10 Determination o f ICq, k„p, and knfT for the European Union Aquatic Passive Sampler
10.0 Introduction 179
10.1 Calculating the Equilibrium Constant 181
10.2 Calculating the Uptake Rate Constant 182
10.3 Results 183
10.3.1 Data obtained by Kingston 183
10.3.2 Data obtained in the current work 183
10.4 Discussion 185
10.4.1 Comparing Keq for water-Cig disk and water-APS systems 185
10.4.2 Comparing k„p and koff for ‘closed’ water-Cig disk and water-APS
systems 188
10.4.3 Comparing k„p and koff for ‘closed’ and ‘open’ water-APS systems 190
10.5 Applying the Huckins Equation to the ‘Open’ Water-APS System 193
10.6 Conclusions 196
10.7 Experimental 197
10.8 References 198
Chapter 11 Determination o f Solute Descriptors for Pesticides
11.0 Introduction 199
11.1 Calculation o f Partition Coefficients 202
11.2 Determination of Descriptors 204
11.3 Results 208
11.3.1 Diuron 208
11.3.2 Dieldrin 215
11.3.3 Atrazine 220
11.3.4 Metaxon 223
11.4 Discussion 227
11.5 Conclusions 234
11.6.2 Solubility measurements 235
11.7 References 237
Chapter 12 Conclusions and Suggestions for Future Work
12.0 Conclusions 239
12.1 Suggestions for Future work 241
List o f Tables
Table 2.1
Table 4.1
Table 4.2 Table 7.1 Table 7.2 Table 7.3 Table 8.1 Table 8.2 Table 8.3 Table 8.4 Table 9.1 Page No.
Examples of sorbents, typical eluting solvents and characteristics 20
o f the analyte that can be extracted from the aqueous sample
Atom contributions for calculation o f Vx (in cm^ mol'^) 51
An example of the output for the MLR analysis of log Keq and the 65
Abraham solute descriptors
Imax in water, extinction coefficients and experimental log Keq, 121
log kup and log kofr values for the twenty-one pollutants studied in
this work
Some physical data for the twenty-one pollutants studied in this 127
work and the seventeen chlorinated compounds studied by
Verhaar
Selective ion monitoring conditions used for the identification of 136
the pollutants analysed by GC-MS
Water-Ci8 disk equilibrium and uptake rate constants, 144
corresponding standard deviations and some physical constants
for diuron
Some thermodynamic constants for the partitioning of pollutants 148
between water and the Cig disk
Log Keq for diuron at varying stirring rates 150
Log kup for diuron at varying stirring rates and temperatures 152
Table 9.2 The solute descriptors used in the development of the Abraham 164
solvation equations in the current work
Table 9.3 Output for the MLR analysis of log Keq and the Abraham solute 166
descriptors
Table 9.5 The equation coefficients for some water-solvent systems of 169
interest
Table 9.6 Output for the MLR analysis of log k„p and the Abraham solute 173
descriptors
Table 9.7 Output for the MLR analysis o f log koff and the Abraham solute 175
descriptors
Table 10.1 Log Keq, log kup and log koff for diuron partitioning in water-Cig 184
SPE disk and water-APS systems
Table 11.1 Coefficients in equation 4.3 and 11.1 for various processes 206
Table 11.2 Measured and calculated values of log Ss, and selected log VP 209
and log Sw values for diuron
Table 11.3 The observed and calculated values of log P and log Ls for the 211
diuron training set
Table 11.4 The predicted and observed values of log P and log Ls for the 212
diuron test set
Table 11.5 Initial and refined solute descriptors for diuron 213
Table 11.6 Measured and calculated values of log Ss, and selected log VP 216
and log Sw values for dieldrin
Table 11.7 Final solute descriptors for dieldrin 218
Table 11.8 The observed and calculated values of log P and log Ls for 219
dieldrin
Table 11.9 Literature values of log Ss, and selected log VP and log Sw values 220
for atrazine
Table 11.10 The observed and calculated values of log P and log Ls for 222
atrazine
Table 11.11 Final solute descriptors for atrazine 223
Table 11.12 Measured and calculated values of log Ss, and selected log VP 224
and log Sw values for metaxon
Table 11.13 The observed and calculated values of log P and log Ls for 225
metaxon
Table 11.14 Final solute descriptors for metaxon 226
Table 11.15 The derived Abraham solute descriptors for pesticides and known 227
descriptors for various other compounds
Acknowledgements
My sincerest thanks go to my Ph.D. supervisor. Dr Michael Abraham. His knowledge
and expertise in the area of physical chemistry coupled with his unfailing
encouragement, patience and guidance has helped me to accomplish my Ph.D.
I am very grateful to my research group past and present; Vikas Gupta and Julian
Dixon for their advice and support when I first started out; Dr Jamie Platts for his
great patience when explaining the ins and outs o f QSAR to me; and Joelle Gola,
Joelle Le and the rest of the team for all of their encouragement over the years.
I would like to offer a particularly big thank you to Jenny Kingston, for whom, as part
of the European Union collaboration, has provided me with a mass of data, technical
knowledge and a great friendship. I would also like to wish her and Lena Bjorklund-
Persson good luck in the completion of their own research.
I extend my gratitude to Dr Richard Greenwood, Dr Graham Mills and everyone else
involved in the European Union project for their advice on technical issues and for
making progress meetings so enjoyable. I have made some very good friends over the
past three and a half years and wish everyone well in the future.
Thank you to the European Union for the funding this project and giving me the
opportunity to study for this Ph.D.
Contract No.: SMT4-CT96-2114 (DG 12-RSMT)
Thank you to Dr William Acree Jnr. for providing me with the opportunity to visit
The University of North Texas to carry out some very interesting research and for
some of the solubility data included in this work.
Finally, I would like to thank my family and friends for putting up with me during this
Ph.D. My parents, to whom this thesis is dedicated, have shown never-ending
encouragement, love and support and I would not have got this far without it. All of
my friends, particularly Rachel Jones, Jamie Kirk, Richard Boulton and Bethany
Blowers for their tireless understanding and for always being there when I needed
Chapter 1 Review o f Previous Pollutant Detection Methods
1.0 Pollutants
There are currently about 70000 organic compounds in commercial
production, with approximately 1000 being added every year. Roughly one third of all
organic compounds produced end up in the environment due to misuse, carelessness
and leaching, which in turn, can lead to contamination of surface and ground waters.*
The presence o f pollutants in water, a substance vital to human beings, animals and
plants, is causing a great deal of global concern. Pesticides, polychlorinated biphenyls
(PCBs), polycyclic aromatic hydrocarbons (PAHs), phthalates and phenols etc. are
among some o f the most hazardous and toxic of the organic pollutants to enter
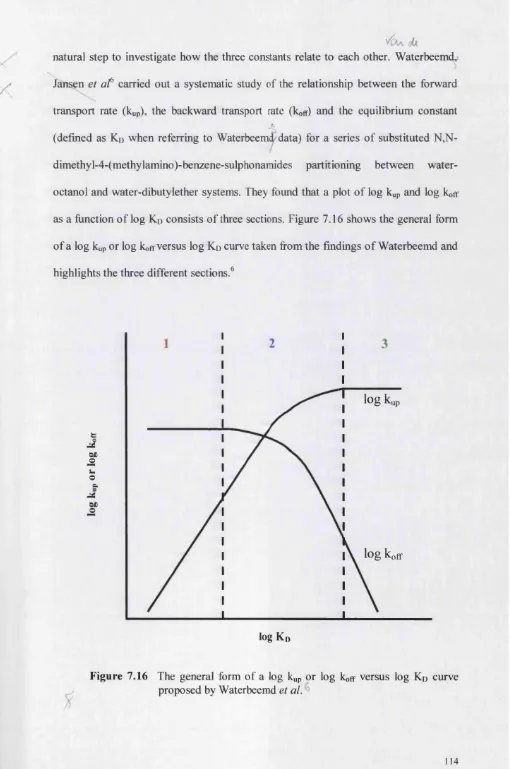
environmental waters.^’^’"* Figure 1.1 shows the structures of some common pesticides,
PAHs and PCBs.
Pesticides are o f particular concern due to their common use, toxicity and
p ersistence in the environment. Pesticides are toxic by nature as they are specifically
designed fo r^ h ^ ^ e in agriculture, industry and households in the control of weeds
(herbicides), insects (insecticides), fungi (fungicides), rodents (rodenticides), molluscs
(moUuscicides), mites (acaricides), aphids (aphicides) and eggs (ovicides). They are
also used as fumigants and r e p e lle n ts .P C B s have been used in the past as
transformer coolants, dielectric fluids, solvents and flame-retardants. The
characteristic properties of PCBs and some pesticides are hydrophobicity or low
aqueous solubility, relatively low vapour pressure and resistance to chemical
reactions. These properties result in persistence in the environment and
accumulation in soils, sediments, plankton, marine animals and all the way through
Herbicide: Diuron Herbicide: Atrazine
Cl
C l
NH CHj
C N
/ / \
O CH3
Cl
N N
C H j ^ ^ N H N N HCH( CHj)2
Insecticide: Dieldrin
Cl
o
l|[jCcjljC
a
Cl
Cl
Herbicide: Mecoprop
Cl
O O
CH3 CH3 OH
PAH: Naphthalene PAH : Phenanthrene
\
PCB 52 PCB 153
C l Cl
Cl Cl
C l Cl
combustion of wood, petrol, oil and coal/ Since these commodities are part of society
and will continue to be used in the near fiiture, it is not surprising that PAHs are found
in relatively high concentrations in the environment.
All o f these pollutants can enter the water system in a number o f ways. The
amount o f pesticides in water largely depends on the intensity o f food production in a
given area (which in turn determines the amount of pesticide applied), the season,
precipitation and flow rate of the water. The majority o f pesticides are directly applied
to crops by spraying or sowing in the soil and can then enter the water system by
leaching off the fields into rivers or underground supplies. Pesticides used to control
aquatic weeds and pests are directly introduced to the water system and effluent from
plants using pesticides also contribute to the contamination of water. ^ The synthesis
and use of PCBs and DDT was phased out in the 1970s due to the very hazardous
impact these pollutants have on the environment. Despite this, levels of both PCBs
and DDT and its metabolites have been identified in water, sediment, molluscs, eggs,
fish, mammals and humans. A number of papers have been published confirming
that PCBs have been found in remote reservoirs and polar regions due to
transportation by atmospheric precipitation from the initial region of contamination.^^
Consequently, monitoring for the presence of organic pollutants is a
requirement of both European and American legislation. The European Union
directive on the quaUty of water intended for human consumption allows a maximum
concentration for total pesticides in drinking water o f 0.5 pg.l'^ and a concentration of
0.1 pg.r^ for individual pesticides and related compounds. The monitoring for
pollutants must satisfy two criteria: 1) long term assessment of pollutant trends and 2)
short term, or episodic, assessment of increased pollutant concentration in
a programme of direct sampling. Possible pollutants are identified according to
regional usage patterns, representative samples are taken fi-om specific points at
specific time intervals and transported back to the laboratory for analysis. Since the
concentration of pollutants in the aquatic samples is low (ranging fi*om pg - pg.l'^)
isolation and pre-concentration of the specific pollutants is necessary prior to
analytical analysis. The favoured techniques are liquid-liquid extraction
sohd-phase extraction or more recently introduced, solid-phase micro
extraction (SPME)."^*"^^ Direct sampling provides an accurate determination of
pollutants in a particular place, and at a particular time. The results from these
sampling studies are combined and used for the assessment of historical trends in
pollutant levels. However, to accurately determine the true pollutant concentrations
over a period of time (or time-integrated sampling as it is more commonly named),
samples must be taken frequently enough so that fluctuations in pollutant
concentrations are not missed. This means direct sampling programmes can be time-
consuming, expensive and labour intensive and have down falls where spatial and
temporal variations in pollutant levels are observed.
Biomonitoring^^^^ and passive sampling devices^^'^^ are examples of time-
integrated, in-situ sampling methods that provide information on the continuously
varying concentrations of pollutants in a given water system over a given period of
time. These methods add another dimension to the procedure of determining
pollutants in water, by highlighting fluctuations in pollutant concentrations that may
have otherwise gone undetected and concentrating pollutants to detectable levels far
above those in the environment.
sampling are also reviewed, and the advantages and disadvantages for each method
are discussed.
1.1 Liquid-Liquid Extraction
Liquid-liquid extraction (LLE) has been used extensively for the isolation of
semi-volatile and non-volatile organic pollutants from w a t e r . T h e determination
of a whole range of pesticides such as triazines and phenylureas in water using
dichloromethane, trichloromethane and mixtures of benzene and ethyl acetate has
been reported. Dichloromethane tends to be the most popular solvent used due to its
ability to extract compounds with a wide range of polarities and it is easy to
evaporate. Hexane has been used in the determination of halogenated pesticides and
PCBs. Other solvents used for extraction include acetonitrile, diethyl ether, pentane,
tetrachloromethane or a mixture of solvents. To achieve maximum extraction of
a compound, 2 or 3 separate aliquots of the solvent are used to wash the aqueous
phase and then are combined at the end to give a final solvent phase. This solvent
phase usually requires a further clean up to remove any residual water; sodium
sulphate is the common choice. The solvent phase is then evaporated off using a
rotary evaporator or a needle evaporator in a stream of inert gas. The solvent is
reduced down to 1 or 2 mis and is now ready for analysis using various
chromatographic and spectroscopic techniques. Some of the favoured techniques
include Gas Chromatography (GC) or Liquid Chromatography (LC) with Electron
Capture Detection (ECD), GC coupled with Mass Spectrometry (GC-MS) and High
Pressure Liquid Chromatography (HPLC) with UV detection.*
The big advantage of using LLE is that it is simple to use and the technique
that can out weigh this. LLE requires the use of large volumes of expensive and
hazardous solvents and increasingly strict regulations on the use and disposal o f
chlorinated solvents makes it a rather unfavourable technique. The extraction process
is laborious and difficult to automate, some aqueous and organic phases form
emulsions and prolonged exposure to some solvents can be detrimental to the health
o f those using them. These frequently quoted disadvantages with LLE encouraged the
development of safer and more efficient extraction techniques.
1.2 Solid-Phase Extraction
A brief introduction to solid-phase extraction is given in this chapter but a
more in depth review is given in Chapter 2. Solid-phase extraction (SPE) was first
introduced in the 1950s in the form of charcoal beds that were used to isolate organic
compounds from water in order to assess their health effects.^®’^^’^* The next
development was the introduction of SPE cartridges in the 1970s, which typically
consist of a short column containing a solid sorbent packed between porous frits.^®’^^'
27,38 jjjg type of sorbent is usually graphitized carbon, alkyl bonded silicas, or
polystyrene-divinylbenzyl (PS-DVB) copolymers. The cartridge design has certain
disadvantages such as channelling o f the sorbent material, which reduces the capacity
of the cartridge to retain analytes, and slow sampling rates brought about by a small
surface area that can be blocked by solids in the sample.^^’^*
Solid-phase extraction disks, introduced in the 1990s, can eliminate some of
these problems.^®*^^’^^’^^’^* The disk design consists of some type o f sorbent embedded
in an inert material cut into disks with diameters from 4^96 mm and 0.5 mm
PTFE or glass fibre m a t r i x . T h e SPE disks can be used to isolate a whole
range of pollutants from water, are easy to handle, the homologous sorbent phase does
not suffer from the same amount of channelling as the cartridges and they boast many
advantages over LLE. Only a small volume of organic solvent is required to elute the
pollutants extracted onto the disk, making this a relatively inexpensive and efficient
m e t h o d . D u e to the widespread popularity and use of the SPE disks considerable
work has been carried out to explore their applications,^’*^’^®’^^’^® extraction
e f f i c i e n c i e s , ^ a n d various ways to utilise them in automated extraction
procedures.^'*'^ ^ ,3 5 ,3 7 ,3 9 ,41 ]^ynierous papers have been written on the predictive and
optimisation methods for SPE with disks and the physical and chemical properties
that affect this process.^ ' ,28,29.34,38,42,46,47 Chapter 2 for details.
Solid-phase micro extraction (SPME) was first introduced in 1989 by
Pawliszyn et al.^^ and has received a great deal of interest since then."*^"^^ SPME
provides a solvent-free approach to SPE based on equilibrium sampling. It has been
reported in the analysis of many organic compounds including chlorinated
X hydrocarbons (CHCs),^^ PBCs,^^'^'* PAHs^^ and pesticides.^*'^^ The technique of
SPME involves the use of a frised-silica fibre coated with a stationary phase and
contained in a micro-syringe. The stationary phase is usually 7-100 pm of
polydimethylsiloxane but other thicknesses and polymers have been used."^*’^^’^^ The
general procedure involves placing the fibre in the sample; the pollutants will partition
from the water onto the fibre until equilibrium is reached. After equilibrium, the fibre
with the concentrated pollutants is transferred to a gas chromatograph where the
pollutants are thermally desorbed and measured by GC or GC-MS.^^ Compared to
SPE disks and LLE, SPME is rapid, sensitive and can be automated very easily but
y
time it takes to reach equilibriiim/^'^^'^^ SPME has been shown to be dependent on a
whole range of physical and chemical parameters. The effects of salinity, humic acids,
turbulence,^^ temperature^^ and fibre characteristics such as thickness and type of
coating on SPME have all been reported.^^’^ ’^*
1.3 Biomonitoring
Biomonitoring is based on the ability o f aquatic organisms to accumulate
pollutants in their body tissue. Hydrophobic pollutants, in particular, can accumulate
to levels that far exceed those found in the surrounding water. This process is both
active (by ingesting contaminated food) and passive (by partitioning of pollutants
from water through membranes of the body and gills into the lipid tissues).^^"^^
Biomonitoring utilises this process to provide information on continuously varying
pollutant concentrations that the test organism encounters during their deployment
time. The favoured organisms are usually bivalve molluscs.^^’^* These are collected
from unpolluted waters, sorted into uniform sizes, divided into groups of equal
number, placed in nets and deployed at chosen exposure sites. After exposure the
molluscs are collected and stored at sub-rzero temperatures ready for sample
preparation. The general procedure involves separating the mussel tissue and liquor
from the shell, this is then homogenised and extracted with a non-aqueous organic
solvent ready for analysis. Typical analysis techniques are GC-MS and GC-ECD.^^^^
The use of living organisms for pollutant determination in water has proved to
be a very useful technique, providing time-averaged data on the bioavailability and
- toxicity o f PCBs, DDT, hexachlorinated benzenes (HCBs) and many other persistent
organisms bioaccumulate pollutants at varying rates due to different sex, size,
metabolism etc. as well as environmental effects such as temperature. The preparation
o f tissue samples is time-consuming and can be expensive. All these factors limit the
use and applications o f biomonitoring for the determination of pollutants in water.
1.4 Passive Sampling
Many o f the problems encountered with biomonitoring can be overcome by
the use of membrane-based passive samplers (MBPSs). These are basically semi-
permeable membrane bags filled with some type of lipid or organic solvent. The
general theory behind these MBPSs is based on the process of passive partitioning of
a compound between water and the organic solvent or lipid. MBPSs function as
physical models o f the bioconcentration process by which aquatic organisms
concentrate hydrophobic pollutants from water. But unlike aquatic organisms used in
biomonitoring, these passive samplers are non-living, and so can be applied to a much
wider range o f harsh environments. They also have an advantage over biomonitoring
since they are unaffected by biological and anatomical differences.
MBPS were first introduced by Sodergren in 1987 as dialysis membranes
filled with hexane.^® He showed how this design could concentrate lipophilic
pollutants via a passive process governed by partitioning mechanisms. He concluded
that this technique could be used to confirm bioconcentration mechanisms, to predict
environmental hazards of bioavailable pollutants, and to monitor pollutants, especially
in environments too severe for biological indicators to survive.^®’^^ Johnson and
Hassett along with many others have also shown the value of these MBPS and their
applications for time-averaged monitoring o f organic pollutants such as PCBs in
In 1990 Huckins et af^ introduced the semi-permeable membrane device
(SPMD). This consisted of low density “layflat” polyethylene tubing containing a
neutral lipid (usually triolein) to concentrate hydrophobic pollutants from water.
SPMDs in conjunction with a mathematical model, also developed by Huckins, have
been used extensively to determine the time-averaged concentrations of organic
f AH ^
^ ' pollutants such as PCBs,(PH^ and pesticides in water and compare favourably with
*71
bio monitoring using molluscs. ’ ’ ’ The SPMD used with the mathematical model
is a useful and informative technique for determining time-averaged pollutant
concentrations and the bioavailability of various pollutants. However, the membrane-
based devices can be easily damaged, this results in organic solvents being released
into the environment. Not only is this highly hazardous, but it renders the sampling
for that site worthless. The MBPS and SPMDs are also highly susceptible to
bio fouling that can cause unpredictable changes in the diffusional properties of the
1.5 References
1. M. Biziuk, A. Przyjazny, J. Czerwinski and M. Wiergowski, J. Chromatogr. A,
1996, Vol. 754, 103.
2. D. Mackay, W. Shin and K. Ma, Illustrated handbook o f physical-chemical
properties and environmental fate fo r organic chemicals - Pesticide chemicals: Vol.
5. Boca Raton: CRC Press, 1997.
3. C. D. S. Tomlin (ed). The Pesticide Manual, British Crop Protection Council,
Famham, 11* edn., 1997.
4. E. Halfon, S. Galassi, R. Briiggemann and A. Provini, Chemosphere, 1996, VoL 33,
1543.
5. W. Y. Shin and D. Mackay, J. Phys. Chem, R ef Data, 1986, Vol. 15,911.
6. G. S. Hartley and I. J. Graham-Bryce, Physical Principles o f Pesticide Behaviour,
VoL 2, Academic Press, 1980.
7. J. R. Dean, Analyst, 1996, VoL 121, 85.
8. U. Jamberg, L. Asplund, C. de Wit, A. Grafstrom, P. Haglund, B. Jansson, K. Lexén,
M. Strandell, M. Olsson and B. Jonsson, Environ Sci Technol, 1993, Vol. 27,1364.
9. J. C. Colombo, M. F. Khalü, M. Amac and A. C. Horth, Environ. Sci. Technol.,
1990, Vol. 24,498.
10. Y. Hiraizumi, M. Takahashi and H. Nishimura, Environ. Sci. & Technol., 1979, Vol.
13,580.
11. W. A. Ockenden, A. J. Sweetman, H. F. Prest, E. Steinnes and K. C. Jones, Environ.
Sci. Technol., 1998, VoL 32,2795.
12. D. Barcelo and M. -C. Hennion, Determination o f Pesticides and their Degradation
Products in Water, Elsevier, Amsterdam, 1997,249.
13. S. Chiron, A. F. Alba and D. Barcelo, Environ. Sci. Technol., 1993, Vol. 27,2352.
14. P. Parrilla and J. L. Martinez Vidal, Analytical letters^ 1997, VoL 30,1719.
15. B. Tippins, Nature, 1988, Vol. 334,273.
16. E. R. Brouwer, H. Lingeman and U. A. Th. Brinkman, Chrotographia, 1990, VoL
29,415.
17. T. McDonnell, J. Rosenfeld and A. Rais-Firouz, J. Chromatogr., 1993, VoL 629,41.
18. D. Barcelo, G. Durand, V. Bouvot and M. Nielen, Environ. Sci. Technol, 1993, Vol.
27,271.
19. S. Chiron and D. Barcelo, J. Chromatogr. 1993, Vol. 645,125.
20. G. Font, J. Mafles, J. C. Moko and Y. Pico,./ Chromatogr., 1993, VoL 642,135.
21. M. L. Mayer and C. F. Poole, Anal Chim. Acta, 1994, Vol. 294,113.
22. D. Barcelo, S. Chiron, S. Lacorte, E. Martinez, J. S. Salau and M. -C. Hennion,
Trends in Anal Chem., 1994, VoL 13,352.
23. J. S. Salau, R. Alonso, G. Batllo and D. Barcelô, Anal Chim. Acta, 1994, VoL 293,
109.
24.1. J. Barnabas, J. R. Dean, S. M. Hkchen and S. P. Owen, Anal Chim. Acta, 1994,
VoL 291,261.
25. M. -C. Hennion and V. Pichon, Environ. Sci Technol, 1994, Vol. 23, 576.
26. A. Gelencsér, G. Kiss, Z. Krivacsy, Z. Varga-Puchony and J. Hlavay, J.
Chromatogr. A, 1995, Vol. 693,217.
27. A. Gelencsér, G. Kiss, Z. Krivacsy, Z. Varga-Puchony and J. Hlavay, J.
Chromatogr. A, 1995, Vol. 693,227.
28. S. K. Poole and C. F. Vooh, Analyst, 1995, VoL 120,1733.
29. M. L. Mayer, C. F. Poole and M. P. Henry, J. Chromatogr. A, 1995, Vol. 695,267.
32 G. Michor, J. Carron, S. Bruce and D. A. Cancilla, J. Chromatogr. A, 1996, Vol.
732,85.
33. E. Viana, M. J. Redondo, G. Font and J. C. Moltô, J. Chromatogr. A, 1996, Vol. 733,
267.
34. M. Nakamura, M. Nakamura and S. Yamada, Analyst, 1996, VoL 121,469.
35. J. Sfobodmk, Ô. Ôztezkizan, H. Lingeman and U. A. Th. Brinkman, J. Chromatogr.
A, 1996, Vol. 750,227.
36. A. Martin-Exteban, P. Fernandez and C. Camara, J. Chromatogr. A, 1996, Vol 752,
291.
37. H. Lingeman, S. J. F. Hoekstra-Oussoren, J. Chromatogr. B, 1997, VoL 689,221.
38. C. F. Poole, S. K. Poole, D. S. Seibert and C. M. Chapman, J. Chromatogr. B, 1997,
Vol. 689,245.
39. T. Renner, D. Baumgarten and K. K. Unger, Chromatographia, 1997, Vol. 45,199.
40. J. Dachs and J. M. Bayona, Chemosphere, 1997, Vol. 35,1669.
41. J. Slobodnik, A. J. H. Louter, J. J. Vreuls, I. Liska and U. A. Th. Brinkman, J.
Chromatogr. A, 1997, Vol. 768,239.
42 M-C. Hennion, C. Cau-Dit-Coumes and V. Pichon, J. Chromatogr. A, 1998, Vol.
823,147.
43. T. S. Thompson and B. D. Miller, Chemosphere, 1998, VoL 36,2867.
44. T. A Albanis, D. G. Hela, T. M. Sakellarides and I. K. Konstantinou, J.
Chromatogr. A, 1998, Vol. 823, 59.
45. R. Dommarco, A. Santilio, L. Fomarelh and M Rubbiani, J. Chromatogr. A, 1998,
VoL 825,200.
46. W. M. G. M. van Loon, F. G. Wijinker, M. E. Verwoerd and J. L. M. Hermens,
Anal. Chem., 1996, Vol. 68,2916.
47. H. J. M. Verhaar, F. J. M. Busser and J. L. M. Hermens, Environ, Sci. Technol.,
1995, VoL 29, 726.
48. R- G. Belardi and J. Pawliszyn, Water Pollut. Res. J. Can., 1989, Vol. 24,179.
49. D. Louch, S. Motlagh and J. Pawliszyn, Anal Chem., 1992, VoL 64,1187.
50. M. Chai, C. L. Arthur, J. Pawliszyn, R. P. Belardi and K . F. Pratt, Analyst, 1993,
VoL 118,1501.
51. T. Nilsson, F. Pelusio, L. Montanarella, B. Larsen, S. Facchetti and J. O. Madsen, J.
High Resol Chromatogr., 1995, Vol. 18,617.
52. L. Urruty and M. Montury, J. Agric. Food Chem., 1996, Vol. 44,3871.
53. J. Dewulf, H. V. Langenhove and M. Everaert, J. Chromatogr. A, 1997, VoL 761,
205.
54. A. Saraullo, P. A. Martos and J. Pawliszyn, Anal Chem., 1997, Vol. 69,1992.
55. S. K. Poole and C. F. Poole, Communications, 1996, Vol. 33,15.
56. W. M. Coleman, J. Chromatogr. Sci., 1997, Vol. 35,245.
57. B. Schafer, P. Hennig and W. Engewald, J. High Resol Chromatogr. 1997, VoL 20,
217.
58. J. Dugay, C. Miège and M. -C. Hennion, J. Chromatogr. A, 1998, VoL 795, 27.
59. J. Bekran, F. J. Lopez, O. Cepria and F. Hernandez, J. Chromatogr. A, 1998, Vol.
808,257.
60. A. Paschke, P. Popp and G. Schüiirmann, Fresenius J Anal Chem., 1999, Vol. 363,
426.
61. J. Pôrschmann, F. -D. Kopinke and J. Pawliszyn, J. Chromatogr. A, 1998, Vol. 816,
159.
64. Y. Yang, S. B, Hawthorne, D. J. Miller, Y. Liu and L. Lee, Anal Chem., 1998, Vol.
70,1866.
65. W. H. J. Vaes, C. Hamwijk, E. U. Ramos, H. J. M. Verhaar and J. L. M. Hermens,
Anal Chem., 1996, Vol. 68,4458.
66. C. G. IngersoU, G. T. Ankley, D. A. Benoit, E. L. Brunson, G. A. Burton, F. J.
Dwyer, R. A. Hoke, P. F. Landrum, T. J. Norberg-King and P. V. Winger, Environ.
Toxicol Chem., 1995, VoL 14,1885.
67. C. S. Hofek andD. Shea, Environ. Sci Technol, 1997, Vol. 31,154.
68. S. Herve, R. Paukku, J. Paasivirta, P. Heinonen and A. Sodergren, Chemosphere,
1991, VoL 22,1997.
69. W. M. G. M. van Loon, M. E. Verwoerd, F. G. Wijnker, C. J. van Leeuwen, P. van
Duyn, C. van de Guchte and J. L. M. Hermens, Environ. Toxicol Chem., 1997, Vol.
16,1358.
70. A. Sodergren, Environ. Sci Technol, 1987, Vol. 21, 855.
71. J. N. Huckins, M. W. Tubergen and G. K. Manuweera, Chemosphere, 1990, Vol. 20,
533.
72. G. D. Johnson, Environ. Sci Technol, 1991, Vol. 25,1897.
73. J. A. Lebo, J. L. Zajicek, J. N. Huckins, J. D. Petty and P. H. Peterman,
Chemosphere, 1992, Vol. 25,697.
74. S. Litten, B. Mead and J. Hassett, Environ. Toxicol Chem., 1993, VoL 12, 639.
75. J. N. Huckins, G. K. Manuweera, J. D. Petty, D. Mackay and J. A. Lebo, Environ.
Sci Technol, 1993, VoL 27,2489.
76. G. S. Ellis, J. N. Huckins, C. E. Rostad, C. J. Schmitt, J. D. Petty and P. MacCartby,
Environ. Toxicol Chem., 1995, Vol. 14,1875.
77. D. Sabaliunas and A. Sodergren, Environ. Poll, 1997, Vol. 96,195.
78. B. Strandberg, N. Wâgman, P. -A. Bergqvist, P. Haglund and C. Rappe, Environ,
Sci. Technol., 1997, VoL 31,2960.
Chapter 2 Review o f Solid-Phase Extraction
2.0 Solid-Phase Extraction
9
The need to monitor environmental water for pollutants has been highlighted
in Chapter 1. Direct sampling requires pollutant isolation and concentration prior to
analytical analysis; methods such as liquid-liquid extraction (LLE) and sohd-phase
extraction (SPE) have been the conventional choice. Out of the two methods, SPE has
emerged as the preferred technique.*’^ SPE overcomes many o f the pitfalls of LLE
which has encouraged a lot of work to be carried out to develop this into a rapid,
efficient, low cost and sensitive method for monitoring pollutants in water. The
initial introduction of solid-phase extraction came in the form of cartridges filled with
a solid sorbent. SPE disks were the next step, consisting of a sorbent embedded in
PTFE or glass fibres. The most recent development in SPE comes in the form of
polymer coated fibres contained in a micro syringe, hence the name sohd-phase micro
extraction (SPME).^’^’"^'^
Given in this chapter is a review of the types of SPE that have been introduced
and developed over the years. The design, apphcations, advantages and disadvantages
for each type o f SPE format are discussed.
2.1 The Basic Principles
The general principles behind sohd-phase extraction are essentially the same
for ah methods. SPE is a chromatographic process used to separate various types o f
analyte from a mobile phase utihsing interactions of the analyte with a stationary
phase. When applying SPE to the detection of pohutants from water, water is the
mobile phase when loading the pollutant onto the stationary phase and some organic
solvent when eluting them. The stationary phase is chosen from a wide range of
sorbents depending on the pollutant being isolated. When a water sample is passed
through the sorbent, analytes will be retained on it. The strength of the retention
depends on the specific physico-chemical interactions between the analyte and
sorbent. The concentrated analyte is then eluted from the sorbent using an organic
solvent. High concentration factors are obtained when analytes are strongly retained
by the sorbent in the presence of water and when there is low retention when eluting
with the organic solvent.
The most common sorbents used when isolating organic pollutants from water
can be separated into four groups; alkyl bonded silicas; polymers; graphitized carbon;
and chelated and ion exchange materials.
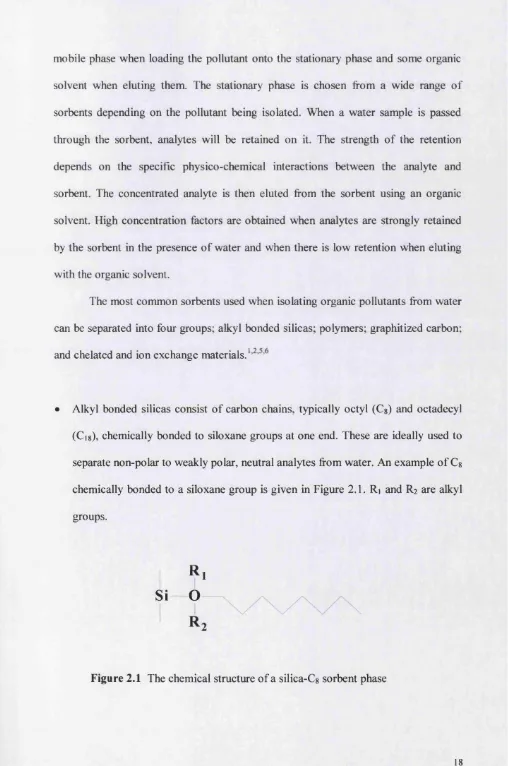
• Alkyl bonded silicas consist of carbon chains, typically octyl (Cg) and octadecyl
(Cig), chemically bonded to siloxane groups at one end. These are ideally used to
separate non-polar to weakly polar, neutral analytes from water. An example of Cg
chemically bonded to a siloxane group is given in Figure 2.1. Ri and R2 are alkyl
groups.
R i
Si
O
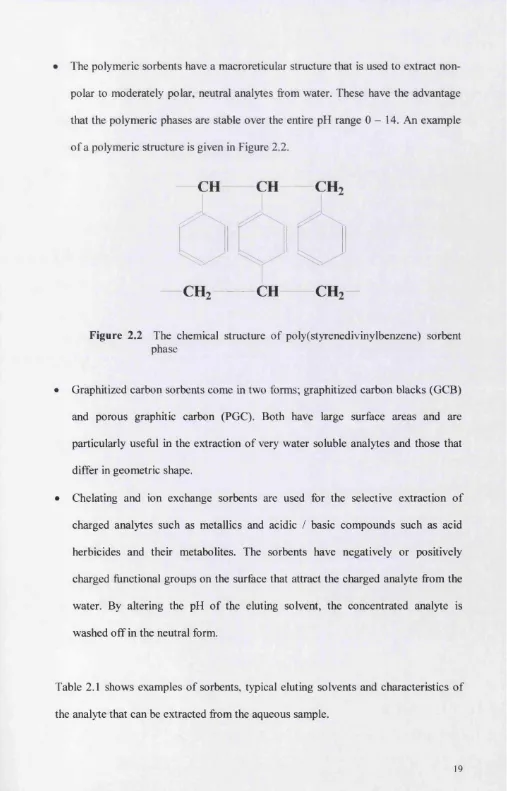
The polymeric sorbents have a macroreticular structure that is used to extract non
polar to moderately polar, neutral analytes from water. These have the advantage
that the polymeric phases are stable over the entire pH range 0 - 14. An example
of a polymeric structure is given in Figure 2.2.
CH
CH
CH
CH
CH
CH
Figure 2.2 The chemical structure of poly(styrenedivinylbenzene) sorbent phase
• Graphitized carbon sorbents come in two forms; graphitized carbon blacks (GCB)
and porous graphitic carbon (PGC). Both have large surface areas and are
particularly useful in the extraction of very water soluble analytes and those that
differ in geometric shape.
• Chelating and ion exchange sorbents are used for the selective extraction of
charged analytes such as metallics and acidic / basic compounds such as acid
herbicides and their metabolites. The sorbents have negatively or positively
charged functional groups on the surface that attract the charged analyte from the
water. By altering the pH of the eluting solvent, the concentrated analyte is
washed off in the neutral form.
Table 2.1 shows examples of sorbents, typical eluting solvents and characteristics of
the analyte that can be extracted from the aqueous sample.
Table 2.1 Examples of sorbents, typical eluting solvents and characteristics of the
analyte that can be extracted from the aqueous sample.
Sorbent Elution solvent Extractable analytes
Alkyl bonded silicas:
e.g. Octyl (Cg)
Octadecyl (Cig)
Ethyl (C2)
Methanol
Acetonitrile
Non-polar - weakly
polar neutral Polymers: e.g. Poly(styrenedivinylbenzene) Carbowax-divinylbenzene Methanol Acetonitrile
Non-polar - moderately
polar
neutral
Graphitized carbon:
e.g. Graphitized carbon blacks
(GCB)
Porous graphic carbon (PGC)
Methanol
Acetonitrile
THF
Non-polar - polar
neutral
Ion exchangers:
e.g. Carboxyl Acid
Quaternary Amine
Water - pH adjusted
to elute analyte in
neutral form
Cationic
Anionic
It is now possible to discuss how the sorbent is implemented into the three main
formats for SPE, the applications of these various forms and the limitations of their
2.2 Solid-Phase Extraction Cartridges
2.2.1 Design
A typical SPE cartridge consists of a short plastic or glass column (generally
an open syringe barrel) containing a sorbent, with an average particle size of 40-60
pm and pore size of 30 nm, packed between porous metal or plastic frits, see Figure
2.3. The quantity of sorbent in the column varies from 50 mg to 10 g depending on
the sample volume and the desired concentration of a n a l y t e . T h e cartridges are
favoured over LLE as they offer a rapid and efficient enrichment technique; they use
far less hazardous and expensive organic solvent and have been shown to compare
favourably with the traditional LLE technique employed in monitoring pollutants in
water.1-6
syringe barrel
sorbent packing
aqueous sample
porous frit
Figure 2.3 A typical solid-phase extraction cartridge
2.2.2 Applications and advantages o f SPE cartridges
Solid-phase extraction cartridges have a firm holding in the area of water
analysis. Pesticides, PCBs, DDT, PAHs, explosives, phenols and many other semi-
volatile analytes have all been extracted from environmental water samples using SPE
cartridges. ^ Once concentrated on the cartridge, the analyte must be eluted and the
eluant analysed to qualitatively and quantitatively identify the analytes o f interest. The
favoured analytical techniques for this include HPLC coupled with UV or diode array
detection (DAD),^’^ GC or LC with Flame Ionisation (FI), Electron Capture (EC), UV
or MS detection^'*® A large number of papers have been published on the automation
of pollutant determination using SPE cartridges coupled with HLPC, GC-MS, LC-
DAD and many other analytical instruments. This highlights another advantage of
cartridges over LLE as the automated procedures can provide greater reproducibility
at a much faster rate. A very recent development in solid-phase extraction has been to
apply the technology to the micro-column 96-well plate format commonly used in the
pharmaceutical industry. 96-well plates are used for high throughput screening and
the SPE cartridge variety of these plates are showing huge promise in this area.^"^
Vidal^ has shown that cartridges offer greater reproducibility than LLE in a
comparison between LLE and SPE cartridges in the determination o f pesticides in
water. But in the same con^arison, LLE was found to be more efficient than SPE
when detecting certain pesticides.^ Considerable work has been carried out to
investigate the various physical and experimental parameters that effect the efficiency
of SPE. Poole et al. have studied the effects of experimental procedural steps on the
recovery of analytes from SPE cartridges. They concluded that the recovery shows
provide 90 % or greater recovery. Poole has also investigated and characterised
kinetic and retention properties of disks and cartridges using a solvation model
approach^^ (details of this are given in Chapters 4 and 7). A method for the
determination o f cartridge capacity factors has been suggested using a set of phenolic
compounds. The values obtained can be used to predict recoveries when the sample
volume varies.** The more information available on the parameters that afifect SPE,
the greater the opportunity to choose the optimum experimental conditions which in
turn, leads to even more efficient, rapid, low cost and reliable water analysis.
2.2.3 Disadvantages o f SPE cartridges
The size o f the cartridges is deliberately small to minimise the quantity of
solvent used when eluting the analyte from the sorbent bed. This design feature
introduces certain disadvantages that can be summarised as follows:^’***’*^’*^
1. the small cross-sectional area of the cartridges results in slow sample
processing rates and a tendency to become blocked by particles and
absorbed components in the water.
2. channelling reduces the capacity o f the sorbent bed to retain analytes.
3. sorbent properties and packing can vary from batch to batch and between
manufacturers.
4. incomplete reversibility of the sorption o f some analytes from the sorbent
can reduce the recovery o f analyte.
5. contamination of the extracted analytes is possible from impurities
introduced at the manufacture and packing stage.
2.3 Solid-Phase Extraction Disks
2.3.1 Design
Particle-loaded membranes (PLMs) and particle-embedded glass fibre disks
(PEGFD), referred to generically as disk technology, are examples of alternative
formats to the cartridge design for solid-phase e x t r a c t i o n . P L M s consist of a
web of PTFE microfibrils in which are suspended sorbent particles of approximately 8
pm in diameter, the pore size being approximately 6 nm.‘^’^^ PLMs are available in
diameters from 4 - 9 6 mm, are 0.5 mm think and contain approximately 90 % w/w of
s o r b e n t . T h e PLMs are flexible and require structural support, usually sintered
glass, in a standard filtration apparatus using suction to generate the desired flow
through the membrane. The PEGFDs contain sorbent embedded in a glass fibre
matrix. The small glass disks are rigid and self-supporting; the larger ones require
structural s u p p o r t . T h e SPE disks offer similar advantages to cartridges over LLE
for pollutant detection in water.^* Comparing the disk format to the cartridge format
shows an increased surface area, smaller particle size and more uniform packing. SPE
disks present an opportunity for faster sampling rates and enhanced advantages over
LLE compared to cartridges.*'*^’*^’’^’*^’^® SPE disks, like the cartridges, have been
adapted to the micro-column 96-well plate format and have contributed to an increase
in the rate of extraction and analysis of pharmaceutical compounds.
47 mm
2.3.2 Applications and advantages o f SPE disks
Since the introduction of solid-phase extraction disks in the 1990s, they have
widely been accepted as a more efficient, rapid and low cost alternative to LLE in the
analysis of pollutants in w a t e r . T h e y have also been shown to be an improvement
on SPE cartridges; the conventional solid-phase extraction format since the 1970s.^^
The improved performance from the disks is largely due to their increased surface
area and thin depth that reduces pressure drop and increases the rate of sampling. The
use of small 8 pm particles, uniformly supported in a mechanically stable mesh of
PTFE fibres, results in no bed channelling, increased sample capacity, greater
reproducibility in results and ease of handling.*'*®’^^’*^’*^’^®
SPE disks have mainly been applied to investigations into pollutant
determination in water. Pesticides,^^'^^ acidic and neutral herbicides,^**^^ fungicides,^®
PAHs^^ and many other organic pollutants have been isolated and identified using
SPE disks and a multitude of chromatographic and spectrometry techniques.^^'^"^ The
favoured eluant analysis techniques are the same as those used in conjunction with the
cartridges. Some examples are LC with UV or MS detection, LC-DAD and GC-
Ms 21-23.25,30,34 tcchniqucs have been used in automated procedures with the
SPE disks to further improve the efficiency, speed and reproducibility. The disks can
concentrate pollutants to such an extent that pollutant at levels as low as 0.01 pg.f’
can be detected, well within the levels set out by the EEC directive.^*’^^
Another area of interest regarding SPE disks is the characterisation and
optimisation of them^^’^®’^^’^^ Poole et al. have shown how various experimental
procedures can affect the recovery of pollutants from water. ^^*^® One obvious
conclusion made from this study is the need to condition the disks prior to sample
processing. By solvating the sorbent with an organic solvent (usually methanol) the
interactions between the analyte and sorbent are enhanced, any residual impurities are
removed and uniform flow through the membrane is achieved. Conditioning results in
higher recoveries of analyte. Solvation models to characterise the SPE process when
using disks have been developed along with tools for the prediction and optimisation
of SPE parameters; providing a means to select the best sorbent for a specific
extraction application.
An alternative use for SPE disks containing octadecyl (Cig) sorbent is to relate
the bioaccumulation of pollutants with the partition process of a pollutant between
water and the Cig disk. Bioaccumulation is the process of concentrating pollutants
from water into the lipid phase of aquatic organisms. Hermens et a l shows how the
water-Cig disk partition coefficient can be used to estimate bioaccumulation in aquatic
organisms^* and the baseline toxicity content of environmental waters.^^
2.3.3 Disadvantages o f SPE disks
Although the SPE disk format somewhat improves on the cartridge format
there are still pit falls with this technique that can be summarised as follows:
1) particles and components in the water can build up on the surface causing
blockages and reduced sampling rate.
2) sorbent properties can vary from batch to batch and between
manufacturers.
3) contamination of the extracted analyte is possible from impurities
2.4 Solid-Phase Micro Extraction
2.4.1 Design
Solid-phase micro extraction (SPME) was first introduced in 1989 by
Pawliszyn et as a method for sampling liquid or gaseous samples. Rather than
being a massive improvement on SPE cartridges and disk, SPME is more of an
alternative method for pollutant detection.^ SPME devices generally consist of a
fused-silica fibre coated in a sorbent and contained in a micro-syringe, which makes
the fibre easy to handle and the device portable.^’"^^ Approximately 1cm length of the
fibre is coated with sorbent, typically polydimethylsiloxane but other sorbents such as
polyacrylate and Carbowax-divinylbenzene have been used, see Figure 2.5."*^ The
coating thickness ranges from 7 - 1 0 0 pm. The general extraction procedure for
pollutants from water involves placing the fibre in the sample, the pollutants then
partition into the coated fibre.
sorbent coating micro-syringe barrel
T
i
syringe needle
Figure 2.5 Atypical solid-phase micro extraction needle
After equilibrium has been reached, the fibre with the concentrated pollutants on is
transferred to the injector of a gas chromatograph and the pollutants are thermally
desorbed and analysed by various analytical techniques. As usual, calibration is
necessary to relate the detector response to sample concentration.
2.4.2 Applications and advantages o f SPME
Since the first introduction of SPME in 1989,"^° it has been shown to have great
potential for water analysis and has since received a lot of interest and development.'^^'
^ The main attractions to SPME are the rapid and efficient extraction of pollutants
fi-om water; the fact that this technique does not require the use of any hazardous and
expensive solvents; tiny sample volumes can be analysed at very low levels o f
pollutant concentration; and the coated fibres are highly r e u s a b l e . ^ Du r i n g the last
few years, the SPME devices have been applied to the determination of a variety of
compounds in several types of aqueous samples. These compounds include CHCs,^^
pesticides,'*^ '*^ PAHs,'^^ phenols and PCBs.'^^"'^^ SPME has been developed into a fully
automated technique with the pre-concentrated pollutants being thermally desorbed
inside a heated gas chromatographic injection port and directly analysed by GC.
Desorbed pollutants have also been detected by nitrogen-phosphorus detection
(NPD)'^^’'^^ GC-ECD'*^ ^^ and GC-MS,^®’^^ with limits of detection going down as low
as 5 ng.r^ and responses being linear over several orders of magnitude.
With the growing interest in SPME, numerous papers have been published
reporting on investigations into the dependence of SPME on various physical and
chemical parameters.^^ SPME is based on equilibrium sampling o f pollutants, hence,
the equilibrium constants for a whole range of pollutants partitioning between water
and the fibre coating, given as Kw f, have been determined. Nilsson and co-workers'^'^
5*^1 û
^
jkç/l
experimental temperature shorted the time to reach equilibrium but also to lower
Kwf values and consequently a lower sensitivity of the method. Urruty and Montury^‘
reported that the equilibrium constants for some pesticides were influenced by the
presence of ethanol in the sample solution. The extracted amount of pesticide was
shown to be dependent on the nature of the molecule and the ethanolic content of the
solution. In contrast, the time necessary to reach equilibrium was the same in the
presence and absence of ethanol.
Other studies carried out with SPME include kinetic and partitioning
behaviour of CHCs and monocyclic aromatic hydrocarbons;"*^'^^ water analysis based
on the physical and chemical properties of the fibre coat i ngsol ubi l i t y and
partitioning of FAHs;"^^ determination of the binding state of pollutants in water rich
in humic organic matter;^'^ and the quantification of PCBs in various aqueous
samples.'*^'^^ One particularly interesting paper is that published by Vaes et al.^^ They
determined the kinetic rate constants and equilibrium partition constant for a set of
organic pollutants. These constants were used to develop mathematical models and
Quantitative-Structure Property Relationships (QSPRs) in order to predict the kinetics
and equilibrium times by computations alone. The models and QSPRs also provide
some insight into the significant processes involved in the partitioning process.
2.4.3 Disadvantages o f SPME
SPME is now considered to be a promising technique in the analysis of
pollutants in water and is continuously being developed and characterised since its
somewhat recent introduction. However, limitations do apply to SPME that can be
summarised as follows:^
1) the extraction of low concentration pollutants can suffer from
contamination from matrix components.
2) the technique relies on reaching equilibrium, which can sometimes be a
relatively long time which in turn reduces the speed of sampling.
3) the need to calibrate the method in order to relate the detector response to
2.5 References
1. M. Biziuk, A. Przyjazny, J. Czerwinski and M. Wiergowski, J, Chromatogr. A,
1996, VoL 754, 103.
2. S. K. Poole and C. F. Poole, Anal. Communications, 1996, Vol. 33,15.
3. P. Parrilla and J. L. Martinez Vidal, Analytical letters, 1997, VoL 30,1719.
4. G. Font, J. Manes, J. C. Moko and Y. Pico, J. Chromatogr., 1993, VoL 642,135.
5. B. Tippins, Nature, 1988, VoL 334,273.
6. M. -C. Hennion and V. Pichon, Environ. Sci. Technol., 1994, Vol. 23, 576.
7. R. Dommarco, A. Santilio, L. Fomarelh and M. Rubbiani, J. Chromatogr. A, 1998,
VoL 825,200.
8. E. Viana, M, J. Redondo, G. Font and J. C. Mokô, J. Chromatogr. A, 1996, Vol. 733,
267.
9. J. Slobodnik, Ô. Ôztezkizan, H. Lingeman and U. A. Th. Brinkman, J. Chromatogr.
A, 1996, VoL 750,227.
10. J. Dachs and J. M. Bayona, Chemosphere, 1997, VoL 35,1669.
11. T. Renner, D. Baumgarten and K. K. Unger, Chromatographia, 1997, VoL 45,199.
12. J. Slobodnik, A. J. H. Louter, J. J. Vreuls, I. Liska and U. A. Th. Brinkman, J.
Chromatogr. A, 1997, Vol. 768,239.
13. D. A. WeUs, LC-GC, 1999, Vol. 12, 704.
14. R. S. Plumb, R. D. M. Gray and C. M. Jones, J. Chromatogr. B, 1997, VoL 694,
123.
15. M. L. Mayer and C. F. Poole, Anal. Chim. Acta, 1994, VoL 294,113.
16. C. F. Poole, S. K. Poole, D. S. Seibert and C. M Chapman, J. Chromatogr. B, 1997,
VoL 689,245.
17. A. Gelencsér, G. Kiss, Z. Krivacsy, Z. Varga-Puchony and J. Hlavay, J.
Chromatogr. 1995, Vol. 693,227.
18. A. Gelencsér, G. Kiss, Z. Krivacsy, Z. Varga-Puchony and J. Hlavay, J.
Chromatogr. A,1995, Vol. 693,217.
19. H. Lingeman, S. J. F. Hoekstra-Oussoren, J. Chromatogr. B,1997, Vol. 689,221.
20. M. L. Mayer, C. F. Poole and M. P. Henry, J. Chromatogr. A,1995, Vol. 695, 267.
21. S. Chiron, A. F. Alba and D. Barcelo, Environ. Sci. Technol., 1993, Vol. 27,2352.
22. D. Barcelo, G. Durand, V. Bouvot and M. Nielen, Environ. Sci. Technol., 1993, Vol.
27,271.
23. S. Chiron and D. Barcelo, J. Chromatogr. 1993, Vol. 645,125.
24. D. Barcelo, S. Chiron, S. Lacorte, E. Martinez, J. S. Salau and M. -C. Hennion,
Trends in Anal. Chem.,1994, VoL 13,352.
25. A. Martin-Exteban, P. Femândez and C. Câmara, J. Chromatogr. A, 1996, VoL 752,
291.
2 6 .1. J. Bamabas, J. R. Dean, S. M. Hitchen and S. P. Owen, Anal. Chim. Acta, 1994,
VoL 291,261.
27. T. A. Albanis, D. G. Hela, T. M. Sakellarides and I. K. Konstantinou, J.
Chromatogr. A,1998, Vol. 823,59.
28. T. S. Thompson and B. D. Miller, Chemosphere, 1998, VoL 36,2867.
29. T. S. Thompson and L. Morphy, J. Chromatographic Sci., 1995, VoL 33, 393.
30. J. S. Salau, R. Alonso, G. Batllo and D. Barcelo, Anal. Chim. Acta, 1994, VoL 293,
109.
31. G. Michor, J. Carron, S. Bruce and D. A. Cancilla, J. Chromatogr. A, 1996, Vol.
32. E. R. Brouwer, H. Lingeman and U. A. Th. Brinkman, Chrotographia, 1990, Vol.
29,415.
33. T. McDonnell, J. Rosenfeld and A. Rais-Firouz, J. Chromatogr., 1993, Vol. 629,41.
34. C. Aguilar, F. Borrull and R M. Marcé, J. Chromatogr. A, 1996, Vol. 754,77.
35. D. Barcelo and M. -C. Hennion, Determination o f Pesticides and their Degradation
Products in Water, Elsevier, Amsterdam, 1997,249.
36. S. K. Poole and C. F. Pooh, Analyst, 1995, Vol. 120,1733.
37. M. -C. Hennion, C. Cau-Dit-Coumes and V. Pichon, J. Chromatogr. A, 1998, Vol.
823,147.
38. W. M. G. M. van Loon, F. G. Wijinker, M. E. Verwoerd and J. L. M. Hermens,
Anal. Chem., 1996, Vol. 68,2916.
39. H. J. M. Verhaar, F. J. M. Busser and J. L. M. Hermens, Environ, Sci. Technol.,
1995, VoL 29, 726.
40. R. G. Belardi and J. Pawliszyn, Water Pollut. Res. J. Can., 1989, Vol. 24,179.
41. D. Louch, S. Motlagh and J. Pawliszyn, Anal. Chem., 1992, VoL 64,1187.
42. M. Chai, C. L. Arthur, J. Pawliszyn, R. P. Belardi and K. F. Pratt, Analyst, 1993,
VoL 118,1501.
43. J. Dugay, C. Miège and M. -C. Hennion, J. Chromatogr. A, 1998, VoL 795, 27.
44. T. Nilsson, F. Pelusio, L. Montanarella, B. Larsen, S. Facchetti and J. O. Madsen, J.
High Resol. Chromatogr., 1995, Vol. 18, 617.
45. J. Beltran, F. J. Lopez, O. Cepria and F. Hernandez, J. Chromatogr. A, 1998, VoL
808,257.
46. A. Paschke, P. Popp and G. Schüürmann, Fresenius J Anal Chem., 1999, Vol. 363,
426.
47. M. Llompart, K. Li and M. Fingas, Anal Chem., 1998, Vol. 70,2510.
48. Y. Yang, D. J. Miller and S. B. Hawthorne, J. Chromatogr. A, 1998, VoL 800,257.
49. Y. Yang, S. B. Hawthorne, D. J. Miller, Y. Lin and L. Lee, Anal Chem., 1998, VoL
70,1866.
50. W. M. Coleman, J. Chromatogr. S el, 1997, Vol. 35,245.
51. L. Urmty and M. Montury, J. Agric. Food Chem., 1996, Vol. 44,3871.
52. A. SarauUo, P. A. Martos and J. Pawliszyn, Chem., 1997, Vol. 69,1992.
53. J. Dewulf, H. V. Langenhove and M Everaert, J. Chromatogr. A, 1997, VoL 761,
205.
54. J. Pôrschmann, F. -D. Kopinke and J. Pawliszyn, J. Chromatogr. A, 1998, Vol. 816,
159.
55. W. H. J. Vaes, C. Hamwijk, E. U. Ramos, H. J. M. Verhaar and J. L. M. Hermens,