Gender Differences in Earnings of
Early- and Midcareer Pediatricians
Mary Pat Frintner, MSPH,aBlake Sisk, PhD,aBobbi J. Byrne, MD,bGary L. Freed, MD, MPH,cAmy J. Starmer, MD, MPH,d Lynn M. Olson, PhDaabstract
BACKGROUND:The US physician workforce includes an increasing number of women, with
pediatrics having the highest percentage. In recent research on physicians, it is indicated that men earn more than women. It is unclear how thisfinding extends to pediatricians.
METHODS:We examined cross-sectional 2016 data on earnings from the American Academy of
Pediatrics Pediatrician Life and Career Experience Study, a longitudinal study of early- and midcareer pediatricians. To estimate adjusted differences in pediatrician earnings between men and women, we conducted 4 ordinary least squares regression models. Model 1 examined gender, unadjusted; model 2 controlled for labor force characteristics; model 3 controlled for both labor force and physician-specific job characteristics; and model 4 controlled for labor force, physician-specific job, and work-family characteristics.
RESULTS:Sixty-seven percent of Pediatrician Life and Career Experience Study participants
completed the 2016 surveys (1213 out of 1801). The analytic sample was restricted to participants who completed training and worked in general pediatrics, hospitalist care, or subspecialty care (n= 998). Overall pediatrician-reported mean annual income was $189 804. Before any adjustment, women earned∼76% of what men earned, or∼$51 000 less. Adjusting for common labor force characteristics such as demographics, work hours, and specialty, women earned∼87% of what men earned, or∼$26 000 less. Adjusting for a comprehensive set of labor force, physician-specific job, and work-family characteristics, women earned
∼94% of what men earned, or∼$8000 less.
CONCLUSIONS:Early- to midcareer female pediatricians earned less than male pediatricians. This difference persisted after adjustment for important labor force, physician-specific job, and work-family characteristics. In future work, researchers should use longitudinal analyses and further explore family obligations and choices.
WHAT’S KNOWN ON THIS SUBJECT:In research among physicians, it is indicated that women earn less than men, even when adjusting for personal and professional characteristics. General pediatricians are often grouped with pediatric subspecialists, and there has not been a recent national study in which researchers have focused solely on pediatrician earnings.
WHAT THIS STUDY ADDS:Female pediatricians report earning less than male pediatricians. Before any adjustment, women earn 76% of what men earn, or∼$51 000 less. Adjusting for a comprehensive set of characteristics, women report earning∼94% of men’s earnings, or∼$8000 less.
To cite: Frintner MP, Sisk B, Byrne BJ, et al. Gender Differences in Earnings of Early- and Midcareer Pediatricians.Pediatrics. 2019;144(4):e20183955
aDepartment of Research, American Academy of Pediatrics, Itasca, Illinois;bSection of Neonatal-Perinatal
Medicine, Department of Pediatrics, School of Medicine, Indiana University, Indianapolis, Indiana;cDepartment of
Pediatrics, University of Michigan, Ann Arbor, Michigan; anddDepartment of Medicine, Boston Children’s Hospital,
Boston, Massachusetts
Ms Frintner conceptualized and designed the study, conducted the analyses, coordinated and supervised data collection, drafted the initial manuscript, and reviewed and revised the manuscript; Dr Sisk assisted with the conception and design of the study, reviewed and helped interpret the analyses, and reviewed and revised the manuscript; Drs Olson, Byrne, Freed, and Starmer assisted with the conception and design of the study and critically reviewed the manuscript; and all authors approved thefinal manuscript as submitted.
The research presented in this article is that of the authors and does not reflect the official policy of the AAP.
DOI:https://doi.org/10.1542/peds.2018-3955
The United States physician workforce includes an increasing number of women,1who bring substantial value to health care.2 From 2008 to 2018, women accounted for approximately half of medical school graduates.3In 2017, at least half of physicians in several specialties were women, including child and adolescent psychiatry, geriatric medicine, internal medicine-pediatrics, obstetrics and gynecology, and pediatrics.4Pediatrics includes the highest percentage of women, with 6 in 10 practicing
pediatricians4,5and 7 in 10
graduating pediatric residents6,7who are women. Despite the growth of women in pediatrics and similarities in how men and women practice pediatrics,8it is unclear whether they are paid equally.
In many US studies, researchers have examined income by gender. Specific to physician earnings, some
researchers have used data from national surveys (eg, American Community Survey) and report gaps of $80 000 or more, with no adjustments for physician characteristics.9,10Gender gaps narrow when adjusting for physician characteristics, such as age and work hours. However, studies based on national surveys are limited because they measure few characteristics important to understanding physician jobs, such as the type of specialty or practice.11
Other surveys conducted specifically among physicians also report gender gaps. For example, in a study conducted across specialties (eg, primary care, including pediatrics; obstetrics and gynecology; medical; and surgical) in 30 practices and 6 states, male physicians reported earning $90 000 more than female physicians in 2013.12After adjustment for physician and job characteristics, the gap narrowed substantially, but male earnings remained $27 000 higher. In studies specifically conducted among
pediatricians in the 1990s and early 2000s, it was found that female gender was associated with lower annual earnings among pediatricians in office-based practices13and among primary care physicians, including pediatricians across 3 time periods.14
Limitations in existing studies on physician earnings include single institution settings,15 academic-specific focus,15–19data collected over a decade ago,13,14and no or limited adjustments to reported earnings.9,20 It is suggested in the research that in addition to gender, studies of physician earnings should account for specialty, work hours, years spent on the job, time out of work, other practice-specific characteristics, and geographic location.9Work-life balance issues and choices made in careers have been less studied, particularly among physicians.
A 2017 position article of the American College of Physicians states that more research on physician compensation to examine gender disparities is needed in all practice settings.2Limited data sources exist that allow researchers to
comprehensively examine the full continuum of labor force
characteristics, physician-specific job characteristics, and life factors that might modify physician wages.
In the broader literature on earnings, it is shown that female-dominated professions tend to have lower earnings than male-dominated ones.21Consistent with this, in studies on income by specialty, it is suggested that pediatricians are among the lowest paid.17,22However, primary care pediatricians are often grouped with pediatric subspecialists, and to our knowledge, there has not been a recent national study focused solely on pediatrician earnings that includes pediatricians practicing primary, hospital, and subspecialty care. Pediatrics provides a unique opportunity to take a more in-depth look at the gender earnings gap
within an individual specialty because it has the highest proportion of female physicians4,23and most female early- to midcareer pediatricians are mothers who are juggling work and home
responsibilities.24
The American Academy of Pediatrics (AAP) Pediatrician Life and Career Experience Study (PLACES)25 provides a rich source of data that includes domains other studies on physician earnings have not included. PLACES is an ongoing longitudinal study in which researchers survey pediatricians across their careers on core issues, such as work-life balance, work environment, career
satisfaction, daily stressors, life changes, andfinancial
characteristics.26
In the current study, we examine cross-sectional PLACES data from early- to midcareer pediatricians on earnings by gender and explore the extent to which measured labor force (ie, key variables in the US Census Current Population Survey that are used to examine income), physician-specific job, and work-family characteristics account for observed gender differences.
METHODS
Data Source and Respondents
We analyzed cross-sectional survey data collected in 2016 from
PLACES.26Participants are surveyed twice each year: a longer survey covering several domains (eg, work characteristics, satisfaction, work-life balance, life experiences) and a shorter survey with more in-depth questions about a single topic, such as earnings, which was selected by participants for the 2016 survey.
Pediatricians were recruited in 2012 to participate in PLACES. Participants were randomly selected from an AAP database that includes all
members and nonmembers. In recruitment, 2 cohorts were targeted: those who completed residency in 2009–2011 and those who completed residency in 2002–2004. Four in 10 pediatricians (1925 out of 4677) invited to participate in PLACES initially signed up for the longitudinal study; of these, 1804 (93.7%) completed thefirst survey and were thereafter considered PLACES participants. Study participants are more likely to be female, AAP members, and graduates of US medical schools than target samples of pediatricians; detail has been described previously.26
The AAP Institutional Review Board approved the study.
Measures
We linked data from 2 PLACES surveys conducted in 2016 and demographic information collected during study recruitment in 2012. Questions were developed on the basis of review of other studies and input from the AAP PLACES advisory committee.
Participants answered a question on their annual income adapted from other research5,27(“What is your estimated annual income from your professional activities before taxes? For employees, please include salary, bonus, and profit sharing
contributions. For owners, please include earnings after tax-deductible business expenses but before income tax.”). Participants also answered questions about their demographic, job, and work-family characteristics, many of which were adapted from previous research.5,7,28–32We hypothesized that these
characteristics would be associated with earnings.
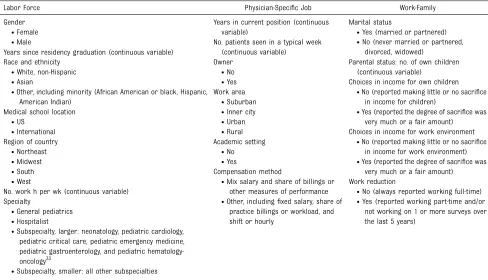
For analysis, we grouped the measured variables into 3 key groups: labor force, physician-specific job, and work-family characteristics, which are described in more detail
below and in Table 1, with further information in Supplemental Table 3.
For labor force characteristics, we included gender, years since
residency training completion (proxy for age and work experience), race and ethnicity, medical school location, region of country, hours worked per week, and primary job or specialty because these are key variables in the US Census Current Population Survey used to examine income11,34,35 and important conventional human capital characteristics.36,37For race and ethnicity, because of small numbers, we combined Hispanic, African American or black, American Indian, and other race into one group. We included region of country because earnings and cost of living might vary across regions38and hours worked because part-time hours are common among female pediatricians,39and human capital models indicate work hours are a major source of gender earning gaps.40Specialty (eg, general pediatrics, hospitalist, smaller subspecialty, and larger subspecialty, which is described in detail in Supplemental Table 3) was included as a labor force characteristic because it further defines how occupation and earnings among different pediatric subspecialties might vary.41We categorized subspecialty as larger (neonatology, cardiology, critical care, emergency medicine,
gastroenterology, and hematology-oncology) and smaller (all other subspecialties) on the basis of fellowship size reported by the American Board of Pediatrics.33
For physician-specific job
characteristics, we included variables that provided more detail on the nature of the pediatrician’s current job, including number of years in current job, workload (number of patients seen per week), practice ownership, work setting (area, academic), and compensation method. In previous research, authors controlled for work load,13practice
ownership,13,42,43work area,13,44and academic setting45in studies on earnings.
For work-family characteristics, we included marital status, number of children, choices made in job for their own children, choices made in job for their work environment, and periods of work reduction (reported working part-time and/or not working on one or more surveys over the last 5 years). These variables provide information often missing in analyses of income disparities: choices made for their own families (further described in Supplemental Table 3). For example, women may be seeking flexible work schedules and/or take on more responsibilities at home.46
Data Analysis
Annual earnings self-reported by pediatricians in 2016 were analyzed in several ways. First, we examined the distribution and overall mean of earnings by gender. Second, for the overall sample and separately for women and men, we usedttest and 1-way analysis of variance to examine pediatrician earnings by each labor force, physician-specific job, and work-family characteristic. Third, to estimate the adjusted difference in the log of pediatrician earnings between men and women, we used ordinary least squares regression. We conducted 4 regression models. Model 1 examined gender,
model 1 and model 2, model 2 and model 3, and model 3 and model 4.
For bivariate tests, continuous variables (years since residency graduation, work hours in a typical week, years in current position, number of patients seen in a typical week, number of children) were categorized for presentation purposes. For multivariable tests, these variables were included as continuous variables, centered at their means.
The number of cases in each analysis varied slightly because of missing values for specific questions. All analyses were conducted by using Stata Version 15 (Stata Corp, College Station, TX).
RESULTS
Sixty-seven percent of PLACES participants completed both 2016 surveys (1213 out of 1801 = 67%), which was similar for women and men (P= .99). The analytic sample
was restricted to participants who completed the question on income and worked in general pediatrics (n= 507), hospitalist care (n= 118), or subspecialty care (n= 373) in 2016 (totaln= 998). The 215 participants who were excluded from analysis were trained in a surgical specialty or internal medicine-pediatrics, working in a nonclinical and/or non-US position, in a fellowship training position, not working in 2016, and/or had missing data on income and/or specialty. Overall, 73.5% of the analytic sample are women.
Unadjusted Earnings by Labor Force, Physician-Specific Job, and
Work-Family Characteristics
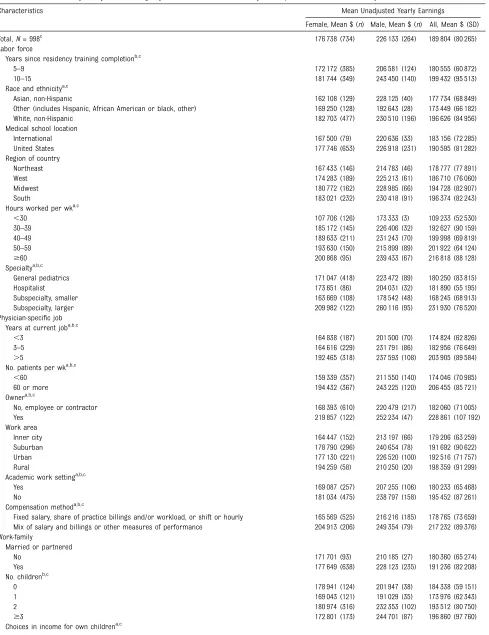
Overall pediatrician-reported mean annual income in 2016 was $189 804. For women, the unadjusted mean was $176 738 (median = $170 000, minimum = $9000, maximum = $750 000, and skewness = 1.76). For men, the mean was $226 133 (median = $210 000, minimum = $80 000,
maximum = $700 000, and skewness = 1.83).
Across characteristics, female pediatricians consistently reported lower mean earnings than male pediatricians (Table 2). For example, for those in general pediatrics, women reported earning $171 047 and men reported $223 472. Also, a disproportionate number of women were in the lowest-paid group of several characteristics. For example, 418 of 734 women (56.9%) and 89 of 264 men (33.7%) reported working in general pediatrics, and 271 of 727 women (37.3%) and 35 of 261 men (13.4%) reported working,40 hours per week.
Overall earnings were associated with many of the characteristics (Table 2). Among labor force characteristics, pediatricians in the larger
subspecialty group (eg, neonatology, cardiology, critical care, emergency medicine, gastroenterology, and hematology-oncology) and those TABLE 1Pediatrician Earnings: Description of Variables That Were Examined
Labor Force Physician-Specific Job Work-Family
Gender Years in current position (continuous
variable)
Marital status ∙Female
No. patients seen in a typical week (continuous variable)
∙Yes (married or partnered) ∙Male
Owner
∙No (never married or partnered, divorced, widowed)
Race and ethnicity
∙No
Parental status: no. of own children (continuous variable)
Years since residency graduation (continuous variable)
∙Yes Choices in income for own children
∙White, non-Hispanic
Work area ∙No (reported making little or no sacrifice
in income for children) ∙Asian
∙Suburban
∙Yes (reported the degree of sacrifice was very much or a fair amount) ∙Other, including minority (African American or black, Hispanic,
American Indian)
∙Inner city
Choices in income for work environment Medical school location
∙Urban
∙No (reported making little or no sacrifice in income for work environment) ∙US
∙Rural
∙Yes (reported the degree of sacrifice was very much or a fair amount) ∙International
Academic setting
Work reduction Region of country
∙No
∙No (always reported working full-time) ∙Northeast
∙Yes
∙Yes (reported working part-time and/or not working on 1 or more surveys over the last 5 years)
∙Midwest
Compensation method ∙South
∙Mix salary and share of billings or other measures of performance ∙West
∙Other, includingfixed salary, share of practice billings or workload, and shift or hourly
No. work h per wk (continuous variable) Specialty
∙General pediatrics ∙Hospitalist
∙Subspecialty, larger: neonatology, pediatric cardiology, pediatric critical care, pediatric emergency medicine, pediatric gastroenterology, and pediatric hematology-oncology33
∙Subspecialty, smaller: all other subspecialties
working$60 hours reported the highest incomes, reporting overall mean earnings of $231 930 and $216 818, respectively. Among physician-specific characteristics, pediatricians who reported more years at their current job, more patients per week, being an owner, working in a nonacademic work setting, and being paid by a mix of salary and billings or performance measures reported higher earnings. For example, the overall mean income of owners was $228 861 and
employees was $182 060,P,.001. Among work-family characteristics, large differences in mean unadjusted earnings were found. For example, the overall mean for pediatricians who reported making choices in their earned income for their children was significantly lower than those not reporting such choices ($167 884 vs $205 183,P,.001).
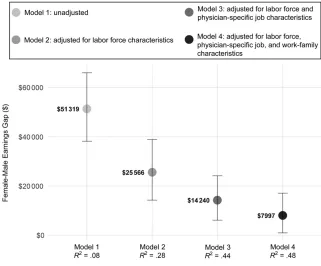
Independent Effect of Gender on Log of Pediatrician Earnings: Unadjusted and Adjusted Earnings
In Figure 1, we present the male gender coefficient andR2for 4 models using the log of annual earnings. Without any adjustment, male pediatricians earned $51 319 more than female pediatricians,P, .001 (model 1). Adjusting for labor force characteristics, men earned $25 566 more than women,P,.001 (model 2). Adjusting for both labor force and physician-specific job characteristics, men earned $14 240 more than women,P,.001 (model 3). Finally, when adjusting for labor force, physician-specific job, and work-family characteristics, men earned $7997 more than women,P, .05 (model 4). The modelR2
increased across the 4 models, from 0.08 in the unadjusted model 1 to 0.48 in model 4. We used likelihood ratio tests to assess whether each subsequent model led to a significant increase in modelfit; across models, each increase in explained earnings variation was statistically significant (P,.001). The female-to-male
earnings ratio increased across models, from 0.76 in model 1, to 0.87 in model 2, 0.91 in model 3, and 0.94 in model 4. The full model results are presented in Supplemental Table 4.
DISCUSSION
We analyzed self-reported 2016 annual earnings among early- to midcareer pediatricians and found women earn less than men. Before any adjustment, female pediatricians earn 76% of what male pediatricians earn, or∼$51 000 less. Adjusting for common labor force characteristics, such as demographics, experience, work hours, and specialty, female pediatricians earn 87% of what male pediatricians earn, or∼$26 000 less. Adjusting for both labor force and physician-specific job characteristics, female pediatricians earn 91% of male pediatrician earnings, or
∼$14 000 less. Finally, adjusting for a comprehensive set of labor force, job-specific, and work-family variables, female pediatricians earn 94% of male pediatrician earnings, or
∼$8000 less.
Our study is comparable to gender differences found in other studies of US workers. In our unadjusted model, we found the female-to-male earnings ratio was 0.76. Among full-time US workers, the female-to-male
unadjusted annual earnings ratio was 0.81 in 2016.47A US government report by the Joint Economic Committee summarized the
persistent gender earnings gap across diverse occupations and education levels, with the largest pay gap among those with professional degrees and worse for mothers and part-time workers.48
Ourfindings compare with studies of other physicians in which researchers found large unadjusted gender differences in income and smaller differences when adjustments are made, ranging from women earning 8% to 38% less than
men.9,13,17–19,49–51Because we
controlled for labor force, job-specific, and work-family variables in our study, thefindings support previous reports in which authors suggested earnings gaps may be related to mothers who might prioritize job flexibility19and that periods of part-time work and not working are related to earnings.12
The role of employment negotiations and discrimination in the earnings gap has been discussed.44Women and men may make different choices, negotiate differently, or experience different pressure from themselves or others regarding their own children and families. Women, including physicians, spend more time on household and child care
responsibilities than men.46,52,53They may accept lower salaries for nonmonetary benefits, such as fewer work hours,54flexibility of work hours, and location or community of work place.44Our study is unique because our focus is on one specialty, and we adjust for a comprehensive set of work-life characteristics that other researchers have suggested are important.12,18–20Besides labor force variables (eg, work hours and specialty), some of the largest differences in earnings were among the work-family characteristics. Still, even when controlling for these characteristics, we found that early-to midcareer women in pediatrics earned $8000 less than men.
The gender pay gap is complex and multifaceted. Economists have discussed the issue extensively and propose explanations such as education, occupation choice, experience, work placeflexibility and hours, negotiation skills,
TABLE 2Pediatrician Yearly Unadjusted Earnings by Gender and Labor Force, Physician-Specific Job, and Work-Family Characteristics
Characteristics Mean Unadjusted Yearly Earnings
Female, Mean $ (n) Male, Mean $ (n) All, Mean $ (SD)
Total,N= 998c 176 738 (734) 226 133 (264) 189 804 (80 265)
Labor force
Years since residency training completionb,c
5–9 172 172 (385) 206 581 (124) 180 555 (60 872)
10–15 181 744 (349) 243 450 (140) 199 432 (95 513)
Race and ethnicitya,c
Asian, non-Hispanic 162 108 (129) 228 125 (40) 177 734 (68 849)
Other (includes Hispanic, African American or black, other) 169 250 (128) 192 643 (28) 173 449 (66 182)
White, non-Hispanic 182 703 (477) 230 510 (196) 196 626 (84 956)
Medical school location
International 167 500 (79) 220 636 (33) 183 156 (72 285)
United States 177 746 (653) 226 918 (231) 190 595 (81 282)
Region of country
Northeast 167 433 (146) 214 783 (46) 178 777 (77 891)
West 174 283 (189) 225 213 (61) 186 710 (76 060)
Midwest 180 772 (162) 228 985 (66) 194 728 (82 907)
South 183 021 (232) 230 418 (91) 196 374 (82 243)
Hours worked per wka,c
,30 107 706 (126) 173 333 (3) 109 233 (52 530)
30–39 185 172 (145) 226 406 (32) 192 627 (90 159)
40–49 189 633 (211) 231 243 (70) 199 998 (69 819)
50–59 193 630 (150) 215 899 (89) 201 922 (64 124)
$60 200 868 (95) 239 433 (67) 216 818 (88 128)
Specialtya,b,c
General pediatrics 171 047 (418) 223 472 (89) 180 250 (83 815)
Hospitalist 173 651 (86) 204 031 (32) 181 890 (55 195)
Subspecialty, smaller 163 669 (108) 178 542 (48) 168 245 (68 913)
Subspecialty, larger 209 982 (122) 260 116 (95) 231 930 (76 520)
Physician-specific job Years at current joba,b,c
,3 164 838 (187) 201 500 (70) 174 824 (62 826)
3–5 164 616 (229) 231 791 (86) 182 956 (76 649)
.5 192 465 (318) 237 593 (108) 203 905 (89 584)
No. patients per wka,b,c
,60 159 339 (357) 211 550 (140) 174 046 (70 985)
60 or more 194 432 (367) 243 225 (120) 206 455 (85 721)
Ownera,b,c
No, employee or contractor 168 393 (610) 220 479 (217) 182 060 (71 005)
Yes 219 857 (122) 252 234 (47) 228 861 (107 192)
Work area
Inner city 164 447 (152) 213 197 (66) 179 206 (63 259)
Suburban 178 790 (296) 240 654 (78) 191 692 (90 622)
Urban 177 130 (221) 226 520 (100) 192 516 (71 757)
Rural 194 259 (58) 210 250 (20) 198 359 (91 299)
Academic work settinga,b,c
Yes 169 087 (257) 207 255 (106) 180 233 (65 468)
No 181 034 (475) 238 797 (158) 195 452 (87 261)
Compensation methoda,b,c
Fixed salary, share of practice billings and/or workload, or shift or hourly 165 569 (525) 216 216 (185) 178 765 (73 659)
Mix of salary and billings or other measures of performance 204 913 (206) 249 354 (79) 217 232 (89 376)
Work-family
Married or partnered
No 171 701 (93) 210 185 (27) 180 360 (65 274)
Yes 177 649 (638) 228 123 (235) 191 236 (82 208)
No. childrenb,c
0 178 941 (124) 201 947 (38) 184 338 (59 151)
1 169 043 (121) 191 029 (35) 173 976 (62 343)
2 180 974 (316) 232 353 (102) 193 512 (80 750)
$3 172 801 (173) 244 701 (87) 196 860 (97 760)
work hours at the start of their careers, but over time, both income and work hours increasingly
diverged.55Researchers also reported that work interruptions and
differences in hours worked
explained much of the gender gap in
earnings and having children was related to more work interruptions, fewer hours worked, and less income for women but not men. Economist Claudia Goldin suggests that to obtain convergence of pay, changes to the structure and renumeration of jobs
are needed (eg, more-flexible work schedules without reduction in opportunities and pay).57
US academic medical institutions are working toward policies to achieve pay equity.58In a study of an academic pediatrics department, gender salary inequalities were found and an intervention strategy was designed that focused on several areas, including salary corrections and annual monitoring of salaries.15 Postintervention, gender salary differences were no longer
significant. Their intervention might be helpful to other physician employers.
Our study has strengths, including a national sample, focus on a specialty with a majority of women, and examination of a comprehensive set of physician characteristics.
Limitations include that data are self-reported by early- and midcareer pediatricians and many different pediatric subspecialties were combined because of insufficient numbers to examine separately. The generalizability to other specialties or career stages and whether our findings differ from studies of specialties with lower portions of women is unclear. The difference in earnings might be more substantial as pediatricians progress through their careers. Although the response among PLACES participants who completed the study surveys was high, the initial project sign-up rate TABLE 2 Continued
Characteristics Mean Unadjusted Yearly Earnings
Female, Mean $ (n) Male, Mean $ (n) All, Mean $ (SD)
Yes 158 493 (336) 210 527 (74) 167 884 (77 331)
No 192 215 (396) 232 211 (190) 205 183 (78 837)
Choices in income for work environmenta,b,c
Yes 162 670 (261) 206 767 (90) 173 977 (73 591)
No 184 378 (469) 235 930 (172) 198 211 (82 633)
Work reduction: reported working part-time and/or not working on$1 surveys over the last 5 ya,c
Yes 149 711 (325) 207 129 (31) 154 711 (75 003)
No 198 214 (409) 228 661 (233) 209 264 (76 431)
aOne-way analysis of variance,P,.05 for female (test examined bivariate associations for annual earnings and characteristics separately for female and male pediatricians). bOne-way analysis of variance,P,.05 for male.
cOne-way analysis of variance,P,.05 for all (both female and male).
FIGURE 1
was lower, at∼40%, and women, US medical school graduates, and AAP members were more likely to sign up. We could not adjust for all possible characteristics, so it remains unclear whether it is only gender that explains the remaining income gap between men and women. Because of small numbers of Hispanic and African American pediatricians in our sample, we combined these
pediatricians with those who specified“other race”and were not sufficiently powered to examine differences in earnings for specific groups. Finally, the data are cross-sectional and therefore do not explore how pediatrician earnings and the gender gap progress over time, which
will be possible with future PLACES data.
CONCLUSIONS
In this study, we found gender differences in annual earnings among early- and midcareer pediatricians, with women earning less than men. This difference persists after
adjustment for important labor force, physician-specific, and work-life characteristics. With more female physicians in the workforce, the findings can be important to understanding overall physician earnings. In future work, researchers should use longitudinal analysis and further explore periods of part-time
work, family obligations, and work flexibility.
ACKNOWLEDGMENTS
We thank the pediatricians participating in PLACES who are all giving generously of their time to make this project possible. This research was supported by the AAP.
ABBREVIATIONS
AAP: American Academy of Pediatrics
PLACES: Pediatrician Life and Career Experience Study
Address correspondence to Mary Pat Frintner, MSPH, American Academy of Pediatrics, 345 Park Blvd, Itasca, IL 60143. E-mail: mfrintner@aap.org
PEDIATRICS (ISSN Numbers: Print, 0031-4005; Online, 1098-4275).
Copyright © 2019 by the American Academy of Pediatrics
FINANCIAL DISCLOSURE:The authors have indicated they have nofinancial relationships relevant to this article to disclose. FUNDING:This study was supported by the American Academy of Pediatrics.
POTENTIAL CONFLICT OF INTEREST:The authors have indicated they have no potential conflicts of interest to disclose.
REFERENCES
1. American Medical Association. Physician Characteristics and Distribution in the U.S., 2015. Chicago, IL: American Medical Association; 2015
2. Butkus R, Serchen J, Moyer DV, Bornstein SS, Hingle ST; Health and Public Policy Committee of the American College of Physicians. Achieving gender equity in physician compensation and career
advancement: a position paper of the American College of Physicians.Ann Intern Med. 2018;168(10):721–723
3. Association of American Medical Colleges. Table B-2: total graduates by U.S. medical school, sex, and year. Availabe at: https://www.aamc.org/ data/facts/enrollmentgraduate/148670/ total-grads-by-school-gender.html. Accessed May 15, 2019
4. Association of American Medical Colleges. Active physicians by sex and specialty, 2017. Table 1.3. Available at:
https://www.aamc.org/data/workforce/ reports/492560/1-3-chart.html. Accessed May 15, 2019
5. American Academy of Pediatrics, Department of Research. Periodic survey of fellows: pediatricians’ practice and personal characteristics: US only, 2016. Available at: www.aap. org/research/periodicsurvey/. Accessed January 23, 2019
6. American Board of Pediatrics. Pediatric physicians workforce data book, 2017-2018. Available at: https://www.abp.org/ sites/abp/files/pdf/pediatricph ysiciansworkforcedatabook2017-2018.pdf. Accessed August 15, 2019
7. American Academy of Pediatrics, Department of Research. Graduating resident survey trend data. Available at: http://www2.aap.org/research/ graduatingressurvey.htm. Accessed November 12, 2018
8. Spector ND, Cull W, Daniels SR, et al. Gender and generational influences on the pediatric workforce and practice. Pediatrics. 2014;133(6):1112–1121
9. Nguyen Le TA, Lo Sasso AT, Vujicic M. Trends in the earnings gender gap among dentists, physicians, and lawyers.J Am Dent Assoc. 2017;148(4): 257–262.e2
10. Ly DP, Seabury SA, Jena AB. Differences in incomes of physicians in the United States by race and sex: observational study.BMJ. 2016;353:i2923
11. Seabury SA, Chandra A, Jena AB. Trends in the earnings of male and female health care professionals in the United States, 1987 to 2010.JAMA Intern Med. 2013;173(18):1748–1750
13. Weeks WB, Wallace AE. Race and gender differences in pediatricians’annual incomes.Ambul Pediatr. 2007;7(2): 196–200
14. Weeks WB, Wallace TA, Wallace AE. How do race and sex affect the earnings of primary care physicians?Health Aff (Millwood). 2009;28(2):557–566
15. Rotbart HA, McMillen D, Taussig H, Daniels SR. Assessing gender equity in a large academic department of pediatrics.Acad Med. 2012;87(1):98–104
16. Freund KM, Raj A, Kaplan SE, et al. Inequities in academic compensation by gender: a follow-up to the National Faculty Survey Cohort Study.Acad Med. 2016;91(8):1068–1073
17. Jena AB, Olenski AR, Blumenthal DM. Sex differences in physician salary in US public medical schools.JAMA Intern Med. 2016;176(9):1294–1304
18. Jagsi R, Griffith KA, Stewart A, et al. Gender differences in salary in a recent cohort of early-career physician-researchers.Acad Med. 2013;88(11): 1689–1699
19. Jagsi R, Griffith KA, Stewart A, et al. Gender differences in the salaries of physician researchers.JAMA. 2012; 307(22):2410–2417
20. Read S, Butkus R, Weissman A, Moyer DV. Compensation disparities by gender in internal medicine.Ann Intern Med. 2018;169(9):658–661
21. Institute for Women’s Policy Research. The gender wage gap by occupation 2017 and by race and ethnicity. Available at: https://iwpr.org/ publications/gender-wage-gap-occupation-2017-race-ethnicity/. Accessed January 23, 2019
22. Leigh JP, Tancredi D, Jerant A, Kravitz RL. Physician wages across specialties: informing the physician reimbursement debate.Arch Intern Med. 2010;170(19): 1728–1734
23. American Medical Association. Physician Characteristics and Distribution in the U.S., 2014. Chicago, IL: Survey and Data Resources, American Medical Association; 2014. Available at: http://amascb.pdn. ipublishcentral.com/product/physician-characteristics-distribution-in-us-2014. Accessed March 9, 2016
24. Starmer AJ, Frintner MP, Freed GL. Work-life balance, burnout, and satisfaction of early career
pediatricians.Pediatrics. 2016;137(4): e20153183
25. American Academy of Pediatrics. Pediatrician life and career experience study. Available at: https://www.aap. org/en-us/professional-resources/ Research/pediatrician-surveys/Pages/ Pediatrician-Life-And-Career-Experience-Study-PLACES.aspx. Accessed March 9, 2016
26. Frintner MP, Cull WL, Byrne BJ, et al. A longitudinal study of pediatricians early in their careers: PLACES.Pediatrics. 2015;136(2):370–380
27. Medscape. Medscape physician compensation report 2015. Available at: www.medscape.com/slideshow/ compensation-2015-overview-6006679 #1. Accessed September 13, 2017
28. American Board of Pediatrics. Workforce data 2015-2016. 2011. Available at: https://www.abp.org/sites/ abp/files/pdf/workforcebook.pdf. Accessed February 12, 2010
29. Centers for Disease Control and Prevention. Ambulatory health care data. 2018. Available at: https://www. cdc.gov/nchs/ahcd/index.htm. Accessed January 24, 2018
30. The University of Melbourne. Medicine in Australia: balancing employment and life (MABEL). Available at: https://mabel. org.au/about.html. Accessed August 31, 2011
31. RAND Corporation. Factors affecting physician professional satisfaction and their implications for patient care, health systems, and health policy. Available at: www.rand.org/content/ dam/rand/pubs/research_reports/RR4 00/RR439/RAND_RR439.pdf. Accessed September 14, 2015
32. Sobecks NW, Justice AC, Hinze S, et al. When doctors marry doctors: a survey exploring the professional and family lives of young physicians.Ann Intern Med. 1999;130(4 pt 1):312–319
33. The American Board of Pediatrics. Subspecialty fellowship tracking data. 2018. Available at: https://www.abp.org/ content/subspecialty-fellowship-tracking-data. Accessed November 14, 2018
34. US Department of Labor. Occupational employment statistics. Occupational employment and wages, May 2018. Available at: https://www.bls.gov/oes/ current/oes291065.htm#(2). Accessed October 9, 2018
35. Bureau of Labor Statistics. Labor force characteristics. Available at: https:// www.bls.gov/cps/lfcharacteristics.htm. Accessed October 10, 2018
36. Chamberlain A. Demystifying the gender pay gap: evidence from Glassdoor salary data. Available at: https://www. glassdoor.com/research/studies/ gender-pay-gap/. Accessed August 24, 2018
37. Blau FD, Kahn LM.The Gender Wage Gap: Extent, Trends, and Explanations. Cambridge, MA: National Bureau of Economic Research; 2016
38. Newgeography. Regional exchange rates: the cost of living in US metropolitan areas. Available at: www. newgeography.com/content/002019- regional-exchange-rates-the-cost-living-us-metropolitan-areas. Accessed August 23, 2018
39. Cull WL, Frintner MP, O’Connor KG, Olson LM. Pediatricians working part-time has plateaued.J Pediatr. 2016;171:294–299
40. Noonan MC, Corcoran ME, Courant PN. Pay differences among the highly trained: cohort differences in the sex gap in lawyers’earnings.Soc Forces. 2005;84(2):853–872
41. Rochlin JM, Simon HK. Does fellowship pay: what is the long-termfinancial impact of subspecialty training in pediatrics?Pediatrics. 2011;127(2): 254–260
42. McMurray JE, Linzer M, Konrad TR, et al; The SGIM Career Satisfaction Study Group. The work lives of women physicians results from the physician work life study.J Gen Intern Med. 2000; 15(6):372–380
43. Ness RB, Ukoli F, Hunt S, et al. Salary equity among male and female internists in Pennsylvania.Ann Intern Med. 2000;133(2):104–110
44. Lo Sasso AT, Richards MR, Chou C-F, Gerber SE. The $16,819 pay gap for newly trained physicians: the
45. Burke CA, Sastri SV, Jacobsen G, et al. Gender disparity in the practice of gastroenterology: thefirst 5 years of a career.Am J Gastroenterol. 2005; 100(2):259–264
46. Starmer AJ, Frintner MP, Matos K, et al. Gender discrepancies related to pediatrician work-life balance and household responsibilities.Pediatrics. 2019;144(4):e20182926
47. US Census Bureau. Income and poverty in the United States: 2016. Available at: https://www.census.gov/library/ publications/2017/demo/p60-259.html. Accessed September 12, 2018
48. US Congress Joint Economic Committee. Invest in women, invest in America. A comprehensive review of women in the US economy. Available at: https://www.in.gov/icw/files/invest_ women.pdf. Accessed August 7, 2019
49. Okoshi K, Nomura K, Taka F, et al. Suturing the gender gap: income,
marriage, and parenthood among Japanese Surgeons.Surgery. 2016; 159(5):1249–1259
50. Weaver AC, Wetterneck TB, Whelan CT, Hinami K. A matter of priorities? Exploring the persistent gender pay gap in hospital medicine.J Hosp Med. 2015;10(8):486–490
51. Baker LC. Differences in earnings between male and female physicians. N Engl J Med. 1996;334(15):960– 964
52. Lachance-Grzela M, Bouchard G. Why do women do the lion’s share of
housework? A decade of research.Sex Roles. 2010;63(11–12):767–
780
53. Jolly S, Griffith KA, DeCastro R, et al. Gender differences in time spent on parenting and domestic responsibilities by high-achieving young physician-researchers.Ann Intern Med. 2014; 160(5):344–353
54. Weeks W, Ventelou B. Exploration of leisure time valuation to explain sex-based wage gaps among salaried primary care physicians in the US. J Rev Glob Econ. 2017;6:395–403
55. Bertrand M, Goldin C, Katz LF. Dynamics of the gender gap for young
professionals in thefinancial and corporate sectors.Am Econ J Appl Econ. 2010;2:228–255
56. AAUW. The simple truth about the gender pay gap report. 2018. Available at: https://www.aauw.org/resource/the-simple-truth-about-the-gender-pay-gap/. Accessed June 6, 2018
57. Goldin C. How to achieve gender equality.Milken Inst Rev. 2015;July(Q3): 24–33
DOI: 10.1542/peds.2018-3955 originally published online September 10, 2019;
2019;144;
Pediatrics
Lynn M. Olson
Mary Pat Frintner, Blake Sisk, Bobbi J. Byrne, Gary L. Freed, Amy J. Starmer and
Gender Differences in Earnings of Early- and Midcareer Pediatricians
Services
Updated Information &
http://pediatrics.aappublications.org/content/144/4/e20183955
including high resolution figures, can be found at:
References
http://pediatrics.aappublications.org/content/144/4/e20183955#BIBL
This article cites 33 articles, 8 of which you can access for free at:
Subspecialty Collections
http://www.aappublications.org/cgi/collection/workforce_sub Workforce
ub
http://www.aappublications.org/cgi/collection/career_development_s Career Development
b
http://www.aappublications.org/cgi/collection/medical_education_su Medical Education
following collection(s):
This article, along with others on similar topics, appears in the
Permissions & Licensing
http://www.aappublications.org/site/misc/Permissions.xhtml
in its entirety can be found online at:
Information about reproducing this article in parts (figures, tables) or
Reprints
http://www.aappublications.org/site/misc/reprints.xhtml
DOI: 10.1542/peds.2018-3955 originally published online September 10, 2019;
2019;144;
Pediatrics
Lynn M. Olson
Mary Pat Frintner, Blake Sisk, Bobbi J. Byrne, Gary L. Freed, Amy J. Starmer and
Gender Differences in Earnings of Early- and Midcareer Pediatricians
http://pediatrics.aappublications.org/content/144/4/e20183955
located on the World Wide Web at:
The online version of this article, along with updated information and services, is
http://pediatrics.aappublications.org/content/suppl/2019/09/09/peds.2018-3955.DCSupplemental
Data Supplement at:
by the American Academy of Pediatrics. All rights reserved. Print ISSN: 1073-0397.