Factors Affecting Variation in SMEs’ Export
Intensity
Mohamad D. Revindo
1* & Christopher Gan
2Abstract
Small and Medium-sized Enterprises (SMEs) are more constrained to participate in export market than their large counterparts despite various export assistance provision by the government. Extant literature on SME internationalization mostly focus more on how non-exporting SMEs can become exporters than on how exporting SMEs can sustain and expand their export. This study aims to investigate the factors affecting SMEs’ export intensity with reference to the case of Indonesia. Fractional-logit regressions were used to identify the influence of export-exhibiting factors, export-inhibiting factors, and firm and owner characteristics on SMEs’ export intensity. The evidences were collected from 497 SMEs in seven provinces in Jawa, Madura and Bali regions. The findings show that SMEs’ export intensity is affected by some firm characteristics including firm age and total employees. Export intensity is also affected by some exhibiting factors including owners’ overseas and MNC/exporting firm work experience, central government agencies’ assistance, network relationships with non-government actors, location, export market of choices and years of exporting. By contrast, export intensity is adversely affected by perceived difficulties in overcoming informational and human resources barriers, distribution, logistics and promotional barriers, financial barriers, foreign govern-ment barriers, procedural barriers and price barriers. The policy and managerial implications of the findings are discussed.
JEL Classification:F23; L25; M13; M16; O17
Keywords
SMEs — internationalization — export intensity — export barriers — Indonesia
1Institute for Economic and Social Research, Faculty of Economics and Business, Universitas Indonesia (LPEM- FEBUI), Jakarta and Faculty of Agribusiness and Commerce, Lincoln University, New Zealand
2Professor in Accounting and Finance, Faculty of Agribusiness and Commerce, Department of Financial and Business System, Lincoln University, New Zealand
*Corresponding author: Institute for Economic and Social Research (LPEM) Universitas Indonesia. UI – Salemba Campus, Salemba Raya St., No. 4, Jakarta, 10430, Indonesia. Email:revindo@lpem-feui.org.
1. Introduction
Firm internationalisation has been evident and rapid for at least over the last two decades. Despite no consensus on the precise definition of firm internationalisation, it can be perceived simply as a process of a firm’s increasing involvement in international business operations (Welch & Luostarinen, 1999) or the process of adapting firm’s operations (strategies, structures and resources) to inter-national environments/markets (Calof & Beamish, 1995). However, a firm’s engagement in international operations may take various forms including exporting, importing, in-vesting abroad, licensing or cooperating with foreign firms. Hence, the broad definition of firm internationalisation in-cludes inward, outward and cooperative international activi-ties (Ruzzier, Hisrich, & Antoncic, 2006).
For example, during 2001-17 the world’s merchandise export value had almost tripled from 6.1 to 17.4 trillion USD (ITC, 2018a) and during 2005-16 the global exports in services recorded nearly twofold increase from 2.52 to 4.83 trillion USD (ITC, 2018b). During 2001-14, the world’s foreign direct investments (FDI) outward stocks rose more than 3.3 times from 7.77 to 25.87 trillion USD (UNCTAD, 2014, 2015). The steady growth of trade and FDI helped the global economy to sustain positive gross domestic product (GDP) growth (2.58% annual average), albeit being inter-rupted by the 2007–08 global financial crisis (World Bank,
2016). At the firm level, trade openness also helped a great number of firms worldwide to sustain their businesses and maintain growth and productivity (OECD, 2012).
However, the benefits of trade openness are not reaped equally among countries and enterprises. Despite the grow-ing importance of developgrow-ing countries in world trade, the 34 OECD member states still accounted for 56–60% of world merchandise export value during 2010–2017 (ITC, 2018a). At the firm level, large enterprises are more pre-pared to capitalise on trade opportunities compre-pared to small and medium-sized enterprises (SMEs). For example, in the mid-2000s SMEs in the US, Switzerland, the Netherlands, United Kingdom, China and Japan only contributed 30–38% of their respective national exports (Hammer & Stamps, 2010). SMEs’ contributions have also been modest in the more advanced modes of outward internationalisation (i.e. services export and outward FDI) (Adlung & Soprana, 2013; Dalli, 1995; Kogut & Chang, 1996).
gen-eral firm internationalization because SMEs have particular characteristics such as smallness and limited resources that may constrict their international business activities (Laghza-oui, 2007; Ruzzier, Hisrich, & Antoncic, 2006).
SMEs’ meagre export contributions are more prevalent in developing countries. For example, in ASEAN member states on average SMEs only accounted for 23% of total exports (Wignaraja, 2012).1 In Indonesia, despite being a major source of GDP growth and job creation, SMEs’ share in total non-oil and gas exports was minuscule at 9.3%. SMEs’ inability to seize trade opportunity, along with Indonesia’s increasing engagement in various free trade agreements (FTAs) which force local products to compete directly with cheap imported merchandise in the domestic market, may severely threaten SMEs’ business sustainability in the future.2
In Indonesia, SMEs (including micro enterprises) play an important role in the economy, particularly as they have been major source of business establishments, employment opportunities and value added creation, and their contribu-tions tend to rise over time.3During 2005-13 SMEs made up 99.99% of the total business entities, provided more than 97% of job opportunities and contributed around 56-59% of the Indonesian GDP (Ministry of Cooperatives and SMEs Republic of Indonesia, 2009b, 2010a, 2010b, 2013, 2014, 2015). By contrast, in the same period, SMEs only accounted for a small share of Indonesia’s non-oil and gas exports. Further, despite SMEs’ steady rise in total annual export value, their share in Indonesia’s non-oil and gas ex-ports continually shrank from around 18.5% in 2005–07 to 16.9% in 2008–10 and further down to 15.4% between 2011 and 2013.4
Thus, Indonesian SMEs are less able to take advan-tage of export opportunities from trade liberalization com-pared to their larger Indonesian counterparts (Wengel & Rodriguez, 2006). Indonesian SMEs also fare less well in ex-port performance compared to SMEs in other ASEAN coun-tries (Wignaraja, 2012) and perform far below SMEs in de-veloped countries (Hammer & Stamps, 2010). SMEs’ poor export performances persist despite various policy measures launched by the Government of Indonesia (GOI), including general assistance (such as access to credit, technical and managerial training) as well as specific export-related as-sistance (including trade promotion, business matching and
1The Association of Southeast Asian Nations (ASEAN) is a regional
economic and political cooperation organisation that was founded in 1967 and currently comprises ten member states namely Indonesia, Malaysia, Philippines, Singapore, Thailand, Brunei Darussalam, Viet Nam, Lao PDR, Myanmar, and Cambodia.
2As of May 2018, Indonesia had nine FTAs in effect, including
ASEAN (1993), ASEAN-China (2010), ASEAN-Australia and New Zealand (2010), India (2010), Japan (2008), ASEAN-Korea (2007), Indonesia-Japan (2008), Group of Eight Developing Coun-tries (2011) and Indonesia-Pakistan (2013). Indonesia also has ongoing negotiations with several other regional and bilateral FTAs.
3Prior to the implementation of the Law No. 20 (2008) on Micro, Small
and Medium-Sized Enterprise, the “Small-sized Enterprise” term generally included small and micro-enterprises. For the distinction between small and micro-enterprises, see Section 3.1.
4If oil and gas exports are included, SMEs’ and micro-enterprises’
contribution might be even lower since oil and gas exports are performed by large state-owned enterprises. Hence, this figure supports Wignaraja (2012) that Indonesian SMEs’ contribution to total exports was actually 9.3%.
training in export procedures).
This study aims to analyse the internationalization of Indonesian SMEs, particularly their direct-export activi-ties. There have been extensive researches on Indonesian SMEs but only a few shed lights on their internationaliza-tion, particularly their export activities. Of those few studies, they mostly focused on pre-export activities (i.e. how non-exporting SMEs can become exporters). For example, how SMEs’ export is affected by human capital (Sari, Alam, & Beaumont, 2008), trade facilitation programmes (Tam-bunan, 2009b), industry clustering on exports (Tam(Tam-bunan, 2009a) and various export stimuli and export barrier factors (Revindo & Gan, 2017; Revindo, 2017, 2018; Revindo & Gan, 2016; Revindo, Gan, & Nguyen, 2015, 2017). With regard to post-export activities of Indonesian SMEs, to the extent of our knowledge there has been no particular study except one on export performance by Wengel & Rodriguez (2006). Given, the gap in the extant literature, this study aims to investigate Indonesian SMEs’ post-export activi-ties, especially the factors that determine Indonesian SMEs’ export intensity.
Moreover, most of the extant literature has partially looked at SMEs in certain regions, sectors or industries in Indonesia. For example, Sari (2011) examined the inter-nationalisation of manufacturing firms while Jane (2013), Zubadi & Nugroho (2012) and Roida & Sunarjanto (2012) studied the case of firm internationalisation in Bandung City, Magelang Regency, and Jawa Timur Province, respectively. By contrast, this study covers SMEs in seven provinces in Java, Madura and Bali Islands where approximately 60% of Indonesian SMEs operate (Kuncoro, 2009) and includes SMEs in various sectors/products.
For policy makers/regulators, the findings of this study are beneficial for the government of Indonesia as well as the governments in other developing countries to foster SMEs’ exports and SMEs’ competitiveness in international markets. In particular, the findings of this study provide more insight into the formulation of general strategy and policy measures to assist SMEs to speed up their internationalization, or to sustain or expand their current international business activities. Hence, the findings of this study pave the way for further research in this area aimed at formulating specific and detailed policy-mix and measures in particular industry or region.
At the managerial level, the study will enhance SME owners’ and managers’ understanding of the international-ization processes and strategies and lessons learned from successful exporters. SMEs’ managerial team can also learn how to utilise various networking sources and government export assistance to help them escalate their international business activities.
recommen-dations for future study.
2. Literature Review
SMEs confront complex challenges in exporting, thus the effectiveness of export-related policies and assistance re-quires a comprehensive understanding of SMEs’ export activities. The extant literature provide a comprehensive analysis and evidence of SMEs at pre-export stage includ-ing the export stimulatinclud-ing factors (Acedo & Gal´an, 2011; Leonidou, 1995b; Morgan, 1997; Morgan & Katsikeas, 1997; OECD, 2009), export barriers (European Commis-sion, 2010; Leonidou, 1995a, 2004; Morgan, 1997; OECD-APEC, 2006; OECD, 2009), internationalization processes and strategies (Andersen, 1993; Cavusgil, 1980; Mel´en, 2009; Nguyen, Le, & Bryant, 2013; Thai, 2008), as well as the role of the government and network relationships in assisting SMEs to export (Kontinen & Ojala, 2012; Ko-rhonen, Luostarinen, & Welch, 1996; Rodrigues & Child, 2012; Shamsuddoha, Ali, & Ndubisi, 2009; Wilkinson & Brouthers, 2006).
The ability of SMEs to export is one of the hallmarks of a country’s successful effort to foster SME international-ization. However, the challenges and obstacles of exporting prevail upon the firm’s entry into foreign markets. SMEs that successfully enter foreign markets may have difficulties in sustaining or expanding their exports; thereby exporting SMEs differ in their export performances. For example, an exporter may have higher export revenue or higher export intensity (share of export revenue in total revenue) than other exporters and the export intensity may range from as low as 1% to as high as 100%.
Hence, understanding the factors that affect the firm’s export performance (export sustainment and development) and its behaviour in the foreign markets is simply as impor-tant as understanding the factors that trigger a firm to initiate export activities (Sousa, Mart´ınez-L´opez, & Coelho, 2008). Extant literature highlights two key issues particularly re-lated to SMEs at the post-export stage: export performance (Dhanaraj & Beamish, 2003; Hart & Tzokas, 1999; Robert-son & Chetty, 2000; Sousa, Mart´ınez-L´opez, & Coelho, 2008; Wengel & Rodriguez, 2006) and the impact of export engagement on SMEs’ performances (Ganotakis & Love, 2012; Hitt, Hoskisson, & Kim, 1997; Lu & Beamish, 2001, 2004, 2006; Singla & George, 2013).
This study focuses on SMEs’ post-export activities, es-pecially their export performance. In general, there are two conceptual frameworks that have been widely used to exam-ine export performance (Sousa, Mart´ınez-L´opez, & Coelho, 2008). The first framework is drawn from the resource-basedview with a focus on the firm’s internal factors that influence export performance while the second framework is thecontingency paradigmthat brings more explanations on external determinants.The resource-basedview approach focuses on how a set of firm’s unique resources creates and sustains competitive advantage (Conner & Prahalad, 1996; Wilkinson & Brouthers, 2006). A firm can be perceived as a collection of physical and human resources and therefore variations in performance across firms can be explained by the heterogeneity in these resources and capabilities (Makadok, 2001). A firm may perform better than other
firms in the same industry and market if that firm possesses and exploits its unique resources (Dhanaraj & Beamish, 2003). Correspondingly, in the context of internationaliza-tionthe resource-based viewsuggests that a firm’s export performance is determined by the firm’s characteristics such as size, experience and production techniques (Zou & Stan, 1998).
A rather different view on export performance is offered by the contingency paradigmthat is based on the struc-ture–conduct–performance (SCP) framework commonly used in industrial organization analysis (Cavusgil & Zou, 1994; Zou & Stan, 1998). The SCP framework argues that an organization’s resources is dependent on its environ-ments and that the organization develops and maintains appropriate strategies to manage the dependence (Sousa, Mart´ınez-L´opez, & Coelho, 2008). Hence, in the context of internationalization it is the environmental factors spe-cific to the firm that determine the firm’s characteristics and internationalization strategies which in turn affect the firm’s export performance. In other words,the contingency paradigmviews that export engagement is a firm’s strategic response to its internal and external factors (Robertson & Chetty, 2000; Yeoh & Jeong, 1995).
However, rather than emphasizing on the comparison and selecting the most appropriate of the two conceptual frameworks, Sousa, Mart´ınez-L´opez, & Coelho (2008) sug-gest the incorporation of them into a comprehensive frame-work to analyse the export performance. Figure 1 illus-trate how the firm’s export performance is affected by in-ternal and exin-ternal factors. The inin-ternal factors consist of export marketing strategy (e.g. product, price, promo-tion, distribupromo-tion, service and networking strategies), firm characteristics (e.g. size, international experience, capabil-ities/competencies, industrial sector/product type, organi-zational culture, ownership structure, and production man-agement) and management characteristics (e.g. age, edu-cation, innovativeness, international exposure and export commitment). The external factors consist of foreign market characteristics (e.g. legal, political and economic systems, cultural similarity, market dynamics, customer and competi-tor behaviour) and domestic market characteristics (such as government export support and domestic business environ-ment).
Figure 1. Export Performance, a Conceptual Framework
Source: Sousa, Mart´ınez-L´opez, & Coelho (2008)
lacked a conceptual framework.
3. Data and Methods
3.1 Data
This study focuses on small-sized and medium-sized en-terprises (SMEs) and excludes micro-sized and large-sized enterprises.5 Among various definitions of firm by size, three definitions are widely used in Indonesia:
1. The Ministry of Cooperatives and SMEs defines SMEs as enterprises with assets valued at IDR50 million– IDR10 billion (equivalent to USD3,846.15–USD769, 230.77) or with an annual turnover of IDR300 mil-lion–IDR50 billion (equivalent to USD23,076.9–USD 3,846,153.8) (”Undang-undang No. 20 Tahun 2008 tentang Usaha Mikro Kecil dan Menengah[Law on Micro, Small and Medium-Sized Enterprise Number 20 of 2008].”, 2008).6
2. BPS-Statistics Indonesia (2014a) defines SMEs as enterprises with 5–99 employees.
3. The Ministry of Finance broadly classifies firm size into small business and non-small business (Ministry of Finance Republic of Indonesia, 2013). Small busi-ness refers to an enterprise with annual turnover of maximum IDR4.8 billion (approximately equivalent to USD369,230.8) while non-small business refers to an enterprise with annual turnover value of more than IDR4.8 billion.
During the pilot survey, we found that at the practi-cal level the identification of SMEs’ assets and turnover value was difficult, laborious and potentially inaccurate. SMEs’ asset valuation requires a complex appraisal method and SMEs’ turnover estimations are not always available due to the poor bookkeeping. Hence, this study refers to the definition of SMEs by number of employees (5 to 99) used by BPS-Statistic Indonesia. Despite its applicability, it is worth noting that this definition also has shortcomings. Most notably, the SME definition by number of employ-ees has potential bias towards capital-intensive industries. For example, this definition potentially includes some large-scale enterprises in capital-intensive industries that employ a small number of employees, but excludes medium-scale
5Micro enterprises are excluded for two reasons. First, the micro
enter-prises database is unavailable in Indonesia as they are mostly in the form of individual businesses or home industries. Second, micro enterprises are less likely to engage in international business (Pendergast, Sunje, & Pasic, 2008).
6The exchange rate is assumed at IDR13,000/USD.
enterprises in labour-intensive industries that employ large numbers of workers.
The total number of SMEs in Indonesia was estimated at 706,380 units in 2013 (Ministry of Cooperatives and SMEs Republic of Indonesia, 2015), approximately 60% of which are concentrated in only 3 islands; Jawa, Madura and Bali (Kuncoro, 2009; Wiratno & Dhewanto, Undated). This imbalanced SMEs’ distribution largely reflects the economic agglomeration pattern in Indonesia that causes economic activity to be largely concentrated in those three closely related islands. The three islands consist of only seven provinces and constitute only 7.07% of the country’s total land area but are inhabited by 57.5% of the country’s total population and generate over 58% of the country’s total GDP/value added (BPS-Statistics Indonesia, 2014b). Hence, the target population of this study is the SMEs that operate in seven provinces in Java, Madura and Bali islands. The three islands also have better transportation and commu-nication infrastructure than the rest of the country, allowing better access to survey a large number of SMEs that are spread throughout the islands within the time and budget constraints.
In order to construct the sample frame, we merged four different databases into one list of SMEs from which the samples were picked. The first three databases were pub-lished by the Ministry of Cooperatives and SMEs including: (1) the Ministry of Cooperatives and SMEs’ online trad-ing board7; (2)SME and Cooperative Indonesia Catalogue
(Ministry of Cooperatives and SMEs Republic of Indone-sia, 2011, 2012)8; and (3) Exporting SMEs Directory book (Ministry of Cooperatives and SMEs Republic of Indone-sia, 2009a)9. The fourth database is the Indonesian 2006 Economic Census provided by BPS-Statistics Indonesia.10
SMEs were drawn randomly from the sample frame and the survey targeted at least 385 samples (the total calcu-lated sample size) but the total sample size was expanded
7Online promotion at the website of the Ministry of Cooperatives ad
SMEs, http://www.indonesian-products.biz.
8The catalogue provides SMEs’ contacts and products description in
four languages (English, Arabic, Japanese and Indonesian). The catalogue is published annually as part of the ministry’s promotion program.
9The directory books listed all SMEs that participated in international
trade shows organised by the Ministry of Cooperatives and SMEs’ during 2005–2009.
10The BPS-Statistics Indonesia (National Agency for Statistics)
by approximately 25% to increase the sample sufficiency.11 The sample of SMEs was collected through a survey ques-tionnaire conducted in seven provinces in Jawa, Bali and Madura Islands during April-August 2014.12 During the survey period, 971 SMEs were contacted and approached, 522 of which were willing to participate in the survey (a response rate of 53.76%). A total of 497 responses were useable, and the remaining 25 responses were non-useable due to incomplete responses. The collected samples have a wide variation of export intensity, ranging from 0% (non-exporting SMEs) to 100% (SMEs whose entire products are exported).
Table 1.Sample Distribution by Province Province Count %
Banten 15 3.0
DKI Jakarta 100 20.1
Jawa Barat 39 7.8
Jawa Tengah 41 8.2
DI Yogyakarta 59 11.9
Jawa Timur 185 37.2
Bali 58 11.7
Total 497 100.0
Source: Author’s calculation based on survey data
Table 1 shows the distribution of the sample by province. A large number of responses were collected from Jawa Timur Province (185 SMEs, including Madura Island) and DKI Jakarta Province (100 SMEs). Both provinces are highly populated and industrialized. The remaining 212 re-spondents were distributed in the remaining five provinces (Banten, Jawa Barat, Jawa Tengah, DI Yogyakarta, and Bali).
Table 2 shows the distribution of surveyed SMEs by their products. Seventy-four SMEs produce more than one type of product (multi products) while the remaining 423 SMEs specialise in a specific type of product, with the largest number in handicrafts (91 SMEs) and the lowest number in machinery components (18 SMEs).
A set of structured questionnaires with close-ended questions were developed and translated intoBahasa In-donesia. Before the SME survey was administered, the questionnaire was piloted randomly to 25 SMEs in the Greater Jakarta region. The pre-test was carried out to
ob-11The population of SMEs in the study area (N) is approximated to
be around 423,828 (approximately 60% of the total Indonesian SME population of 706,380). Owing to this large size of the target population, the sample size (n) is not expected to exceed 5% of the population (less than 21,191 SMEs) due to time and budget constraints. Hence, the following sample size formula for an infinite population is appropriate (Anderson, Sweeney, & Williams, 2010; Crossley, 2008; Lee, Lee, & Lee, 1999):n=
(Z∝/2)σ
MOE 2
, where n is the sample size;ZZZ∝∝∝///222is the value of the two-sided
confidence interval in normal distribution,δrepresents the variation of the variable of interest andMOEis the desired margin of error. Assuming thatZZZ∝∝∝///222=1.96 (corresponds to a 95% confidence interval), response
distributionσ=0.5,MOE=0.05, and N = 423,828, the calculated sample size is 385. However, the sample size was increased by at least 20% (to at least a total sample of 461) to anticipate insufficiency and incomplete responses.
12Despite having 34 provinces, Indonesia’s economy is largely
concen-trated in seven provinces located in Jawa, Bali, and Madura Islands. As of 2013, the seven provinces generated over 58% of total GDP, inhabited by 57.5% of total population and populated by approximately 60% of total SMEs in Indonesia (BPS-Statistics Indonesia, 2014b).
Table 2.Sample Distribution by Product
Products Count %
Agricultural Products 31 6.2
Food & Beverages 56 11.3
Furniture 80 16.1
Handicrafts 91 18.3
Garments 69 13.9
Leather Products & Fashion Accessories 32 6.4
Household Utensils 27 5.4
Machinery Components 18 3.6
Other Products 19 3.8
Multi Products 74 14.9
Total by Export Status 497 100.0
Source: Author’s calculation based on survey data
tain feedback to improve the content of the questions and the instructions, clarity, and layout of the questionnaire. The pre-test also gave important feedback on the questionnaire translation from English toBahasa Indonesia. Response to the SME survey questions required a good knowledge of the enterprises’ operational activities and therefore the questionnaires were administered to SMEs’ owners or man-agers.
3.2 Estimation Method
Export performance is represented by export intensity, cal-culated as the ratio of export revenue to the total revenue (Bianchi & Wickramasekera, 2016; Calabr`o & Mussolino, 2013; Majocchi, Bacchiocchi, & Mayrhofer, 2005). Accord-ingly, a regression analysis is performed to estimate the determinants of SMEs’ export intensity. Table 3 describes the independent variables used to estimate SMEs’ export intensity and their expected signs (the hypothesized relation-ship between the independent variables and SMEs’ export intensity). In general, three groups of determinants are em-ployed: export-enhancing factors, export-inhibiting factors and SMEs’ characteristics (Shih & Wickramasekera, 2011). Export-enhancing factors or stimuli are crucial for SMEs to sustain and expand the export (post-export stage) (Acedo & Gal´an, 2011; Morgan & Katsikeas, 1997). We consider SME owners’ international exposure, external assistance, types of products, location and target markets as the factors that may enhance SMEs’ export intensity.
SME owners/managers’ international experience and exposure are expected to have a positive effect to SMEs’ export intensity. An internationally experienced manage-ment team has greater probability of building a business partnership with foreign distributors or buyers (Reuber & Fischer, 1997). Overseas living or working experiences positively correlate with information gathering or market intelligence (Williams & Chaston, 2004). A management team with international experience is also likely to have more personal contacts in foreign markets (Andersen, 2006). In our model, we use three variables to represent interna-tional exposure including overseas study experience ( Own-erStudyAbroad), overseas training or short courses experi-ence (OwnerTrainAbroad) and overseas work experience (OwnerWorkAbroad). In addition, we also consider own-ers/managers’ MNC or exporting firms work experience (OwnerWorkMNC) to have the same effect on export inten-sity as overseas work experience.
is expected to be enhanced by government export assis-tance (Demick & O’Reilly, 2000; Francis & Collins-Dodd, 2004; Shamsuddoha, Ali, & Ndubisi, 2009; Wilkinson & Brouthers, 2006). We useGovCentral Assistto represent various types of export assistance provided by central gov-ernment agencies. These include international trade fairs (international shows, exhibitions and expos), SME cata-logue publications, technical training (including specific production processes, packaging, logistics, or machinery aimed at specific markets), managerial training (such as business planning, marketing, cultural differences aware-ness, language skills and knowledge of export procedures), and financial support (including export financing, export insurance and export guarantees). In addition, we use Govt-Local Assistto represent various export assistance provided by provincial, municipal or regency government agencies. These include technical training, managerial training, grants of equipment, grants of capital, and trade fairs.
We expect assistance provision by external non-govern-mental actors in the network to positively affect SMEs’ probability to increase their export activities (Demick & O’Reilly, 2000; Levy, Berry, & Nugent, 1999; Zain & Ng, 2006; Zhou, Wu, & Luo, 2007). Hence,NonGovt Assist rep-resents financial, technical, managerial and promotional as-sistance received by SMEs from various non-governmental actors in the network. These include informal network sources (family, relatives, business associates and emigrant commu-nities) or formal non-governmental sources (including busi-ness chambers/ associations, SOEs and universities/research institutes).
SMEs are expected to have higher export intensity if they export to ASEAN markets (regardless of whether they also export to other markets), due to the ASEAN free trade agreement that took effect in 1992. Hence, we add Expor-tASEAN (whether ASEAN is one of SMEs’ destination markets), as an enhancing factor. We also add YearsExport-ing(number of years the SMEs have been exporting at the time of the survey) and hypothesise it to have a positive effect on export intensity. As SMEs accumulate export ex-perience, they also accumulate foreign market knowledge that might be crucial for export development (Ciszewska-Mlinaric, 2016).
We expect SMEs’ export intensity to correlate with type of product, despite the extant literature being not fully con-clusive on the direction of the relationship. It has been argued that SMEs have a better chance of increasing ex-port activities if they produce merchandise that is already demanded in foreign markets (buyer effect) and therefore many SMEs imitate the types of products (copying/imitation effect) (Wengel & Rodriguez, 2006). Conversely, it has been argued that product uniqueness can be one of SMEs’ sources of competitive advantage in foreign markets (Barney, 1991; Chatterjee & Wernerfelt, 1991). In our model, ProductXNa-tionalrepresents type(s) of product’s share in Indonesia’s total national non-oil and gas exports. We expect SMEs to have a higher export intensity if they produce a type of merchandise that is already among Indonesia’s main non-oil and gas exports.
We hypothesise that SMEs’ export intensity is affected by their location (province). We expect that SMEs which operate in a province with a large contribution to Indonesia’s
total non-oil and gas exports are more likely to have high export intensity. Geographical agglomeration of exporters allows positive externalities, mainly in information spill overs (Silvente & Gim´enez, 2007), and access to export related services/infrastructure (Freeman, Styles, & Lawley, 2012).
Beside export-enhancing factors, export-inhibiting fac-tors barriers are also crucial at the exporting stage (to sus-tain and expand exporting), despite of the opposite effect on the SMEs (Bilkey & Tesar, 1977; Leonidou, 2004; OECD-APEC, 2006). The export inhibiting factors are represented by the perceptions on the severities of various types of ex-port barriers. Section 3.3 discusses the 50 types of exex-port barriers that we used in the survey. We expect each type of export barrier to have negative correlations with SMEs’ export intensity. The more difficult SMEs perceive a type of export barrier, the less likely they have high export intensity. However, we first reduce the 50 export barrier items into a smaller number of variables underlying broader dimensions of export barriers using the Principal Component Analysis (see Section 3.3). The summated scales/factor scores for each extracted and retained factor/component are calculated and used as input data in the regression model.
Two firm characteristics are used in our export inten-sity model. Firm age is hypothesised to have a positive effect on export intensity (Brush, 2012). As SMEs accumu-late operational experience, they may accumuaccumu-late capital or creditworthiness and establish an administrative structure and decision-making process. In addition, the number of employees is expected to have a positive effect on export in-tensity. Employees are crucial when SMEs need to upgrade the product quality and meet foreign buyers’ requirements (Ottaviano & Martincus, 2011).
Our model also controls three owner characteristics (gender, age and education). Owners’ age and education are hypothesised to have positive correlations with export in-tensity (Cavusgil & Naor, 1987; Obben & Magagula, 2003). However, the relationship between gender and export in-tensity is still inconclusive. On the one hand, it has been argued that female owners are less encouraged to expand the business beyond the domestic market and are less likely to have international experience (Orser et al., 2010). On the other hand, Welch, Welch, & Hewerdine (2008) argue that female business owners have some gender-specific charac-teristics that may be valuable in export activities, such as patience, persistence, paying attention to detail and being passionate about the business.
Three explanatory variables that represent external as-sistance received by SMEs, namelyGovCentral Assist (ex-port assistance by central government agencies), GovtLo-cal Assist(export assistance by provincial, regency and mu-nicipal government agencies, andNonGovt Assist(export assistance by non-government agencies), deserves further attention. These variables may give rise to endogeneity prob-lem if the external actors (mainly the government agencies) tend to assist the performing SMEs (picking the winners). However, the exogeneity of those variables can be assumed because in our survey we observed that a large number of assistance were provided to SMEs with low export intensity (including non-exporting SMEs).
Table 3.Independent Variables for Export Intensity Estimation
Variables Description Priori Sign
Enhancing Factors
OwnerStudyAbroad SME owner’s overseas study experience, where 1 if SME owner ever studied overseas, 0 otherwise +
OwnerTrainAbroad SME owner’s training/short courses experience, where 1 if SME owner ever had training/short courses overseas, 0 otherwise
+
OwnerWorkAbroad SME owner’s overseas work experience, where 1 if SME owner previously worked overseas, 0 otherwise +
OwnerWorkMNC SME owner’s MNC/exporting firm work experience, where 1 if SME owner previously worked with MNC or exporting firms, 0 otherwise
+
GovCentral Assist 1 if SME received either promotional, business management, finance or production assistance from any central government agencies
+
GovtLocal Assist 1 if SME received technical or managerial training, grants or promotional assistance from any local (provincial, regency or municipal) government agencies
+
NonGovt Assist 1 if SME received any type of assistance from either business associations/chambers, universities/research institutes, private companies/SOEs, business partners/associates, family/relatives or Indonesian emigrant communities
+
ExportASEAN SME’s export destination, where 1 if SME exports to one or more ASEAN countries (regardless of whether the SME also exports to Non-ASEAN markets or not), 0 otherwise
+
YearsExporting Number of years the SME had been exporting at the time of the survey +
ProductXNational SME’s type(s) of product’s share in Indonesia’s total national non-oil and gas exports +
ProvinceXNational Province’s share in Indonesia’s total national non-oil and gas export +
Inhibiting Factors
Export Barriers Factor scores/summated scale of export barrier components/ dimensions resulting from the principal component analysis.
-SMEs Characteristics
FirmAge Number of years the firm has been operating by the time of the survey since the firm’s establishment +
TotalEmployee Total number of employees +
OwnerGender Owner’s gender, where 1 = male, 0 = female
+/-OwnerAge Owner’s age at the time of the survey +
OwnerEducation Owner’s educational attainment, where 1 = primary school or no formal education, 2 = junior or senior high school, 3 = college, diploma or vocational school, 4 = bachelor degree, 5 = postgraduate degree
+
equation:
E(EX INT ENi|Xi) =α+
n
∑
j=1βjST IMU LIi j
+ p
∑
k=1γkBARRIERSik
+ q
∑
l=1δlFIRMil+εi (1)
where EX INT ENi is firm i’s export intensity with
frac-tional/proportional values in the unit interval, i.e.EX INT ENi
∈[0,1];ST IMU LIi jis a vector of export stimuli;BARRIERSik
is a vector of export barriers;FIRMilis a vector of firm
char-acteristics; andεiis the error term. The notations n, p, and q
represent the total number of variables representing export stimuli, export barriers and firm characteristics, respectively. The symbolsα,β,γ, andδ represent the constant and the vector of coefficients for the export stimuli export barriers and firm characteristics, respectively.
Owing to the fractional nature of the target variable (ex-port intensity), OLS and binary logit regression models are not appropriate estimation methods (Papke & Wooldridge, 1993, 2008). OLS cannot ensure the predictions fall within the unit interval (within the 0–1 range). The log-odds ratio model requires adjustment for all observations taking on extreme values 0 and 1. Instead, we adopt a fractional logit model, which can overcome OLS and log-odds methods’ shortcomings in modelling proportion/fraction. Moreover, it allows for direct estimation of the desired fractional re-sponse variable and it only requires that the conditional mean be specified correctly to obtain consistent parameter
estimates, as follows:
(2)
E(EXINTEN|x) = exp(xβ)
1+exp(xβ)
=Λ(xβ)
whereΛ(.)denotes the logistic cumulative distribution func-tion of export intensity, specified byPi=P{EX INT ENi=
1|Xi;β}, and EX INT ENi∈[0,1], which differs from
bi-nary logit that limits y to values of 0 or 1. Accordingly, the maximum likelihood estimation technique (MLE) is not ap-propriate for a fractional logit model because it is not robust to distributional failure. Rather, the following quasi-MLE method is considered:
Li= N
∑
n=1EX INT ENnlnPn
+ N
∑
n=1(1−Yn)ln(1−Pn) (3)
3.3 Principal Component Analysis
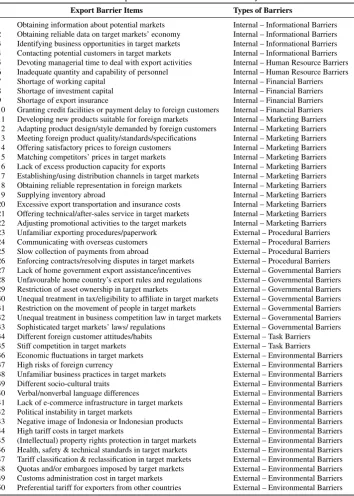
The export inhibiting factors are represented by the percep-tions on export barrier difficulties. We identify fifty specific export barrier types/items, previously developed by OECD-APEC (2006), Leonidou (2004) and OECD (2012). Table 4 shows the fifty export barrier items that we used in the survey and the typology of each item.
(response alternative 1), “difficult” (response alternative 2) to “very difficult” (response alternative 3).13
The three-point Likert-scale is used because during the pilot study the respondents had difficulties when given five-point and seven-five-point Likert-scale. Jacoby & Matell (1971) argued that three-point Likert scale are sufficient to cap-ture the variation of non-dichotomous response. In addition, Matell & Jacoby (1971) proved that the number of scale points are independent to the reliability and validity of the measurement.
The advantages and disadvantages of this type of un-balanced Likert-scale without mid-point neutral scale has been well addressed in the literature. The unbalanced scale points can cause biasedness if the questions are controver-sial or sensitive to the local socio-cultural or political norms, in which the respondents tend to give answers that are so-cially more acceptable (Garland, 1991; Johns, 2010). By contrast, the topic of this study is neither politically nor socio-culturally sensitive and during the pilot study the re-spondents showed a strong tendency to choose the neutral scale when the mid-point scale option is available. Hence, the three-point Likert scale without mid-point was used to force a choice without sacrificing the reliability, validity and unbiasedness principles.14
However, we first reduce the 50 export barrier items into a smaller number of variables underlying broader di-mensions of export barriers using the Principal Component Analysis (PCA). The summated scales/factor scores for each extracted and retained factor/component are calculated and used as input data in the regression model. Following the PCA procedure explained by Rencher (2012), Tuff´ery (2011), Abdi & Williams (2010) and PSU (2017), we can reduce the dimensions of export barriers as follows. We initially have a vector of 50 export barrier items:
(4)
B = (b1,b2,· · ·,b50)
The population variance-covariance matrix of the vector is given by:
var(B) =
∑
=
σ12 σ12 · · · σ150
σ21 σ22 · · · σ250 ..
. ... . .. ...
σ501 σ502 · · · σ50502 (5)
Consider the following linear relationships/equations:
Z1=a11b1+a12b2+· · ·+a150b50
Z2=a21b1+a22b2+· · ·+a250b50 ..
.
Z50=a501b1+a502b2+· · ·+a5050b50 (6)
Each of the relationships above can be viewed as a linear regression equation that predictsZifrom the export
barrier variablesb1,b2,· · ·,b50. Accordingly,ai1,ai2,· · ·,ai50 can represent the regression coefficients.
13For the use of a three point scale without a neutral scale in the survey
for export barrier survey questions, see OECD (2012).
14For the use of the three-point Likert-scale without a neutral
scale/mid-point, see OECD (2012).
Ziis random because it is a function of random variable
b1,b2,· · ·,b22. Hence, its population variance is given by:
var(Zi) =
50
∑
k=150
∑
l=1aikailσkl=A
0
i
∑
Ai (7)whereAiis a vector,Ai= (a1,a2,· · ·,a50). Consequently, Z˙i and Z˙j have the following population covariance:
cov(Zi,Zj) =
50
∑
k=150
∑
l=1aikajlσkl=A
0
i
∑
Aj (8)We aim to obtain the first principal component of export barriers (Z1), which is a linear combination of b-variables (barriers) and that has maximum variance among all lin-ear combinations. Maximum variance is required forZ1to explain as much export barriers variation as possible. To ob-tain a unique solution forZ1, we must define the regression coefficientsa11,a12,· · ·,a150that maximiseZ1’s variance:
var(Z1) = 50
∑
k=150
∑
l=1a1ka1lσkl=A
0
1
∑
A1 (9)Subject to the constraint that the sum of the squared coefficients is equal to 1:
A01A1= 50
∑
j=1a21j=1 (10)
This first principal component of export stimuli (Z1) retains the largest amount of variation in the sample.
Accordingly, to obtain the ith principal component of ex-port barriers (Zi), we must define the regression coefficients
ai1,ai2,· · ·,ai50that maximise Z˙i’s variance:
var(Zi) =
50
∑
k=150
∑
l=1aikailσkl=A
0
i
∑
Ai (11)Subject to the constraint that the sum of the squared coefficients is equal to 1:
A0iAi=
50
∑
j=1a2i j=1 (12)
We also add another constraint thatZiis uncorrelated
with all previously defined principal components of export stimuli. Formally:
cov(Z1,Zi) =
50
∑
k=150
∑
l=1a1kailσkl=A
0
1
∑
Ai=0cov(Z2,Zi) =
50
∑
k=150
∑
l=1a2kailσkl=A
0
2
∑
Ai=0.. .
cov(Zi−1,Zi) =
50
∑
k=150
∑
l=1ai−1,kailσkl=A
0
i−1
∑
Ai=0(13)
Table 4.Export Barrier Items Used in the Survey
Export Barrier Items Types of Barriers
B1 Obtaining information about potential markets Internal – Informational Barriers
B2 Obtaining reliable data on target markets’ economy Internal – Informational Barriers
B3 Identifying business opportunities in target markets Internal – Informational Barriers
B4 Contacting potential customers in target markets Internal – Informational Barriers
B5 Devoting managerial time to deal with export activities Internal – Human Resource Barriers
B6 Inadequate quantity and capability of personnel Internal – Human Resource Barriers
B7 Shortage of working capital Internal – Financial Barriers
B8 Shortage of investment capital Internal – Financial Barriers
B9 Shortage of export insurance Internal – Financial Barriers
B10 Granting credit facilities or payment delay to foreign customers Internal – Financial Barriers
B11 Developing new products suitable for foreign markets Internal – Marketing Barriers
B12 Adapting product design/style demanded by foreign customers Internal – Marketing Barriers B13 Meeting foreign product quality/standards/specifications Internal – Marketing Barriers
B14 Offering satisfactory prices to foreign customers Internal – Marketing Barriers
B15 Matching competitors’ prices in target markets Internal – Marketing Barriers
B16 Lack of excess production capacity for exports Internal – Marketing Barriers
B17 Establishing/using distribution channels in target markets Internal – Marketing Barriers
B18 Obtaining reliable representation in foreign markets Internal – Marketing Barriers
B19 Supplying inventory abroad Internal – Marketing Barriers
B20 Excessive export transportation and insurance costs Internal – Marketing Barriers
B21 Offering technical/after-sales service in target markets Internal – Marketing Barriers B22 Adjusting promotional activities to the target markets Internal – Marketing Barriers
B23 Unfamiliar exporting procedures/paperwork External – Procedural Barriers
B24 Communicating with overseas customers External – Procedural Barriers
B25 Slow collection of payments from abroad External – Procedural Barriers
B26 Enforcing contracts/resolving disputes in target markets External – Procedural Barriers
B27 Lack of home government export assistance/incentives External – Governmental Barriers
B28 Unfavourable home country’s export rules and regulations External – Governmental Barriers
B29 Restriction of asset ownership in target markets External – Governmental Barriers
B30 Unequal treatment in tax/eligibility to affiliate in target markets External – Governmental Barriers B31 Restriction on the movement of people in target markets External – Governmental Barriers B32 Unequal treatment in business competition law in target markets External – Governmental Barriers
B33 Sophisticated target markets’ laws/ regulations External – Governmental Barriers
B34 Different foreign customer attitudes/habits External – Task Barriers
B35 Stiff competition in target markets External – Task Barriers
B36 Economic fluctuations in target markets External – Environmental Barriers
B37 High risks of foreign currency External – Environmental Barriers
B38 Unfamiliar business practices in target markets External – Environmental Barriers
B39 Different socio-cultural traits External – Environmental Barriers
B40 Verbal/nonverbal language differences External – Environmental Barriers
B41 Lack of e-commerce infrastructure in target markets External – Environmental Barriers
B42 Political instability in target markets External – Environmental Barriers
B43 Negative image of Indonesia or Indonesian products External – Environmental Barriers
B44 High tariff costs in target markets External – Environmental Barriers
B45 (Intellectual) property rights protection in target markets External – Environmental Barriers B46 Health, safety & technical standards in target markets External – Environmental Barriers B47 Tariff classification & reclassification in target markets External – Environmental Barriers
B48 Quotas and/or embargoes imposed by target markets External – Environmental Barriers
B49 Customs administration cost in target markets External – Environmental Barriers
B50 Preferential tariff for exporters from other countries External – Environmental Barriers Source: OECD-APEC (2006), Leonidou (2004), OECD (2012)
The next step is to determine the number of components to retain. We will use the Kaiser Criterion for component retention. This criterion dictates that we retain all compo-nents whose variance is greater than that of the variables analysed (with eigenvalues larger than 1.0). We also require that the retained components account for at least 50% of the export stimuli variation.15The retained components can be interpreted as the broad dimensions/typology of export barriers for our survey data.
4. Results
15For a more thorough discussion on component retention criteria, see
for example Hubbard & Allen (1987) or Tuff´ery (2011).
4.1 Descriptive Statistics
The survey asked the exporting SME respondents to in-dicate their export intensity (i.e. the share of export sales in the firms’ total sales). The average export intensity is 0.4101 (41% of total revenue is received from export rev-enue). However, Table 5 shows that export intensity differs across firm category, owners’ gender and education level and SMEs’ province location.
Table 5 shows that SMEs with male owners on average exhibit higher export intensity than those with female own-ers. However, the difference in export intensity is not statis-tically significant. Likewise, the medium-sized enterprises’ average export intensity is slightly higher than small-sized enterprises but the difference in export intensity between the two firm categories is not statistically significant.
Table 5.Export Intensity, by Firm and Owner Characteristics
Categories N Mean Std. Deviation Mean Difference test
Firm Category
Medium Enterprises 173 0.4198 0.33109 t = 0.663
Small Enterprises 98 0.3930 0.30105
Owner’s Gender
Male 203 0.4233 0.32891 t = 1.245
Female 68 0.3707 0.29160
Owner’s Education Level
College or higher 187 0.4370 0.31540 t = 2.071**
High school or lower 84 0.3504 0.32475
Province
DI Yogyakarta 53 0.6119 0.32074 F = 13.226***
Jabar 19 0.5695 0.39042
Bali 43 0.5537 0.28557
Banten 11 0.2636 0.20260
Jateng 13 0.4308 0.33074
Jatim 76 0.2809 0.26280
DKI Jakarta 56 0.2541 0.22842
Note: The equal variance assumption was checked with Levene’s test prior to the t-test Source: Author’s calculation based on the survey data
education on average exhibit higher export intensity than those whose owners are high school graduates or with lower levels of education. The t-test value (significant at the 5% level) indicates that export intensity significantly differs across SME owners’ education level. SMEs’ export inten-sity also varies significantly by provinces (the ANOVA test value is significant at the 1% level). Exporting SMEs in DI Yogyakarta (a small province and important tourist desti-nation) have higher average export intensity than SMEs in the other six provinces. In contrast, SMEs in DKI Jakarta (a large and industrialized province) exhibit the lowest average export intensity.
4.2 Export-Inhibiting Factors
Principal component analysis (PCA) was performed on the survey responses for the 50 export barrier items’ Likert scale questions to reduce the dimensions of the items into a smaller number of variables (principal components) that may represent a broader dimension of export barriers. The correlation matrix indicates that 981 of 990 correlation val-ues (99.1%) are significant at the 5% level and the Bartlett’s Test of Sphericity is significant at the 1% level, both of which indicate the appropriateness of PCA for the export barrier survey data. The KMO test value of 0.906 and the minimum sample adequacy (MSA) value for each export stimuli item (all above 0.60) indicate the adequacy of overall and individual items’ sample size.
The PCA factor extraction was estimated five times which resulted in 45 retained export barrier items. Five ex-port barrier items were eliminated from the analysis because the initial PCA factor extraction results showed that they ei-ther had a low level of communalities (below 0.40), showed cross-loadings problems or had insignificant factor loadings (below 0.40). The PCA extracted all factors with latent root criterion (eigenvalues) that exceeded 1 (i.e. no certain num-ber of factors was specified to be extracted). The PCA gave an eleven-factor solution factors that explain 59.703% of the total variance.
Table 6 shows the rotated component matrix and the eleven extracted factors. Based on the export barrier items
that have high loadings on each factor, the eleven factors that represent eleven dimensions of export barriers are named as follows: tariff and non-tariff barriers in host countries, informational and human resources barriers, distribution, logistics and promotional barriers, business environment barriers in host countries, product and transaction barriers, financial barriers, foreign government barriers, procedural barriers, price barriers, home government barriers, and for-eign customer and competitor barriers, respectively. Hence, we have eleven variables to represent export barriers/export inhibiting factors, named as follows:Barrier Tariff, Bar-rier Human,Barrier Distribution,Barrier ForeignEnviro,
Barrier Product,Barrier Financial,Barrier ForeignGovt,
Barrier Procedur,Barrier Price,Barrier HomGovt, Bar-rier Customer. The data series for each export barrier vari-able is obtained from PCA’s factor scores and calculated with the Regression Score method.16
4.3 Estimation Results
We estimate SMEs’ export intensity with two regression models: Generalized Linear Model (GLM)-fractional logit regression and least square regression (OLS). The OLS regression method is applicable because the dependent vari-able (export intensity) is a continuous varivari-able. However, since the export intensity is double-bounded (has a min-imum value of 0 and a maxmin-imum value of 1), the OLS regression method may not give the best estimators. Papke & Wooldridge (1993) proposed the fractional logit regres-sion model – a GLM estimation procedure to model pro-portion/fractional outcome.17However, the fractional logit model performs better and has more meaningful interpre-tations if there are observations with extreme values of the
16Factor scores can be calculated with non-refined methods (Sum Scores
or Summated Scales) and refined methods (e.g. Regression Scores, Bartlett Scores, Anderson-Rubin Scores) (DiStefano, Zhu, & Mindrila, 2009). We used the Regression Score method to calculate the factor scores for the eleven variables that represent export barriers. However, we also simulated the factor score calculation with two other refined methods (Bartlett Scores and Anderson-Rubin Scores) and obtained very similar results.
17For further discussion on fractional regression, see Baum (2008) and
Table 6.Rotated Component Analysis Factor Matrix of Export Barrier Items
Component
1 2 3 4 5 6 7 8 9 10 11
Customs administration cost in target markets 0.698 Quotas and/or embargoes imposed by target markets 0.663 Preferential tariff for exporters from other countries 0.62 Tariff classification & reclassification in target markets 0.568 Unfamiliar business practices in target markets 0.45 Health, safety & technical standards in target markets 0.418 Obtaining information about potential markets 0.753 Obtaining reliable data on target markets’ economy 0.746 Contacting potential customers in target markets 0.567 Devoting managerial time to deal with internationalization 0.552 Identifying business opportunities in target markets 0.549 Inadequate quantity and capability of personnel 0.532
Obtaining reliable foreign representation 0.644
Offering technical/after-sales service in target markets 0.627
Supplying inventory abroad 0.623
Establishing/using distribution channels in target markets 0.598 Adjusting promotional activities to the target markets 0.55 Excessive export transportation/insurance costs 0.511
Economic fluctuations in target markets 0.75
High risks of foreign currency 0.606
High tariff costs in target markets 0.511
Political instability in target markets 0.503
(Intellectual) property rights protection in target markets 0.477 Adapting product design/style to foreign customers’ demand 0.781
Developing new products for foreign markets 0.773
Meeting foreign product quality/standards/specifications 0.546
Lack of e-commerce infrastructure in target markets 0.51
Shortage of investment fund 0.791
Shortage of working capital 0.781
Shortage of export insurance 0.594
Granting credit facilities/payment delay to foreign customers 0.538 Unequal treatment in tax/affiliation eligibility in target markets 0.739
Restriction of asset ownership in target markets 0.636
Unequal treatment in business competition in target markets 0.618
Sophisticated target markets’ laws/ regulations 0.462
Slow collection of payments from abroad 0.698
Communicating with overseas customers 0.574
Unfamiliar exporting procedures/paperwork 0.554
Enforcing contracts/resolving disputes in target markets 0.467
Offering satisfactory prices to foreign customers 0.832
Matching competitors’ prices in target markets 0.798
Lack of home government export assistance/incentives 0.795
Unfavourable home country’s export rules and regulations 0.747
Different foreign customer habits/attitudes 0.64
Stiff competition in target markets 0.6
Extraction Method: Principal Component Analysis. Rotation Method: Varimax with Kaiser Normalization. Rotation converged in 9 iterations.
Extraction Method: Principal Component Analysis. Rotation Method: Varimax with Kaiser Normalization. Rotation converged in 9 iterations.
dependent variable –i.e. the export intensity of 0 (no export) and 1 (100% of the products are exported) (Baum, 2008). Hence, we included the non-exporting SMEs’ observations (with zero export intensity) in our estimation.18
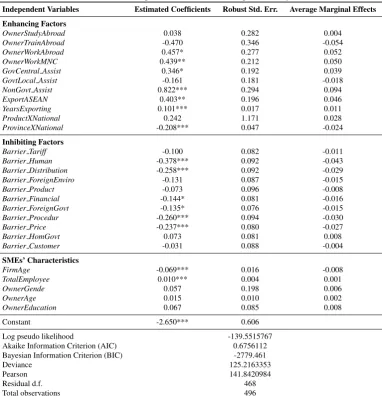
Table 7 gives the estimation results of the fractional logit regression. The heteroscedasticity-consistent (robust) standard errors are used to ensure asymptotically valid in-ferences. The Log pseudo likelihood value of -139.5515767 suggests that the model including the explanatory variables is a significantly better fit than the null model. In other words, the 27 explanatory variables employed in the models significantly improve the baseline model that only includes the constant. Table 8 gives the estimation results of the OLS regression. The R-square and the Adjusted R-square val-ues indicate that more than 50% of the variance in export intensity can be predicted by the explanatory variables in the model. The F-value indicates that the model is signifi-cant, i.e. the 27 explanatory variables together can reliably predict the export intensity. No multicollinearity problem is
18Wengel & Rodriguez (2006) argue that it is reasonable to treat
non-exporting SMEs as SMEs that intend to export zero percent of their product.
detected as indicated by VIF values that are close to one for each explanatory variable.
In short, both fractional logit and OLS regression mod-els are appropriate to estimate the export intensity of the surveyed SMEs in our study. In addition, there are high de-grees of consistency/ similarity in the estimated coefficients of the explanatory variables from fractional logit and OLS regressions. Thirteen explanatory variables are statistically significant in both estimations:OwnerWorkAbroad, Owner-WorkMNC,NonGovt Assist,ExportExperience, ProvinceX-National,Barrier Human,Barrier Distribution,Barrier Financial,Barrier ForeignGovt,Barrier Procedur,Barrier Price,FirmAge, and TotalEmployee. Furthermore, those thirteen variables have the same signs in both estimations despite different values of estimated coefficients. The esti-mation results of the two models only differ in two variables that are significant only in fractional logit estimation ( Gov-Central AssistandExportASEAN) and one variable that is significant only in OLS estimation (OwnerAge).
Tobit models. Hence, we use the fractional logit estimation results as our main reference for further analysis. Table 6.5 gives the marginal effect of each explanatory variable from fractional logit estimations.
With respect to SME owners’ international exposure,
OwnerStudyAbroadandOwnerTrainAbroadare not statis-tically significant while OwnerWorkAbroad and Owner-WorkMNCare significant. Owners’ overseas work expe-rience positively influences SMEs’ export intensity at the 10% significance level. SMEs whose owners have worked abroad on average have a 5.2% higher export intensity than SMEs whose owners have no such experience, all else being equal. Owners’ MNC/exporting firm work experience also positively influences export intensity (significant at the 5% level). SMEs whose owners have previous work experience in MNC/exporting firms on average have 5% higher export intensity than SMEs whose owners have no such experience, other things held constant. Work experience in international environments allows SME owners to build cross-border professional networks and acquire international business skills, which in turn may positively correlate with export expansion (Ruzzier et al., 2007).
The estimated coefficient of ProvinceXNational is nega-tive and significant at the 1% level despite the small mag-nitude of the marginal effect. SMEs that operate in the provinces that have large shares in Indonesia’s national ex-ports tend to have low export intensity, and vice versa. This finding is in line with the negative impact of the province’s contribution to national exports on SMEs’ probability to ex-port model discussed in Section 6.1. SMEs that are located in the province where there are already large numbers of exporters, trading companies or agents may consider sell-ing their products to local exporters to avoid the risk of exporting (Gereffi, 1994; Hessels & Terjesen, 2010).
The estimated coefficient of ProductXNational is in-significant. SMEs’ type of product has no significant effect on export intensity. Although SMEs that produce the types of merchandise that correspond to Indonesia’s main export commodities have high probability to become exporters through “buyer effect” and “copying/imitation effect” (Wen-gel & Rodriguez, 2006), those two effects do not give SMEs the advantage for export expansion. Central government as-sistance positively affects SMEs’ export intensity. GovCen-tral Assistis positive and significant at the 10% level. SMEs that receive promotional assistance (including trade expos, trade fairs, trade shows and SME catalogues), assistance in business management (e.g. managerial training), assistance in finance or assistance in production (e.g. production tech-niques or equipment) from any central government agencies on average have a 3.9% higher export intensity than those who were not recipients. However,GovtLocal Assistis not statistically significant. Technical training, managerial train-ing, grants of equipment, grants of capital and trade fairs provided by provincial, municipal or regency governments have no significant effect on SMEs’ export intensity. Local government assistance is possibly export assistance in name, but actually general business assistance with which SMEs can be more competitive in domestic markets, as opposed to central government agencies’ assistance that has strong international market orientation (Uchikawa & Keola, 2008). The estimated coefficient of NonGovt Assist is
posi-tive and significant at the 1% level, which implies that the assistance provision by non-government sources has a positive influence on SMEs’ export intensity. SMEs that receive financial, technical, managerial and promotional as-sistance from various non-governmental networking sources including informal sources (family, relatives, business as-sociates and overseas Indonesian emigrant communities) and formal non-governmental sources (including business chambers/associations, SOEs and universities/research insti-tutes) on average have a 9.4% higher export intensity than non-recipient SMEs. Hence, network relationships with non-government sources not only help SMEs to become exporters but also to expand their international business activities (Zhou, Wu, & Luo, 2007).
Export intensity is also determined by SMEs’ export destination.ExportASEANpositively affects export inten-sity at the 5% significance level. On average, SMEs whose destination markets include any ASEAN country have a 4.6% higher export intensity than SMEs that do not export to ASEAN markets. This is probably due to the ASEAN free trade area that took effect in 1992 that allows SMEs to expand the exports within the ASEAN market.19
The estimated coefficient ofYearsExportingis statis-tically significant at the 1% level. The longer the SMEs have been exporting, the higher the export intensity. On average, one additional year of exporting correlates with a 1.1% higher export intensity, all else being equal. As SMEs accumulate export experience, they also accumulate foreign market knowledge that is crucial to expand their exports (Ling-Yee, 2004).
Of the eleven variables that represent export-inhibiting factors, six variables have significant effects on SMEs’ ex-port intensity:Barrier Human,Barrier Distribution, Bar-rier Financial,Barrier ForeignGovt,Barrier Procedur, and
Barrier Price. However, those variables are composite vari-ables obtained from PCA’s factor extraction and the data series for each barrier is measured by perceived difficulties with the Likert-scale method. Hence, the estimated coeffi-cients, marginal effects and odds ratio of those variables are not too insightful for interpretation. Rather, we focus on the estimated signs of the coefficients that indicate the direction of the effect of perceived export barriers on SMEs’ export intensity. As expected, the estimated coefficients of those six variables are negative, which implies that the more difficult SMEs perceive those barriers, the lower the export intensity. SMEs are constrained in expanding their exports if they perceive high difficulties in informational and human resource barriers, distribution, logistics and promotional barriers, financial barriers, foreign government barriers, pro-cedural barriers and price barriers. In contrast, the estimated coefficients ofBarrier Tariff,Barrier ForeignEnviro, Bar-rier Product,Barrier HomGovt, andBarrier Customerare not statistically significant. Hence, SMEs that perceived tariff and non-tariff export barriers in host countries, busi-ness environment barriers in host countries, product and transaction barriers, home government barriers and foreign customer and competitor barriers as difficult barriers do not
19The survey was conducted in 2014. Therefore, the results may reflect
Table 7.Fractional Logit Estimates for SMEs’ Export Intensity Model
Independent Variables Estimated Coefficients Robust Std. Err. Average Marginal Effects
Enhancing Factors
OwnerStudyAbroad 0.038 0.282 0.004
OwnerTrainAbroad -0.470 0.346 -0.054
OwnerWorkAbroad 0.457* 0.277 0.052
OwnerWorkMNC 0.439** 0.212 0.050
GovCentral Assist 0.346* 0.192 0.039
GovtLocal Assist -0.161 0.181 -0.018
NonGovt Assist 0.822*** 0.294 0.094
ExportASEAN 0.403** 0.196 0.046
YearsExporting 0.101*** 0.017 0.011
ProductXNational 0.242 1.171 0.028
ProvinceXNational -0.208*** 0.047 -0.024
Inhibiting Factors
Barrier Tariff -0.100 0.082 -0.011
Barrier Human -0.378*** 0.092 -0.043
Barrier Distribution -0.258*** 0.092 -0.029
Barrier ForeignEnviro -0.131 0.087 -0.015
Barrier Product -0.073 0.096 -0.008
Barrier Financial -0.144* 0.081 -0.016
Barrier ForeignGovt -0.135* 0.076 -0.015
Barrier Procedur -0.260*** 0.094 -0.030
Barrier Price -0.237*** 0.080 -0.027
Barrier HomGovt 0.073 0.081 0.008
Barrier Customer -0.031 0.088 -0.004
SMEs’ Characteristics
FirmAge -0.069*** 0.016 -0.008
TotalEmployee 0.010*** 0.004 0.001
OwnerGende 0.057 0.198 0.006
OwnerAge 0.015 0.010 0.002
OwnerEducation 0.067 0.085 0.008
Constant -2.650*** 0.606
Log pseudo likelihood -139.5515767
Akaike Information Criterion (AIC) 0.6756112
Bayesian Information Criterion (BIC) -2779.461
Deviance 125.2163353
Pearson 141.8420984
Residual d.f. 468
Total observations 496
Note: (*), (**), and (***) represent 10%, 5%, and 1% significance levels, respectively Marginal effects are calculated as overall average marginal effects
Source: Author’s calculation based on the survey data
exhibit different export intensity from SMEs that perceive them as less serious barriers. These findings are consistent with studies by the OECD (2008) and the OECD (2009) that argued that export barriers are crucial not only in SMEs’ pre-exporting stage, but also at the exporting stage in which SMEs attempt to expand their exports (increase their export intensities), and that the level of difficulties/severities vary across types of barriers.
Two variables that represent firm characteristics ( Fir-mAgeandTotalEmployee) have statistically significant esti-mated coefficients. Total number of employees positively affects export intensity at the 1% significance level. On av-erage, one additional employee correlates with 0.1% higher export intensity. The number of employees represents firm size and economies of scale that are required for product and export expansion (Majocchi et al., 2005). Interestingly,
FirmAgehas negative and significant estimated coefficient. On average, one additional year of firm age correlates with 0.8% lower export intensity. One possible explanation is that the export sales grow at a slower pace than the domes-tic sales. Consequently, the share of export revenue in total revenue decreases over time despite not necessarily being
lower in absolute value of export sales. On the one hand, this reaffirms that at the exporting stage SMEs face serious challenges to expand their exports. On the other hand, this may indicate that the exporting SMEs may also have es-tablished business in domestic markets and therefore have more solid domestic revenue growth.
5. Conclusions
5.1 Summary and major findings
SMEs are less able to take advantage of foreign market opportunities than larger enterprises, as indicated by the marginal contribution to Indonesia’s exports. This study investigates the internationalization of Indonesian SMEs, particularly their direct-export activities at the post-export stage. More specifically, this study identifies the main fac-tors that determine SMEs’ export performance, measured by export intensity -the ratio of export revenue over total revenue.