STUDY OF FLUORIDE LEVEL IN THE GROUND WATER OF ALAGILAT CITY, LIBYA: CORRELATION WITH PHYSICOCHEMICAL PARAMETERS
7
0
0
Full text
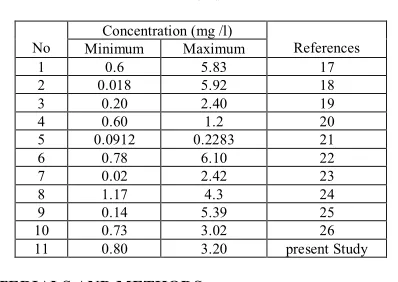
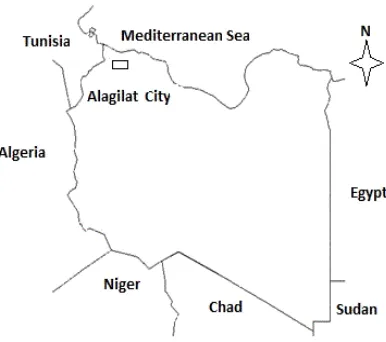
(2) Fathi M. Elmabrok . Int. Res. J. Pharm. 2015, 6 (9) summer. Ground water is considered the main source of water supply. The dominant soils are entisols and aridisols. Furthermore, the level of fluoride in the ground water of this area has not been measured before. The present study has undertaken to analyze the fluoride content and physic- chemical characters of ground water in the study area. A total of 65 ground water samples were collected in February 2013 from 26 villages of Alginate city, Libya. The samples were collected from public wells, private wells, water sources in the health centers, and schools. First, the water was left to run for few minutes from the wells to pump out the standing water before taking the final samples. The samples were collected in pre cleaned sterilized polyethylene. plastic bottles of 1L capacity then the samples were placed in clean containers and immediately put in ice boxes. The ice boxes were shipped to Syracuse, Italy where the fluoride was analyzed in the laboratories of Ecocontrol Sod Company. The concentration of fluoride was determined in terms of mg L-1. The standard permissible value of fluoride according to 3, 5, 18, 27 are given in table 2. Other physic- chemical parameters were also analyzed such as pH, electrical conductivity (EC), Calcium (Ca), Magnesium (Mg), Potassium (K), Sulfate (SO4), Phosphate (PO4), Chloride (Cl), and Calcium bicarbonate (Ca(HCO3)2). All analysis including fluoride were analyzed in the laboratories of Ecocontrol Sud Company, Italy where standard techniques were used (Table 3). Table 2: Limits of Fluoride Concentration (mg /l) Standard Libyan standard European standard WHO 2004 APHA. Minimum concentration 1 0.7 0.7 0.7. Maximum concentration 1.5 1.5 1.5 1.5. Table 3: Standard Methods and Equipments used to analyze the Parameters Parameter Test method Equipment Ca EPA 6010C : 2007 ICP-OES*** ICP-OES Mg EPA 6010C : 2007 K EPA 6010C : 2007 ICP-OES Na EPA 6010C : 2007 ICP-OES Cl UNI EN ISO 10304 – 1 : 2009 IC ** F UNI EN ISO 10304 – 1 : 2009 IC PO4 UNI EN ISO 10304 – 1 : 2009 IC SO4 UNI EN ISO 10304 – 1 : 2009 IC EC ------------------------------------------------EC-meter model 470* pH ------------------------------------------------pH-meter model 370* ***Inductively coupled plasma optical emission spectrometry, **Ion chromatography,* measured in the field. RESULTS AND DISCUSSION The ground water samples collected from sixty five wells of Alagilat city, Libya Figure 1. All results obtained of the samples were compiled and presented in figures from 2 to 11 parameter wise. Fluoride concentration in this study is depicted in Figure 2. Fluoride concentration in the study area varied from 0.8 to 3.2mg/l with an average of 2.04mg/l. Out of 56 samples above 1.5mg/l fluoride. (above the recommended value set by the world health organization) is 86.15% and between 0.6 mg/l to 1.5 fluorides is 13.84 %. Fluoride showed positive correlation with sulfate in Figure 12. Phosphate showed positive correlation with fluoride. Correlation coefficient is 0.392 and chloride showed positive correlation with fluoride and the coefficient correlation is 0.315.. 617.
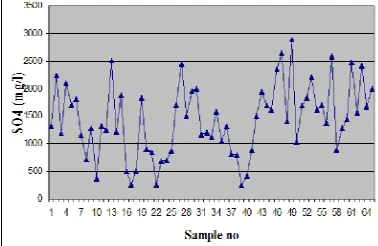
(3) Fathi M. Elmabrok . Int. Res. J. Pharm. 2015, 6 (9) The correlation of some selected ions and other elements with fluoride are shown in Figures 11, 12 and 13. The ions of Ca, K and Na showed positive correlation with fluoride levels. The correlation coefficients were 0.579, 0.122, and 0.323 respectively. The positive correlation of fluoride with Ca and K may be due to low solubility of fluorides of these cations 27. However, it was reported positive correlation of fluoride with Ca in the ground water. The positive correlation is noticed by those authors may be attributed to the presence of lime stone in those areas 28. Fluoride showed positive correlation with sulphate in figure 12. Phosphate showed positive correlation with fluoride and the correlation coefficient is 0.391 and chloride showed positive correlation with fluoride and the correlation coefficient is 0.315. Mg and pH negatively correlated with fluoride and the correlation coefficients are -0.17 and -0.05 respectively Figures 11 and 13. The pH values varying from 6.9 to 7.7 Figure 3. The permissible limit of pH in drinking water is 6.5 to 8.5 Libyan standards 29. Maximum pH value was found in well number 25 and the minimum value was found in sample number 19. The pH of the water samples is alkaline it is may be due to high calcite in the study area. The electrical conductivity varying from1.32ms/ cm at 25C to 10.68 ms/ cm at 25 oC figure 3. All samples showed EC below the permissible limit for drinking water (300mohs) as per Libyan standard 29. Maximum value was found in well number 19 which was 10.68 and the minimum one was 1.32 in the well number39. The electrical conductivity is positively correlated with fluoride and the correlation coefficient is 0.343 Figure 13. The sulphate concentration is varied from 244 to 2893mg/l Figure 4. The ground water samples analyzed showed higher concentrations of sulfate than the prescribed permissible limits for drinking water. The Libyan permissible limit of sulfate is 400 mg/l. The maximum level of sulfate was recorded at the well number 29 of the study area while. the minimum one 244 mg/l was observed in well number 39. Sulfate showed Strong correlation with Ca and Na and weak positive correlation with K. The variation of phosphate is shown in Figure 5. The Phosphate concentration is varied from 0.2 to 0.44 mg/l. The maximum level of the phosphate is found in the sample number 19 and the minimum one was 0.2mg/l in the sample number 32. In the most of the ground water samples the chloride concentration is above the maximum Libyan permissible limit of drinking water (25mg/l). The range of chloride content is varied from 236 to 3443 mg/l. The maximum content was found in the well number 19 and the minimum value was noticed in the well number22 Figure 6. The level of calcium varied from 80.80 to 944 mg/ l. The highest value of calcium ion was found in the well number 63 and the lowest one was found in the well number 19 Figure 7. The Libyan permissible limit of calcium is 200 mg/ l. The level of Magnesium is from 3.4mg/l to 3040 mg/ l. The maximum value was found in sample number 22 and the minimum one was recorded in the sample number 39. All Mg concentrations were above the limit recommended by the Libyan government 29. The variation of potassium is shown in Figure 9. The potassium concentration is varied from 6.3 to 223.6 mg/l. The maximum level of the potassium is found to be 223.6 mg/l in the sample number 9 and the minimum one was 6.3mg/l in the sample number 22. Whereas, sodium ranged between 122.6 and 1678 mg/l the maximum value was noticed in the sample number 19 while the minimum one was found in the sample number 39 Figure 10.. Figure 2: Concentration of fluoride in the water samples (dotted line is the permissible limit). Figure 3: The levels of EC and pH in the ground water samples. Figure 4: Concentration of SO4 in the ground water samples. 618.
(4) Fathi M. Elmabrok . Int. Res. J. Pharm. 2015, 6 (9). Figure 5: Concentration of PO4 in the ground water samples. Figure 6: Concentration of Cl in the ground water samples. Figure 7: Concentration of Ca in the ground water samples. Figure 8: Concentration of Mg in the ground water samples. Figure 9: Concentration of K in the ground water samples Figure 10: Concentration of Na in the ground water samples. 619.
(5) Fathi M. Elmabrok . Int. Res. J. Pharm. 2015, 6 (9). Figure 11: Correlation of the cations with fluoride concentration in the ground water samples. Figure 12: Correlation of some anions with fluoride concentration in the ground water samples. 620.
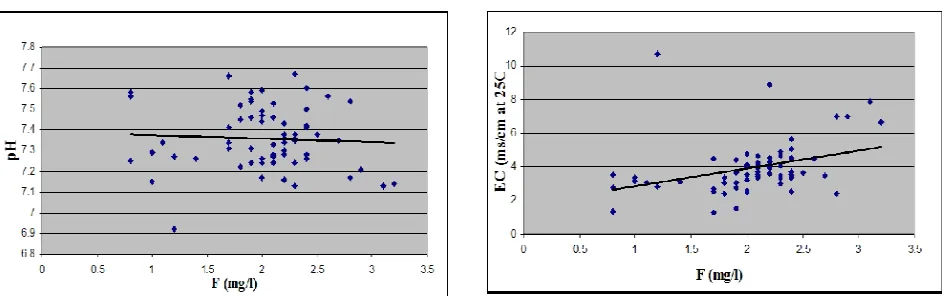
(6) Fathi M. Elmabrok . Int. Res. J. Pharm. 2015, 6 (9). Figure 13: Correlation of pH and EC with fluoride concentration in the ground water samples. ACKNOWLEGDEMENT The author sincerely wishes to thank the Libyan authority for Research, science and Technology for the sponsorship. REFERENCES 1. Deshmukh AN, Shah KC & Sriram A, Coal Ash : A source of Fluoride pollution, A case study of Koradi Thermal Power Station, District Nagpur, Maharashtra. Gondwana Geological Magazine, 1995; 9: 21 – 29. 2. Farooqi, A., Masuda, H. and Firdous, N, Toxic fluoride and arsenic contaminated ground water in the Lahore and Kasur districts, Punjab, Pakistan and possible contaminant sources. Environmental pollution, 2007; 145: 839 – 849. http://dx.doi.org/10.1016/j.envpol.2006.05.007 3. Kudesia, V.P, Environmental Chemistry. Pragati Prakashan, Meerut, 2003; 2nd ed.pp 145 – 148 4. Rao S, Fluoride in ground water, Varaha River Basin, Visakhapatnam District, Andhra Pradesh, India. Environmental Monitoring and Assessment, 2009; 61(3) 387 – 398 http://dx.doi.org/10.1023/A:1006165615097 5. Anderson MA, Zelazny LWM & Bertsch PM, Fluoro – complexes on model and soil exchangers. Crop Science Society of America Journal, 1991: 55 (1) 71 – 75. http://dx.doi.org/10.2136/sssaj1991.03615995005500010012x 6. Tailor GS & Chandel CPS, To assess the Quality of Ground Water in Malpura Tehsil (Tonk – Rajasthan, India) with emphasis to fluoride concentration. Nature and Science, 2010; 8(11) 20 – 26. 7. Short, H. E., G. R., Mc Robert, T.W., Bernard and Mannadinayar, A.S, Endemic fluorosis in the Madras Presidency. Indian Journal of Medical Research, 1937; 25, 553 – 561. 8. Abdulrahmani, A, Fluoride content in drinking water supplies of Riyadh, Saudi Arabia, Environmental Monitoring and Assessment. 1996; 48: 261 – 272 9. Jenkins, G.N, the Physiology and Biochemistry of the Mouth, Blackwell Science Publications, London, 1978; pp: 466. 10. Ceopalan, C, The changing Epidemiology of Malnutrition in Developing Society. Current Science, 2003; 77, p.1257 11. Edmunds M. & Smedley P, Fluoride in natural waters – occurrence, controls and health aspects. Essentials of Medical Geology (ed. O. Selinus, B. Alloway, J,A. Centeno, R.B. Finkelman, R. Fuge, U. Lindh & P. Smedley) pp. 301 – 329. Elsevier, Amsterdam, 2010; the Netherkands 12. Chandrajith R., Abeypala U., Dissanayake C.B. & Tobschall H.J, Fluoride in Ceylon tea and its implications to dental health. Environmental Geochemistry and Health, 2007; 20: 429 – 434 http://dx.doi.org/10.1007/s10653-007-9087-z. 13. Grimaldo, M., V.H. Borja – Aburto, A.L. Ramirez, M. Ponce, M. Rosas and F. Diaz – Barrige, Endemic fluorosis in San Luis Potosi, Mexico. Environmental Res., 1995; 68: 25 - 30. http://dx.doi.org/10.1006/enrs.1995.1004 14. Raju N, Dey S & Das K, Fluoride contamination in ground waters of Sonbhadra District, Utter Pradesh, India. Current Science, 2009; 96(7) 979 – 985. 15. Apambire, W.B., Boyle, D.R. and Michel, F.A, Geochemistry, genesis, and health implications of floriferous ground water in the upper regions of Ghana. Environmental Geology, 1997: 33, 13 – 24. http://dx.doi.org/10.1007/s002540050221 16. Geological Map of the World at 1: 25. 000.000, Commission for the Geological Map of the World, UNESCO, September 2000 (2nd) edition. 17. Kausik Kumar Das, Tanuja Panigrahi & R.B.Panda, Occurrence of Fluoride in Ground water of Patripal Panchayat in Balasore District, Odisha, India, Journal Of Environment., 2012; 1, 33 – 39. 18. Shashank S, Pandey. A.C, Nathawat.M.S, Evaluation of fluoride concentration in ground water in hard rock terrain in Garhwa district, Jharkhand, India, International Journal Of Environmental Science., 2012; 3, 1022- 1030. 19. Rizwan R & Gurdeep S, Ground Water Quality Status With Respect To Fluoride Concentration in Industral Area Of Angul District Orissa, India, Ind.J.Sci.Res, And Tech., 2013; 54 – 61. 20. Shobana R & Soruba R, Ground water quality of five villages in Natham City, Dindigul District Tamil Nadu, India, Int J Curr Sci., 2012; 68 – 70. 21. Jitumoni B & Deepjyoti S, Estimation of the concentration of Fluoride in the Ground water of Tinsukia Town Master Plan of the Tinsukia district, Assam, India, Applied Science research., 2011; 3, 202 – 206. 22. Nagaraju A, Sarma M.R.S, Aitkenhhead – Peterson J.A, Sunil K, Fluoride incidence in groundwater case study from Talupula, Andhra Praddesh, India, Environmental Monitoring and 427 – 443. Assessment., 2011; 172: http://dx.doi.org/10.1007/s10661-010-1345-3 23. Maimuna Waziri, Umar Musa, Stephen S. Hati, Assessment Of Fluoride Concentration in Surface Waters and Ground waters Sources in Northeastern Nigeria, Resources and Environment., 2012; 2: 67 – 72. http://dx.doi.org/10.5923/j.re.20120202.10 24. Battaleb. S – Looie & Moore. F, A study of Fluoride Groundwater occurrence in Posht – e- kooh – e- Dashtestanm South of Iran., 2010: 11, 1317 – 1321. 25. B.M.Kalshetty, S.M. Gaonkar, R. S. Gani, M.B. Kalashetti. Assessment and toxicity of fluoride from ground water sources in and around Bagalkot district, Karnataka, India. Int.Res.J.Pharm. 2013; 4(5): 246 – 249 http://dx.doi.org/10.7897/22308407.04552. 621.
(7) Fathi M. Elmabrok . Int. Res. J. Pharm. 2015, 6 (9) 26. G. Alagumuthu and M. Rajan. Monitoring of fluoride concentration in ground water of Kadayam block of Tirunelveli district, India: Correlation with physic- chemical parameters, Rasayan J, Chem2008; 920 – 928 27. Handa. BK. Geochemistry and genesis of fluoride containing ground waters in India. Groundwater, 1975; 275 – 281 http://dx.doi.org/10.1111/j.1745-6584.1975.tb03086.x 28. Chakraborti. D, Chanda. C. R, Samana. G, Chowdary. U.K, Mukerjel. S.C. and Pal A.B. et al, Fluorosis in Assam, India, Current Science 2000; 78, 1421-1423 29. Libyan National Center for Standardization and Metrology, (LNCSM 10: 2008). 30. CEC (Council of the European Communities), 1998. Council Directive0f 3rd November 1998 on the quality of water intended. for human consumption (98/83/ EEC). Official Journal of the European Communities, No.L330/32 31. WHO, Guidelines for Drinking Water Quality, World Health Organization, Geneva 2004, 3nd 32. APHA. Standard method for the examination of the water and wastewater 17th edition, American Public Health Association, New York, U.S.A, 1989 Cite this article as: Fathi M. Elmabrok. Study of fluoride level in the ground water of Alagilat city, Libya: Correlation with physicochemical parameters. Int. Res. J. Pharm. 2015; 6(9):616-622 http://dx.doi.org/10.7897/ 2230-8407.069120. Source of support: Libyan authority, Conflict of interest: None Declared Disclaimer: IRJP is solely owned by Moksha Publishing House - A non-profit publishing house, dedicated to publish quality research, while every effort has been taken to verify the accuracy of the content published in our Journal. IRJP cannot accept any responsibility or liability for the site content and articles published. The views expressed in articles by our contributing authors are not necessarily those of IRJP editor or editorial board members.. 622.
(8)
Figure
Related documents
Using 10 murine no- rovirus (MNV) strains and 5 human norovirus (HuNoV) virus-like particles (VLPs), we identified monoclonal antibody (MAb) 2D3, which broadly neutralized all
Prevalence of Electricity Power theft in Nueva Ecija II Electric Cooperative, inc. (NEECO-II)-Area 2
Rosa and San Leonardo recorded the highest number of consumers but also registered the highest number of electric pilferers (132 and 84, respectively) as compared
Based on the literature review, we tested for the effects of birth order (first or second born), zygosity (MZ or DZ), sex (boys or girls), GA, birth weight, mother ’ s and father ’
In order to ensure the integrity and availability of data in Cloud and enforce the quality of cloud storage service, efficient methods that enable on-demand data
In the present study, the combination of 2 essential oils of Damask rose and lavender reduced the pain only 30 minutes before the intervention compared to the inhalation of each
microorganism that is generally non-pathogenic and has been used extensively for large-scale industrial production of various enzymes; however, there has been no previous report on
No statistical differences were noted between the genders for the kinematics of the left or right hip during initial contact (Table 4.3), peak knee flexion (Table 4.6), peak
Slope identifies the maximum rate of change in value from each cell to its neighbors, as in (3). 7, 8 and 9 show the results of mentioned spatial data analysis. Figure1:
