November-December 2016 775
Research
Paper
Development and Validation of a Novel Colorimetric
Method for the Estimation of Emtricitabine in Bulk and
Tablet Formulation
T. N. V. GANESH KUMAR, S. VIDYADHARA, T. D. KUMAR, D. JASWANTH, K. VIJETHA AND B. G. PRIYADARSHINI
Department of Pharmaceutical Analysis, Chebrolu Hanumaiah Institute of Pharmaceutical Sciences, Guntur 522 019, India
Ganesh, et al.: Development and Validation of a Colorimetric Method for the Estimation of Emtricitabine A simple and new colorimetric method was developed for the estimation of emtricitabine. The proposed colorimetric method is based on the diazotisation of amine group present in emtricitabine, followed by colour
complex formation using β-naphthol reagent. Parameters affecting the reaction were studied and conditions
were optimized. The absorption maximum for the colour complex was observed at 559 nm. Linearity was
obtained in the concentration range of 100-500 µg/ml for emtricitabine colour complex. The developed method
was optimised and validated. The method was successfully applied for the estimation of emtricitabine in bulk
and in tablets. This is the first method reported for colorimetric estimation of emtricitabine.
Key words: Emtricitabine, diazotisation, β-naphthol, colorimetry
Emtricitabine is a nucleoside reverse transcriptase inhibitor (NRTI) for the treatment of HIV infection in adults and children. This drug is most widely used in antiviral therapy. It is indicated in combination with other antiretroviral agents to treat HIV infection[1,2]. Chemically, emtricitabine is 4-amino-5-fluoro-1-[(2R,5S)-2-(hydroxymethyl) -1,3-oxathiolan-5-yl]-1,2-dihydropyrimidin-2-one (fig. 1). It is one among the list of most essential medicines in health system, according to the World Health Organisation[3]. Several analytical methods using Reversed-phase high-performance liquid chromatography (RP-HPLC), UV and Liquid chromatography-mass spectrometry (LC-MS) were reported for the estimation of emtricitabine in bulk, formulations and biological samples like human plasma/serum[4-6]. Fluorimetric method for the estimation of emtricitabine in plasma samples was also reported[7]. Most of the developed methods were robust
and accurate. Although these methods have proven to be good for the estimation of emtricitabine, till date there is no colorimetric method for its estimation has been reported. A colorimetric estimation method for emtricitabine can be developed due to its free amino functional group present at 4th position of pyrimidine ring. In the present work, we have focussed on development of colour complexes, which are stable and their absorbance is linear with concentration. Diazonium salts are involved in the substitution, coupling and replacement reactions. Azo dyes have been prepared using this process[8]. The temperature should be maintained and the solutions should be freshly prepared because the diazonium salts are very unstable and tend to be explosive as solids[9-11]. The present colorimetric method would be efficient and simple for the estimation of emtricitabine alone in bulk and pharmaceutical formulation.
MATERIALS AND METHODS
All chemicals used in the present study were of
*Address for correspondence
E-mail: [email protected]
This is an open access article distributed under the terms of the Creative Commons Attribution-NonCommercial-ShareAlike 3.0 License, which allows others to remix, tweak, and build upon the work non-commercially, as long as the author is credited and the new creations are licensed under the identical terms
Accepted 22 November 2016 Revised 18 October 2016 Received 12 December 2015 Indian J Pharm Sci 2016;78(6):775-779 Fig. 1:Structure of emtricitabine.
N N H2N
F
O
S O
776
analytical grade and purchased from S. D. Fine-Chem Ltd., India, and Aldrich Fine-Chemical Co., India. All the solvents used were obtained from Merck, India. Emtricitabine bulk drug was obtained as a gift sample from Mylan laboratories Ltd. Marketed emtricitabine tablet formulation was purchased from local pharmacy. All the visible spectral measurements were made using LabIndia UV-3000 double beam UV/Vis spectrophotometer and Elico SL 218 UV/ Vis spectrophotometer with wide range photodiode detection and fixed 10 mm path holders for reference and sample with 10 nm quartz cell.
Chemistry:
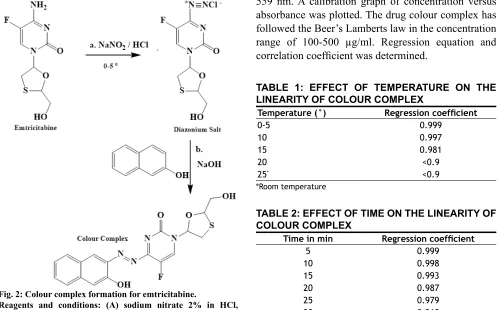
The primary amino group present in the emtricitabine nucleus reacts with sodium nitrite (NaNO2) in the presence of hydrochloric acid (HCl) at 0-5°, to give a diazonium salt. This diazonium salt when reacted with β-naphthol followed by addition of sodium hydroxide (NaOH) produced a reddish brown colour complex. The reaction was depicted in fig. 2.
Preparation of standard stock solution:
One hundred milligrams of emtricitabine was accurately weighed and transferred into a 100-ml volumetric flask, dissolved and the volume was made
up with distilled water to obtain a final concentration of 1000 µg/ml.
Selection of analytical wavelength:
From the stock solution, 100 µg/ml concentration was prepared. From this, 1 ml was transferred into a 10 ml volumetric flask to which 1 ml of 10% NaNO2 and 1 ml of 5% HCl was added at 0-5° with stirring. To this solution, 1 ml of 0.2% β-naphthol in 5% NaOH was added and mixed. A reddish brown colour was formed after 1 min. The resultant solution was scanned under the wavelength range from 400 to 800 nm to obtain the absorption maximum (λmax) at 559 nm.
Selection of analytical concentration range:
Several concentration ranges were prepared and performed the reaction. But the most stable and detectable absorbance was observed with the concentration range from 100 to 500 µg/ml, prepared from the stock solution. From each concentration, 1 ml was transferred into 10 ml volumetric flasks and was diazotised at 0-5° with stirring and reacted with β-naphthol in presence of NaOH to give colour complex.
Preparation of a calibration graph:
Absorbance of the above solutions was measured at 559 nm. A calibration graph of concentration versus absorbance was plotted. The drug colour complex has followed the Beer’s Lamberts law in the concentration range of 100-500 µg/ml. Regression equation and correlation coefficient was determined.
Temperature (°) Regression coefficient
0-5 0.999
10 0.997
15 0.981
20 <0.9
25* <0.9
*Room temperature
TABLE 1: EFFECT OF TEMPERATURE ON THE LINEARITY OF COLOUR COMPLEX
TABLE 2: EFFECT OF TIME ON THE LINEARITY OF COLOUR COMPLEX
Time in min Regression coefficient
5 0.999
10 0.998
15 0.993
20 0.987
25 0.979
30 0.968
Fig. 2: Colour complex formation for emtricitabine.
November-December 2016 777
Optimised conditions:
Effect of the temperature was studied during the colour complex stability. The change in temperature from diazotised condition (0-5°) to room temperature after reagent addition was studied. The absorbance values were measured at 5° intervals while increasing the temperature from 5° to 25°. The absorbance values and their linearity were tabulated in Table 1.
Effect of time on the stability of colour complex formed was studied with increase in time. The absorbance values were measured at every 5 min interval maintaining the conditions. The change in absorbance values and linearity with respect to the time were tabulated in Table 2.
3-methyl-2-benzothiazolinone hydrazine hydrochloride (MBTH), 1,2-naphthaquinone -4-sulfonate sodium (NQS), Bratton Marshal (BM) and β-naphthol were studied for the colour complex development. Among the reagents used, β-naphthol was found to form most stable coloured complex. The other reagents used were not able to produce colour complexes with the emtricitabine with good stability.
The effect of the concentration of the reagent (β-naphthol) on colour complex development was studied varying the concentrations from 0.1, 0.2, 0.4,
0.5, 1 and 2% of reagent solution were studied and tabulated in Table 3.
Theassays of commercial tablets procured were used for the assay. The contents of 20 tablets were taken and finely powdered. Weighed accurate tablet powder equivalent to 100 mg of emtricitabine and transferred to 100 ml volumetric flask and diluent was added. The solution is sonicated for 15 min. The volume is made up with same diluent and mixed well. The solution was filtered through a membrane filter of 0.45 µm and discarded the first 2 ml. This is used for the assay by following the procedure described. The amount of drug was calculated from the calibration curve.
Method validation:
The linearity of the analytical method is its ability to elicit test results that are directly proportional to the concentration of analyte in sample within a given range. The results were shown in Tables 4 and 5. The ruggedness of the developed method was determined by analyst variation (analyst 1 and analyst 2) and instrument variation (LabIndia UV-3000 and Elico SL 218 double beam UV/Vis spectrophotometers). The results were analysed statistically and the effect of variations were estimated. The results were shown in Table 6. For determining a method’s robustness, parameters like detector wavelength are varied within a realistic range and the quantitative influence of the variables is determined. The results were shown in Table 7.
RESULTS AND DISCUSSION
The presence of free primary amine group in TABLE 3: EFFECT OF REAGENT CONCENTRATION
ON THE LINEARITY OFCOLOUR COMPLEX
Concentration (%) Regression coefficient
0.1 0.854
0.2 0.999
0.4 0.968
0.5 0.938
1 P*
2 P*
*P: precipitation of the colour complex occurred
TABLE 4: LINEARITY DATA OF COLOUR COMPLEX
Concentration (µg/ml) Absorbance at 559 nm
100 0.110
200 0.234
300 0.344
400 0.454
500 0.578
TABLE 5: LINEARITY PARAMETERS
Parameters Values
Linearity range 100-500 µg/ml
Slope 0.001
Intercept 0.003
Correlation coefficient 0.999
Regression equation y=0.001x+0.003
TABLE 6: RUGGEDNESS DATA OF EMTRICITABINE COLOUR COMPLEX
Parameters %RSD
Analyst 1 0.328
2 0.276
Instrument 1 0.862
2 0.877
TABLE 7: ROBUSTNESS DATA OF EMTRICITABINE COLOUR COMPLEX
Wavelength±2 nm %RSD
557 0.86
561 1.46
Dosage form Labelled claim
(mg) Amount estimated (mg) %Purity
Emtricitabine 200 mg 197.84 98.92%
778
emtricitabine is a reacting group to develop colour complexes, which led to the development of colorimetric estimation. The reaction of primary aromatic amine with nitrous acid, obtained from sodium nitrite and hydrochloric acid leads to formation of diazonium salt under cold conditions. This diazonium compound is unstable and easily reacts with various reagents and develops colour complexes. During the initial phase of work, several reagents were used for colour development. Except β-naphthol, the other reagents used could not able to develop the colour. In the present work the reaction conditions necessary for estimation of drug during the reaction and after the colour complex formation were studied. The initial concentration range for the drug was estimated. The concentration range of 100-500 µg/ml was found to possess good linearity and followed Beer’s Lambert’s law. The colour complex formed has shown its absorption maxima at 559 nm in the visible region. The effect of temperature was determined for the stability of colour complex with an interval of 5° from 5 to 25° (room temperature). The stability of the colour complex developed with respect to time was also determined by measuring the absorbance values with an interval of 5 min from 5-30 min. From the data it is observed that the time and temperature to be maintained for the estimation are within 15 min and not more than 15°, respectively. The data have shown the good conditions for colour complex stability. The concentration of the reagent for the colour complex formation played a vital role. Concentrations of 0.1, 0.2, 0.4, 0.5, 1 and 2% β-naphthol were prepared and used for the study. Increasing the concentration of the reagent resulted in the formation of a precipitate. The ideal concentration for the colour development with good absorbance values was found to be 0.2% of the reagent. The diazotisation reaction was performed at 0-5°. Changes in the conditions have decreased the absorbance values and affected the linearity. The method developed was validated using different parameters like linearity, robustness and ruggedness. The parameters involved are changed in wavelength, change of analyst and change of instrument. All the validated parameters have shown good %RSD (≤2) within the limits as per the International Conference on Harmonisation (ICH) guidelines[12]. Parameters like inter-day and intraday precision could not be performed due to the instability of the formed colour complex. The method was used for the determination of emtricitabine in pharmaceutical tablet dosage form and found to be effective in quantitative estimation. In the assay performed, the percent of drug in tablets
was found to be 98.46%. Thus, the results obtained for the proposed colorimetric method confirms the suitability for estimating pharmaceutical tablet dosage form. The capability of the method developed was complementary to each other in analytical conditions. Hence, it is regarded as a simple and sensitive method for the estimation of emtricitabine in bulk and single pharmaceutical tablet dosage form. The developed colorimetric method was validated according to ICH guidelines and was found to be applicable for the routine analysis of emtricitabine. The proposed colorimetric method was first of its kind for Emtricitabine. Still more effective easy methods could be developed. The present colorimetric method is simple, sensitive and reliable. This method was specific while estimating the analyte from tablets without interference of excipients and other additives. Hence, this method can be used for the estimation of emtricitabine in bulk samples and tablet formulation.
Conflicts of interest:
There are no conflicts of interest.
Financial support and sponsorship:
Nil.
REFERENCES
1. Oxenius A, Price DA, Günthard HF, Dawson SJ, Fagard C, Perrin L, et al. Stimulation of HIV-specific cellular
immunity by structured treatment interruption fails to enhance viral control in chronic HIV infection. Proc Natl Acad Sci 2002;99:13747-52.
2. Yadav M, Singhal P, Goswami S, Pande UC, Sanyal M, Shrivastav PS. Selective determination of antiretroviral agents tenofovir, emtricitabine and lamivudine in human plasma by a LC-MS/MS method for a bioequivalence study in healthy Indian subjects. J Chrom Sci 2010;48:704-13.
3. WHO Model list of essential medicines. World Health Organisation. Retrieved 2014.
4. Arjun G, Sathish KD, Yogeswaran P, Sathyabrata J, David B, KNV Rao. A simple HPLC method for quantitation of emtricitabine in capsule dosage form. Der Pharm Chemica 2010;2:281-5.
5. Pranitha D, Vanitha C, Francis P, Alagar RM, Vishnu VP, Urendar M. Simultaneous estimation of emtricitabine, tenofovir, disoproxil fumarate and rilpivirine in bulk form by RP-HPLC method. J Pharm Res 2012;5:4600.
6. Swapnil AG, Monali S, Sali AH, Kategaonkar DM, Patel VP, Choudhari BSK. Simultaneous determination of emtricitabine and tenofovir by area under curve and dual wavelength spectrophotometric method. J Chil Chem Soc 2010;55:115-17. 7. Droste JAH, Aarnoutse RE, Burger DM. Determination of
emtricitabine in human plasma using HPLC with fluorometric
detection. J Liq Chromatogr Relat Technol 2007;30:2769-78. 8. Wang M, Funabiki K, Matsui M. Synthesis and properties of
November-December 2016 779 9. Beckett AH, Stenlake JB. Practical Pharmaceutical Chemistry.
4th ed. CBS Publishers and Distributors; 2002. p. 157-174. 10. Klaus H, Peter M, Wolfgang R, Roderich R, Klaus K,
Aloys E. Azo dyes. Ullmann’s Encyclopedia of Industrial Chemistry; 2005.
11. Skoog DA, Holler FI, Nieman TA. Fundamentals of Analytical Chemistry. 5th ed. Saunders College Publishing; 2005. p. 673-88. 12. ICH Harmonised Tripartite Guideline, Validation of Analytical