°
First published online as a Review in Advance on July 11, 2003
S
URVEY
R
ESEARCH AND
S
OCIETAL
C
HANGE
Roger Tourangeau
Joint Program in Survey Methodology, University of Maryland, and Survey Research Center, University of Michigan, College Park, Maryland 20742;
email: [email protected]
Key Words response rates, modes of data collection, telephone sampling, Web surveys
■ Abstract Surveys reflect societal change in a way that few other research tools do. Over the past two decades, three developments have transformed surveys. First, survey organizations have adopted new methods for selecting telephone samples; these new methods were made possible by the creation of large databases that include all listed telephone numbers in the United States. A second development has been the widespread decline in response rates for all types of surveys. In the face of this problem, survey researchers have developed new theories of nonresponse that build on the persuasion literature in social psychology. Finally, surveys have adopted many new methods of data collection; the new modes reflect technological developments in computing and the emergence of the Internet. Research has spawned several theories that examine how characteristics of the data collection method shape the answers obtained. Rapid change in survey methods is likely to continue in the coming years.
CONTENTS
INTRODUCTION . . . .776
METHODS OF TELEPHONE SAMPLING . . . .777
The Mitofsky-Waksberg Method . . . .778
List-Assisted Telephone Sampling . . . .779
DECLINING RESPONSE RATES . . . .781
Causes of Nonresponse . . . .781
Maintaining Response Rates . . . .784
Consequences of Nonresponse . . . .785
Theories of Nonresponse . . . .787
NEW MODES OF DATA COLLECTION . . . .787
First Phase of the Computer Revolution . . . .788
Face-to-Face Interviewing . . . .789
Telephone Interviewing . . . .791
Web Surveys . . . .792
Theories of Mode Effects . . . .794
CONCLUSION . . . .795
INTRODUCTION
Perhaps no other research tool used by social scientists is as sensitive to social and technological change as the sample survey. Surveys are themselves part of the fabric of contemporary life—survey research is a multibillion dollar industry in the United States, surveys provide critical information to decision-makers in government and business, and polls and their results are widely discussed by the general public (which often seems to overstate and resent their influence)—but surveys rest on a delicate and complicated relationship between those who conduct surveys and those who take part in them. Virtually all surveys in the United States are voluntary (with some notable exceptions, such as the census of the population conducted every 10 years and the American Community Survey done continuously by the Bureau of the Census), and long-term trends in the social climate (such as changes in the level of civic engagement) can affect how successful surveys are in reaching potential respondents and in persuading them to take part. Because of the size, complexity, and expense of major surveys, which can involve tens of thousands of participants and exceed $100 million in cost, they almost inevitably come to reflect social and technological changes.
In fact, survey practice is a kind of bellwether of social and technological change. For example, the widespread diffusion of telephones throughout American society led to the widespread adoption of telephone interviewing by survey organizations in the 1960s and 1970s; similarly, the development of desktop and laptop comput-ing led directly to the development of computer-assisted telephone interviewcomput-ing (CATI) and computer-assisted personal interviewing (CAPI), respectively. In CATI and CAPI surveys, each question appears on the screen of the interviewer’s com-puter and the interviewer directly keys in the answer. CATI became popular in the mid 1970s and, with the advent of lightweight laptops, CAPI caught on in the 1980s and 1990s. Virtually all major federal surveys now use some form of computer-assisted data collection (see Couper & Nicholls 1998 for an excellent summary of these developments). Advances in computing and telephone technol-ogy have led to such advances in survey methods as e-mail, Web, and interactive voice response (IVR) surveys, in which a computer plays recorded questions over the telephone.
Survey methodology is affected by subtler societal shifts as well. For ex-ample, Singer and her colleagues (Singer 2003, Singer et al. 1993) have doc-umented changes in public attitudes toward privacy and confidentiality—views about whether surveys are an invasion of privacy and whether federal agencies pool data among themselves or share them with other organizations—and demon-strated their impact on willingness to take part in the decennial census. Most survey researchers see the rise of telemarketing, along with the various countermeasures people now take to screen out telemarketers and other unwanted callers, as an important factor contributing to the decline in survey response rates over the last decade. Concerns about crime may have contributed to shifts in residential patterns, including the rise of gated communities, which make it much harder for survey
organizations to carry out face-to-face interviewing. According to one estimate, more than eight million Americans now live in gated communities and nearly 40% of newly built residential developments are gated (Blakely & Snyder 1997). Add to this the growing number of people living in locked urban apartment buildings, assisted-living communities, or other settings that shield residents from unwanted visitors, and it’s apparent that it’s a lot harder to reach potential respondents than it used to be.
These long-term societal trends are reflected in many ways in surveys. One consequence that we’ll examine in detail is the general decline in survey response rates, the proportion of eligible persons selected for survey samples who end up providing data. With some federal surveys in the United States, the problem of rising nonresponse rates is somewhat masked because the interviewers make an increased number of callbacks and, as a result, contact almost every sample case. Even in these surveys, though, the refusal rates (the proportion of respondents who refuse to take part among those that are contacted) are rising (Atrostic et al. 2001). In addition, the number of contact attempts needed to reach potential respondents is increasing, and as a result, survey costs are rising. Any cost savings that can be traced to the computerization of surveys has either been negligible (as some have argued) or swamped by other sources of increased cost, such as rapid rises in data collection costs. The double bind of higher costs and lower response rates has fueled new theories to deepen our understanding of nonresponse and its implications for the accuracy of survey estimates. In addition, survey statisticians have developed new, more cost-efficient methods of selecting samples for telephone surveys.
This review focuses on three recent developments in survey methodology—new methods for telephone sampling, new theories about the sources and consequences of nonresponse, and new modes of data collection. All three developments have had major impact on surveys, all have occurred within the last 15 years or so, and all of them reflect much broader movements within American society. This review thus updates Groves’s Annual Reviews chapter on telephone surveys (1990) and Dillman’s on mail surveys (1991). It has a somewhat different focus from two other recent Annual Reviews chapters related to survey research, both of which focus on questionnaire design and other measurement issues (Krosnick 1999, Presser & Schaeffer 2003).
METHODS OF TELEPHONE SAMPLING
Telephone surveys became a relatively popular method of data collection once most of the U.S. population could be reached by telephone. As late as 1963, some 20% of U.S. households still did not have telephones (Thornberry & Massey 1988); currently, about 96% of American households have a telephone. (A basic social unit for survey researchers is the household, a group of people who share the same residence. Households may include just one person, a family, or a set of unrelated individuals.) Another key requirement for the widespread adoption of
telephone interviewing was a reasonably efficient method for selecting telephone samples. This problem is more difficult than it may seem at first blush and wasn’t completely solved until 1978, when a former Census Bureau statistician, Joseph Waksberg, documented the statistical properties of a method of sampling that was soon adopted throughout the industry (Waksberg 1978). The method Waksberg explored had been previously proposed by Warren Mitofsky, a statistician working at CBS, and the technique they developed is generally referred to as the Mitofsky-Waksberg method.
The Mitofsky-Waksberg Method
Telephone samplers face two related problems. On the one hand, a high percentage of all residential telephone numbers (currently about 30%) are unlisted; thus, sampling from telephone directories can produce samples that do not accurately represent the telephone population, let alone the entire household population. (In the jargon of survey research, such samples are said to suffer from undercoverage.) The exclusion of unlisted numbers from telephone samples might not be such a serious problem, but those with unlisted telephone numbers differ systematically from those with listed numbers. To cite one surprising difference, they tend to have lower incomes than households with listed numbers (American Statistical Association 1999). As a result, statistics from telephone surveys would be seriously biased if unlisted numbers were omitted from the samples. This potential for large biases means that directory samples are unacceptable for most federal and academic surveys. On the other hand, most of the possible numbers that can be generated from a list of active area codes and three-digit prefixes (or exchanges) are not, in fact, residential telephone numbers. Only about one quarter of the possible numbers formed by adding random endings to active area code/prefix combinations yield working residential numbers. This method of sampling, known as full random-digit dialing (full RDD), includes both listed and unlisted numbers, but it’s quite inefficient. Fully three fourths of the sample numbers will never yield interviews, even after repeated callbacks, because they are not working residential numbers (WRNs). Not all unassigned numbers can be readily distinguished from working numbers; when dialed, the number simply rings. Thus, the presence of these hard-to-identify nonworking numbers can markedly drive up the cost of conducting telephone surveys.
The Mitofsky-Waksberg method takes advantage of the fact that telephone com-panies tend to hand out telephone numbers in sequence rather than randomly. As a result, once a number is found to be a WRN, nearby numbers are likely to be WRNs, too. The Mitofsky-Waksberg method starts with a full RDD sample of pri-mary numbers. A randomly generated four-digit suffix is added to an active area code/prefix combination. (For example, the number 3198 would be appended to the 301 314 combination, yielding a 10-digit number that is potentially a working telephone number.) When a primary number turns out to be a WRN, additional numbers are generated from the same “100-bank.” A 100-bank consists of all the
potential telephone numbers that share their first eight digits (e.g., the numbers from 301 314-3100 to 301 314-3199 make up one bank). Roughly 65% of these secondary numbers turn out to be WRNs. Thus, the Mitofsky-Waksberg method represented a big improvement in efficiency over full RDD; depending on the num-ber of secondary selections per working primary numnum-ber, the overall proportion of WRNs in the sample can more than double to 50% or better.
Waksberg showed that this two-stage method of selecting phone numbers yielded an equal-probability sample of all WRNs (not just the listed ones) and had other desirable statistical properties as well. Consider the sampling probabili-ties. Waksberg showed that the probability that any given WRN (the jth WRN from bank i) falls into the sample depends on the number of primary numbers selected (a), the number of WRNs in that 100-banks (Mi), and the number of secondary numbers that are selected from each bank:
Pr(WRNi j)= a A Mi 100 k Mi = ak 100 A.
The first term (a/A) is the probability of selecting a bank, the second is the probability that that bank will be retained in the sample (that is, it is the probability that a randomly generated primary number from the bank will be a WRN), and the final term is the fraction of the WRNs from the bank that are selected into the sample, given that the bank was retained. (A total of k WRNs is selected from each bank, including the primary number and k−1 secondary numbers.)
Despite its elegant theoretical properties, the Mitofsky-Waksberg method has its operational difficulties. For instance, it is not always obvious whether a primary number is a WRN or not; in addition, the design may require more selections from a bank than it has WRNs (that is, k may be greater than Mi). As a result, researchers have continued to search for better methods to select telephone samples.
List-Assisted Telephone Sampling
A breakthrough occurred in 1993, when Casady & Lepkowski published an impor-tant paper on what are now called list-assisted designs (Casady & Lepkowski 1993; see also Lepkowski 1988). By the 1990s, it was possible to scan in (and dedupli-cate) information from all the telephone directories in the United States. Using the resulting database, one could determine whether any 100-bank of possible phone numbers included any residential listings. The Mitofsky-Waksberg method works in part because it screens out empty banks—banks with no WRNs at all. (These empty banks will always be associated with primary numbers that turn out not to be WRNs.) Casady and Lepkowski examined the designs possible when banks are classified at the outset according to the number of residential listings they con-tain. In particular, they examined a design in which banks are stratified into two groups—those with at least one residential listing and those with no residential
listings (“zero banks”). Some banks with no residential listings contain residential numbers that either are not yet listed or are unlisted, but the “hit rate” is quite low in the zero banks. In fact, Brick et al. (1995) estimate that only 1.4% of the numbers in zero banks are WRNs. This implies that roughly 70 numbers have to be generated and dialed to find a single WRN. Clearly, the costs per completed case are going to be considerably higher in the stratum consisting of the zero banks than in the other stratum, where more than 50% of the numbers are WRNs.
The problem of how to distribute sample cases across strata with varying costs per case is a classical sampling problem, and Casady & Lepkowski (1993) worked out the optimal solution for sampling from zero and nonzero banks. Under most reasonable assumptions, only a small percentage of the completed cases will come from the zero banks. As a result, excluding the zero banks entirely would have little impact on the statistics from the survey. In addition, according to Brick and his colleagues (Brick et al. 1995), only about 3.5% of all telephone households are in zero banks. Moreover, the households in this stratum don’t differ much from households associated with banks with one or more residential listings, with one exception—households in zero banks are more likely to have moved recently. (The zero banks with WRNs may often be newly opened banks with residential numbers that have been assigned recently. Thus, they would overrepresent recent movers who are receiving previously unassigned phone numbers.) Based on the theoretical results presented by Casady and Lepkowski and the empirical results of Brick and his colleagues, most survey researchers have switched from the Mitofsky-Waksberg method of telephone sampling to the “truncated” design, in which all of the selections come from banks of telephone numbers with at least one residential listing. From a statistical vantage point, the truncated design had the additional advantage that it yields a simple random sample of WRNs, whereas the two-stage Waksberg-Mitofsky design clustered the sample in banks. This clustering reduces the precision of the estimates from the survey. The adoption of the list-assisted design was doubtless hastened by the fact that Waksberg was himself a coauthor on one of the key papers and seemed to be giving his blessing to the new method. List-assisted telephone sampling was made possible by technological changes that permitted commercial firms to create and manipulate giant databases—in this case, databases containing information on some 75 million U.S. households. Theoretical and empirical results demonstrated that the method was quite efficient and could be made even more efficient if the sampling process simply ignored numbers in the zero banks. Of course, the minimal bias associated with the omission of the zero banks is itself the outcome of a social process, one that could change in the coming years.
These developments might have ushered in a golden age for telephone surveys if it weren’t for two offsetting trends. First, telephone surveys’ coverage of the U.S. household population may have peaked. By 1980, 93% of U.S. households had a telephone (Thornberry & Massey 1988) and the percentage has crept up only slightly since then to the current level of about 96%. The trend now may be down-ward, with a small but growing proportion of the U.S. population having cellular
telephone service only. Although in principle these cell-only subscribers could be included in telephone samples, as long as the recipient of a call on a cell phone incurs charges for the call, it is unlikely in practice that cell-only households will be represented in telephone surveys. The rapidly increasing popularity of cell phones in the United States—currently, there are about 40 cell phones per 100 persons in the United States (International Telecommunications Union 2001)—thus rep-resents a long-term threat to the representativeness of telephone survey samples. This is already a problem in several European countries, where the proportion of cell-only households exceeds that of the United States. A more immediate threat comes from a second set of developments—the array of technologies now available to help people screen out unwanted calls. By 1995, the majority of U.S. households had answering machines and roughly 40% reported they used them to screen their calls (Tuckel & O’Neill 1995; see also Oldendick & Link 1994, who report the results from a study of South Carolina residents). There is little doubt that both of these proportions are rising. Although answering machines are the most popu-lar technology for call screening, caller ID and call blocking are becoming more widespread as well (Link & Oldendick 1999, Tuckel & O’Neill 1996). By 1996, about 10% of all households nationally had caller ID. The use of these various devices to fend off unwanted calls is widely seen as contributing to the falling response rates afflicting surveys in the United States and throughout the Western world; these trends in response rates are the next topic we take up.
DECLINING RESPONSE RATES
The challenge presented by falling response rates is perhaps the greatest threat survey researchers have faced in the past 10 years, and an entire conference was devoted to the topic in 1999 (Groves et al. 2002). The threat posed by falling response rates has provoked two main responses among survey researchers. One approach has been to explore the reasons for nonresponse more deeply than before, partly with a view toward developing new methods for boosting response rates; the other approach has been to examine the consequences of nonresponse. Survey researchers have also tried to bridge these two approaches by developing better theories linking the causes of nonresponse to their likely impact on survey statistics.
Causes of Nonresponse
Traditionally, survey researchers have distinguished among various types of non-response. For example, in a panel survey (in which attempts are made to interview respondents multiple times), some respondents may move and the researchers may be unable to track them to their new location; other respondents may tire of partic-ipating and drop out. Groves & Couper (1998) argue that it is generally useful to distinguish among three main forms of nonresponse—nonresponse due to noncon-tact, nonresponse due to the refusal to cooperate, and nonresponse due to inability
to participate (e.g., inability to complete an interview in English). The trends in response rates seem to reflect increasing difficulty on all three fronts.
Consider first the mounting difficulties of contacting potential respondents. As we have already noted, for telephone surveys, caller ID, call blocking, and answering machines have created formidable and widespread barriers to contact (Link & Oldendick 1999; Oldendick & Link 1994; Tuckel & O’Neill 1995, 1996). These technologies have caught on quickly—the majority of American households now have answering machines, caller ID, or both, and substantial numbers of households use them to screen out unwanted calls. Many survey professionals report anecdotally that telephone response rates have plummeted over the last decade or so. Although the published evidence for this dramatic downturn is not so clear, Steeh and her colleagues (Steeh et al. 2001) show that it takes an increasing number of attempts to reach households selected for the University of Michigan’s Survey of Consumer Attitudes (SCA) and the Georgia State Poll. The average number of call attempts per interview for the SCA peaked at approximately 12 in 1999, the last year Steeh and her colleagues examined; in the mid 1990s, the figure was close to six calls. Similarly, although the evidence is largely anecdotal, many survey researchers believe it is also much more difficult than it used to be to contact potential respondents in face-to-face surveys; as noted above, far more people now live in gated communities, institutions, locked apartment buildings, or other settings that shield residents from unwanted visitors than lived in such settings 10 or 15 years ago. Other long-term social trends, including greater participation by women in the labor force and the rise of single-person households, have also contributed to the increased difficulty in reaching people at home.
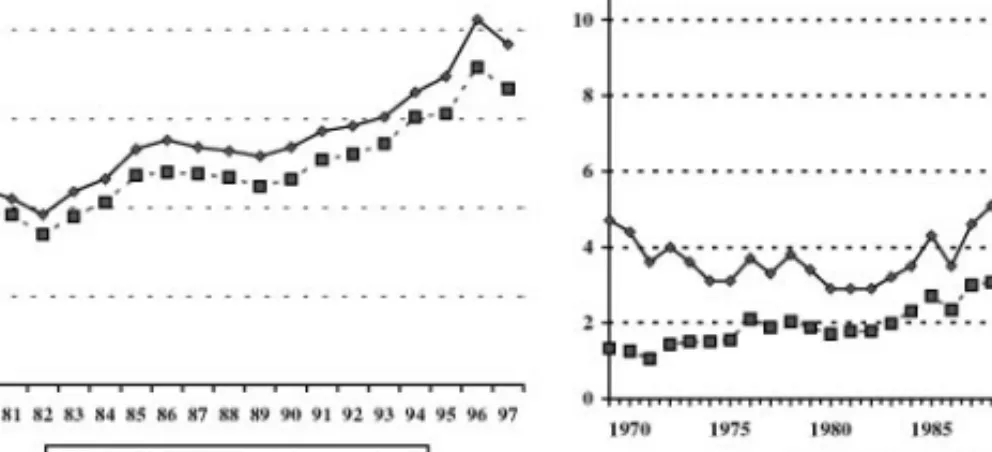
The second major form of nonresponse is refusal to take part in the survey. Steeh and her coworkers (2001) argue that any recent fall in telephone response rates probably reflects greater difficulty in contacting telephone households rather than higher rates of refusal to participate, but the opposite seems to be the case for face-to-face surveys. Nonresponse due to refusal to take part in surveys seems to be rising for household surveys all over the developed world (Groves & Couper 1998, de Leeuw & de Heer 2002). With some federal surveys in the United States, which place a premium on high response rates, the problem of rising nonresponse rates is somewhat obscured because the interviewers try harder, making more callbacks and taking other measures to maintain response rates. Even in these surveys, though, the refusal rates appear to be rising (see, for example, Atrostic et al. 2001), driving up the overall nonresponse rates. Figure 1 displays the overall nonresponse rates and refusal rates for two major federal surveys—the Consumer Expenditure Survey (CES) and the National Health Interview Survey (NHIS). Both showing increasing overall nonresponse rates and, in both cases, the overall increase mainly reflects a rise in the rate of refusals. The NHIS data also suggest that noncontact may be increasing in that survey.
Researchers have cited many possible causes for this increased reluctance to take part in surveys, including the decline in the level of civic engagement (Putnam 1995; see also Groves et al. 2000), reduced amounts of free time (although see Robinson & Godbey 1997, who argue that Americans actually have more free time
Figure 1 The overall nonresponse and refusal rates for the Consumer Expenditure Survey (left) and the National Health Interview Survey (right). Adapted from Groves & Couper 1998.
than they used to), increased concern about privacy and confidentiality (Singer et al. 1993), rising hostility toward telemarketers, and even the possibility of identity theft. Whatever the reason for the change, refusal rates definitely seem to be rising for household surveys.
Long-term shifts in the demographic makeup of the U.S. population— specifically, the rising percentage of foreign-born and elderly Americans—are the basis for additional concerns about survey nonresponse. These concerns focus on the final form of nonresponse distinguished by Groves & Couper (1998), sam-ple persons who are unable to provide data. In 2002, 11.5% of the U.S. population was foreign-born; according to Long Form data from Census 2000, 8.1% of the population over age five reported that they speak English less than “very well.” Many surveys now field both Spanish and English questionnaires, but only two thirds of those who are less than completely fluent in English are Spanish speakers. Similarly, the rising proportion of the population over 65 years of age suggests that an increasing percentage of sample persons will be unable to complete interviews because they have hearing problems or other physical infirmities that prevent them from participating. Surveys are likely to rely more on “proxy” reporters to provide information that sampled persons are unable to provide for themselves.
Rising rates of nonresponse reflect mounting difficulties in reaching people, per-suading them to take part, and making it possible for them to complete an interview. The problem affects both telephone and in-person surveys, but it’s probably worse for telephone surveys—currently, very few telephone surveys achieve response rates higher than 60% (whereas some face-to-face surveys still achieve 90% re-sponse rates). For longitudinal surveys, panel attrition—losses due to nonrere-sponse in the second or later waves of the survey—compound the effects of nonresponse in the first wave, especially in surveys that make no attempt to include initial nonrespondents in later rounds.
Maintaining Response Rates
Survey efforts to maintain response rates have centered on methods to improve rates of contacting sample households and to lower rates of refusal. It has been known for quite some time that the key to making contact is repeated callbacks. This is true for mail (Heberlein & Baumgartner 1978, Dillman 1991), telephone (Weeks et al. 1980, 1987), and face-to-face surveys (RM Groves, DA Wissoker, L Greene, ME McNeeley, DA Montemarano, unpublished manuscript, 2001). At some level, the process of making contact with sample households is quite simple— it’s just matter of overcoming barriers to access and reaching the household when someone’s home. The determinants of when and how often people are at home may be complicated, but there’s not much survey researchers can do about those dynamics and their efforts have focused on finding more efficient call-scheduling algorithms (e.g., Weeks et al. 1980, 1987) or on overcoming barriers to access (e.g., by leaving messages on answering machines; Tuckel & Schulman 2000, Xu et al. 1993). Given enough time and effort, it is possible to reach nearly everyone in the sample, but this can be costly and will be difficult to sustain in the long run. And once survey interviewers reach people, they may still find it difficult to persuade them to take part. Perhaps the most common method that surveys have used to counter stiffening resistance to participation has been to offer incentives. In mail surveys, a small payment (e.g., $2) sent with the questionnaire is often an effective means of boosting response rates (Church 1993, Fox et al. 1988, Yu & Cooper 1983). Church’s (1993) meta-analysis comes to three main conclusions about incentives in mail surveys: (a) Prepaid incentives are more effective for increasing response rates than incentives that are contingent on completion of the questionnaire; (b) monetary incentives are more effective than nonmonetary gifts; and (c) bigger incentives are more effective than smaller ones (although a large incentive can have diminished impact relative to smaller ones if it seems suspiciously large; James & Bolstein 1992). Church finds an average increase in response rates of 19 percentage points in mail surveys that provide monetary incentives up front. These three same generalizations about the timing, form, and amount of incentives seem to hold for telephone and face-to-face surveys as well, according to a recent meta-analysis by Singer and her colleagues (Singer et al. 1999). Overall, though, incentives appear to have less impact in telephone and face-to-face surveys than in mail surveys, with “lower percentage point gains per dollar expended” (Singer 2002, p. 165). Although most surveys offer respondents cash or checks, survey researchers have examined a variety of methods for providing incentives, including entering the names of survey participants in sweepstakes for relatively large monetary amounts or making charitable donations in their name. The track record of these alternative payment vehicles is mixed at best (Singer 2002, Warriner et al. 1996).
There are three main theories about how incentives work in surveys. The first is that incentives create a sense of obligation on the part of sample members, perhaps by triggering the norm of reciprocity or by inducing sample members to view the request as part of a larger social exchange between themselves and
the institutions that sponsor and carry out surveys (Dillman 1978, Goyder 1987). This first set of theories may help explain why small, prepaid incentives are so effective. Still, when surveys are long or impose especially onerous demands on respondents (such as the need to provide biological specimens), much larger incentives are common, and respondents probably see the incentives in economic terms, as compensation for their time and trouble. This view might be labeled the economic theory of incentives. The final theory suggests that incentives provide a reason for participating in the survey among those who would not otherwise have a motive to take part (Groves et al. 2000); they may lack sufficient interest in the survey topic, liking for the interviewer, or feeling of civic duty to take part, but the money gives them a reason to complete the survey. The main empirical consequence of this final theory is that incentives will have the largest impact within subgroups of the population that would ordinarily be least likely to cooperate.
The other major approach to improving response rates has focused on the in-terviewer’s approach to sample members, including the messages they leave on answering machines in telephone surveys. The findings suggest that scripted mes-sages and introductions have relatively little effect on cooperation (Baumgartner 1990, Daves 1990, Tuckel & Schulman 2000, Xu et al. 1993), although Xu and colleagues did find that leaving a message improved the chances of making contact with sample households. By contrast, customizing the introductions to the con-cerns or interests of the sample person does seem to improve cooperation (Dillman et al. 1976, Groves & McGonagle 2001, Morton-Williams 1993).
Consequences of Nonresponse
Survey statisticians assess the impact of nonresponse in terms of its effects on the variance and bias of estimates derived from survey data. The impact of nonre-sponse on the variance mainly reflects the reduced sample sizes that result from nonresponse. For means and proportions, the impact of nonresponse on the bias depends on both the nonresponse rate and the difference between respondents and nonrespondents:
Bias=E ( pn)( ¯Yr −Y¯n) (1) in which E(pn) is the expected nonresponse rate, ¯Yris the mean for the respondents, and ¯Yn, the mean for the nonrespondents. (Like other survey statistics, the non-response rate is subject to sampling error and fluctuates from sample to sample.) For example, imagine a political poll trying to predict the proportion of voters supporting a particular candidate. If the proportion is the same among respon-dents and nonresponrespon-dents, then the bias will be zero; in such cases, nonresponse is effectively just another stage of random sampling.
Equation 1 assumes that nonresponse is deterministic—that is, given a fixed survey design, everyone in the target population will either always be a respon-dent or always be a nonresponrespon-dent. Lessler & Kalsbeek (1992) give a more gen-eral expression for the bias in a mean or proportion, based on the more realistic assumption that nonresponse may be probabilistic:
Bias=Cov(ri,Yi)−E ( pn) ¯Y. (2) Equation 2 shows that the bias mainly reflects the covariance between the probability of becoming a respondent (ri) and the values of the substantive variable of interest (Yi); the final term is the product of the overall mean ( ¯Y ) and the expected nonresponse rate. The bias formulas are more complicated for analytic statistics like subgroup differences or regression coefficients.
Equations 1 and 2 imply that when there is no relation between the phenomenon of interest (say, political attitudes) and the probability of becoming a respondent in the survey—that is, no difference between the respondents and nonrespondents on the variables of interest—there won’t be any bias in the survey estimates.
Three recent studies, one with a randomized experimental design, show that this condition may often be met in surveys. All three studies demonstrate little or no relationship between nonresponse rates and nonresponse bias (Curtin et al. 2000, Keeter et al. 2000, Merkle & Edelman 2002). Although each of these studies has its limitations, taken together they present a strong case that larger nonresponse rates don’t necessarily signal larger biases. The study by Keeter and his colleagues used a randomized experiment that varied the length of the field period and the number of callbacks in a telephone survey; the two experimental groups differed markedly in response rates (60.6% versus 36.0%), but only 14 of the 91 variables they examined showed significant substantive differences and most of these were quite small. Merkle & Edelman (2002) tracked response rates and overall error in exit polls at sample precincts across four elections. The results indicate virtually no correlation between the two. They argue that the factors that produce nonresponse in exit polls (e.g., whether local election officials allow interviewers to stand near the entrance to the polling place) are completely unrelated to the variable of interest, vote choice. Curtin and his colleagues (2000) looked at the Index of Consumer Sentiment from the Survey of Consumer Attitudes. Using detailed call records data, they were able to simulate the impact of ending efforts to interview sample cases after, say, 5 or 10 callbacks. Again, there were small effects from these large (simulated) changes in the data collection protocol.
These results do not indicate that nonresponse is never a problem, but they do suggest that when the variables of interest are unrelated to the factors that produce nonresponse (as in the exit polls), falling response rates may not be a major worry. Still, it is an article of faith among survey researchers that high response rates are better than low ones, and there is widespread concern that at some point survey results will be rendered wildly inaccurate because of mounting nonresponse. After all, the Literary Digest polls that were based on large but unrepresentative samples did just fine in predicting the outcomes of the presidential elections from 1916 through 1932. It wasn’t until 1936 (when the Literary Digest predicted that Landon would defeat Roosevelt with 57 percent of the vote) that its flaws became spectacularly apparent. The continuing concern that nonresponse will introduce similar errors into contemporary surveys has motivated theoretical and empirical efforts to determine when nonresponse will seriously bias survey estimates.
Theories of Nonresponse
Robert Groves and his colleagues have been leaders in this effort. Groves & Couper (1998), for example, focus on the process by which sample persons decide whether to take part in face-to-face surveys. These decisions are made quite quickly in the brief encounters during which interviewers attempt to persuade the members of the sample to complete an interview; sample persons process the interviewer’s presentation of the survey request using the same heuristics they apply to other persuasive messages on not particularly involving topics (Chaiken 1980, Cialdini 1984, Petty & Cacioppo 1984). Successful interviewers tend to avert a refusal long enough to learn something about the concerns of the sample member and to tailor their presentation of the survey to address those concerns. They highlight whatever features of the survey (its topic or sponsorship) are likely to appeal to the sample person or they explicitly counter any sources of reluctance to participate. According to Groves and Couper, maintaining the interaction and crafting tailored appeals are crucial skills for interviews, skills that can be trained (Groves & McGonagle 2001). Groves et al. (2000) present a more detailed theory of survey participation, the “leverage-salience theory.” According to this theory, different persons assign different values to the different features of the survey highlighted in the survey request (e.g., the topic of the survey, its sponsorship, what the data will be used for, how long the interview might take). Some sample persons may positively value a particular attribute of the survey; others may value the same attribute nega-tively. These values are the “leverages” of the survey’s features for a given person. When the survey is presented to sample members, one of more of its attributes is made salient to them either during the interaction with an interviewer or in the advance letter sent to sample members ahead of time. These momentary saliences determine which attributes persons consider in deciding whether to cooperate; the characteristics of the sample persons help determine the values they place on the salient attributes. Depending on which features of the survey are made salient to them and how they value these features, the sample person may yield to or resist the request to take part.
In an experiment, Groves et al. (2000) examined one feature of the survey request (whether an incentive was offered) and one characteristic of the sample persons (their level of civic engagement) and found the predicted interaction be-tween the two. Among those high on civic engagement, the inherent features of the survey were enough to produce a high level of cooperation and the incentive had little further impact. By contrast, among those with low levels of civic engagement, cooperation was quite low unless a monetary incentive was offered.
NEW MODES OF DATA COLLECTION
Perhaps the most striking change in survey research over the last 25 years or so has been the increasing use of computer-assisted methods for collecting survey data. Traditionally, surveys have relied on three main methods of data
collection—face-to-face interviews (in which interviewers contact the respondents in person, typically at their homes, read them the questions, and record their an-swers), telephone interviews (in which interviewers contact respondents by tele-phone, read the questions to them, and record their answers), and mail surveys (in which the survey researchers mail a paper questionnaire to the respondents, who fill it out it and return it by mail). Each of these methods has been revolutionized by the widespread adoption of computer technologies.
The traditional modes of data collection in fact consist of packages of features, which can on occasion be uncoupled. For example, the traditional mail survey usually involved the selection of the sample from a list (e.g., of the employees at a company), delivery of the questionnaire and other survey materials by mail, use of a paper questionnaire, and follow-up with nonrespondents via further mailings (Dillman 1978, 1991). But this bundling of features isn’t necessary. Some survey organizations have had interviewers deliver paper questionnaires in person for the respondents to complete and return to the interviewer (e.g., Aquilino 1994). This combination of features tended to achieve the high response rates associated with face-to-face interviewing and the increased levels of reporting of sensitive informa-tion associated with self-administered quesinforma-tionnaires. Another variainforma-tion involves mailing electronic questionnaires to the respondents on diskettes, a method referred to as disk-by-mail. This permits the programming of complicated “skip patterns” that allow respondents to navigate easily through complex questionnaires; most self-administered paper questionnaires avoid complex skip instructions (“If yes, go to Section D”) because respondents often have trouble following them (Redline & Dillman 2002). Many surveys, including the decennial census, also use mixed mode strategies; Census 2000 started with a mail questionnaire in most areas, with in-person follow-up visits for those who didn’t mail back their completed census forms in time.
The arrival of a variety of computer-assisted methods for collecting survey data has not only transformed the traditional trio of face-to-face, telephone, and mail surveys but has also created a number of hybrid modes. We focus here on the three methods that are gradually supplanting the traditional methods.
First Phase of the Computer Revolution
The switch from traditional paper questionnaires to computer-assisted methods took place in two phases. The computer-assisted methods introduced during the first phase represented only a modest change from the traditional paper-based methods. For example, computer-assisted telephone interviewing (CATI) was first introduced at Chilton Research Services in 1971 and gradually displaced paper-and-pencil telephone interviews during the 1970s (Fink 1983), but most survey respondents were probably unaware of the change. Instead of reading the ques-tions and recording the answers on a paper questionnaire, interviewers read the questions from a computer screen and entered the answers electronically; once computers got fast enough, there was no reason the respondents would have noticed
any difference. And the scientific evaluations of the switch from paper telephone interviews to CATI suggest that the impact of this phase of the computer revolution on telephone surveys was modest at best. Experimental comparisons of the two methods found small gains in survey cost, timeliness, and data quality from com-puterization (Bergman et al. 1994, Catlin & Ingram 1988, Groves & Mathiowetz 1984). The data quality improvements from CATI mostly take the form of lower rates of missing data (because computers are less prone to inadvertently skip-ping items than interviewers are). In addition, it was now possible to administer more complicated questionnaires via telephone than before because the computer can follow complex routing instructions more readily than unassisted interviewers can.
Once personal computers became light enough (and their batteries would permit a long enough period of operation without needing to be charged), a parallel shift occurred in face-to-face surveys—computer-assisted personal interviewing (CAPI) began displacing paper-and-pencil interviewing beginning in the late 1980s and throughout the 1990s. Although this change may have been more apparent to the respondents—they could see the interviewer’s laptop—the switch from paper to CAPI didn’t seem to have much more of an effect on costs, response rates, the composition of the samples, or the answers the respondents gave than the switch to CATI had (Baker et al. 1995, Martin et al. 1993, Tourangeau et al. 1997).
Mail surveys were the least affected by this first wave of technological change. Some large mail surveys, including the decennial census, adopted optical charac-ter recognition and other advanced technologies for scanning the data in (Blom & Lyberg 1998). Occasionally, surveys sent electronic rather than paper question-naires either on a diskette via regular mail (Downes-Le Guin & Soo Hoo 1994, Olson & Schneiderman 1995) or via e-mail (Couper et al. 1999, Kiesler & Sproull 1986, Saris & Pijper 1986, Schaefer & Dillman 1998). For the most part, though, mail surveys were (and are) still done on paper.
The second phase of the computerization of the data collection process brought about a more revolutionary change—a move away from interviewer administration and toward direct administration of the questions by the computer. This change has had a larger impact on the costs and results of the surveys.
Face-to-Face Interviewing
Face-to-face surveys have had several major advantages over other modes of data collection. They generally achieve higher response rates than telephone or mail surveys; they can incorporate a variety of response aids (such as calendars that help delimit the time period the questions cover or “show cards” that list the answer options for a question) that would be difficult or impossible to use in other modes; unlike mail surveys, they don’t require the respondents to be able to read; and, of course, they feature an interviewer who is on hand to assist the respondents, for example, by answering their questions (though, in many cases, interviewers are trained to give neutral but uninformative answers to respondent queries).
The big drawback to face-to-face interviews is the interviewer. One problem is sheer variability across interviewers, which can be a major source of error in surveys (Groves 1989, chapter 8). In addition, a large body of evidence sug-gests that respondents may be reluctant to disclose sensitive information to an interviewer. Several important national studies collect information on illicit drug use, risky sexual behaviors, and other potentially embarrassing topics, and re-spondents’ reluctance to be truthful about such subjects in face-to-face interviews is a clear limitation of this method of data collection. This problem is not lim-ited to face-to-face interviewing, but affects telephone interviews as well. Some studies find higher levels of reporting sensitive information in face-to-face than in telephone interviews (Holbrook et al. 2003, Johnson et al. 1989; see also de Leeuw & van der Zouwen’s 1988 meta-analysis), but others find the opposite (Hochstim 1967, McQueen 1989), and at least one study reports mixed results in an experimental comparison of the two modes (Aquilino 1994). The advantage of self-administration over either method of interviewer administration is much clearer: Self-administration increases reporting of behaviors that are known to be underreported in surveys (for example, abortions; see Lessler & O’Reilly 1997, Mott 1985) and decreases reports about behaviors that are known to be overre-ported (e.g., attendance at religious services; Presser & Stinson 1998). Moreover, it reduces the discrepancy between men and women in the average number of opposite-sex sex partners they report by lowering the average number reported by men and increasing the average reported by women (Tourangeau & Smith 1996). That men consistently report more opposite-sex sex partners than women do has long been an embarrassment for surveys on sexual behavior (Smith 1992); in the aggregate, the totals for the two sexes should match because men and women are reporting on the same pairings.
So interviewers are both a blessing and a curse. The ideal would be a method of data collection that combines the advantages of face-to-face interviewing with the benefits of self-administration. A first approximation to this ideal was achieved by having the interviewers bring a portable cassette player to the respondents; the cassette played a recording of the questions to the respondents, who provided their answers on an answer sheet that they then sealed in an envelope (Cynamon & Camburn 1992). This methodology retained most of the advantages of face-to-face interviewing (such as high response rates) but minimized the role of the interviewer in eliciting sensitive information. The drawback was that the method didn’t allow for complicated routing patterns; everyone had to listen to and answer all the questions.
As the power and speed of laptop computers continued to increase, it became feasible to have the computer administer the questions, presenting the text of the questions (and the answer categories) on-screen and simultaneously playing a recording of them to the respondents via earphones. The respondents entered their answers using the keypad of the computer. The interviewer was there to set up the computer and to answer questions, but was completely unaware of the respondents’ answers. This new method—known as audio computer-assisted self-interviewing
(audio-CASI)—was developed independently by researchers at the University of Michigan (Johnston & Walton 1995) and the Research Triangle Institute (O’Reilly et al. 1994). It combined all the flexibility and capabilities of computer-assisted interviewing (automated routing, built-in checks for out-of-range values, and so on) with the privacy of self-administration. In addition, as O’Reilly and his colleagues demonstrated, it worked for respondents with limited reading skills.
A series of experimental comparisons has demonstrated the advantages of audio-CASI for the collection of sensitive information over both face-to-face in-terviews (Epstein et al. 2001, Newman et al. 2002, Tourangeau & Smith 1996) and paper self-administered questionnaires (Lessler et al. 1994, 2000; O’Reilly et al. 1994; Turner et al. 1998). Respondents are more willing to admit to symptoms of emotional distress (Newman et al. 2002), episodes of anxiety and depression (Epstein et al. 2001), illicit drug use (Lessler et al. 2000), and abortions (Lessler et al. 1994) under audio-CASI than under other methods of data collection. In addi-tion, men report fewer sexual partners and women report more when audio-CASI is used than under CAPI (Tourangeau & Smith 1996).
Apart from its other virtues, audio-CASI represents the ultimate in standardized interviewing. The questions are read exactly as worded by experienced interviewers (or, in some cases, actors); mispronunciations, hesitations, and other mistakes are left on the cutting room floor. Every respondent receives precisely the same stimulus, delivered in the best possible way. As a result, computer-assisted self-administration appears to eliminate variation across interviewers as a source of error (Tourangeau et al. 1997).
Telephone Interviewing
The telephone analogue to audio-CASI was developed at roughly the same time as the face-to-face version. This method of data collection has been referred to as interactive voice response (IVR), touchtone data entry (TDE), or telephone audio-CASI. We refer to it as IVR, the term used at most market research firms. The various labels refer to the same methodology, in which a computer plays a recording of the questions over the telephone to the respondents, who indicate their answers by pressing the keys on the handset or, more recently, by saying them out loud. IVR systems are now a fixture of contemporary life and are widely used for routine transactions (e.g., for catalog sales, airline reservations, and banking). The initial survey application of the method was to collect data from businesses (Harrell & Clayton 1991, Phipps & Tupek 1990, Werking et al. 1988). Later, surveys of the general population adopted IVR as well (Appel et al. 1992, Blyth 1997, Frankovic 1994, Gribble et al. 2000, Turner et al. 1996). IVR is particularly popular among market researchers, especially for brief interviews. Just as audio-CASI has begun to supplant earlier methods for gathering information in face-to-face settings, IVR may gradually displace other forms of data collection by telephone.
Experimental comparisons indicate that IVR has advantages over interviewer-administered telephone surveys similar to the advantages of audio-CASI over
interviewer-administered face-to-face surveys. IVR elicits higher levels of report-ing of sensitive information, such as drug use (Gribble et al. 2000) or risky sexual behaviors (Turner et al. 1996), than other forms of telephone interviewing; in addition, IVR respondents in customer satisfaction surveys are more willing to complain about the service they’ve received (Tourangeau et al. 2002).
IVR is used in surveys in two different ways. In recruit-and-switch IVR surveys, telephone interviewers contact the respondents, recruit them to take part, and then switch them into the IVR system. In inbound IVR, respondents dial directly into the system themselves. Both variants are prone to the low response rates that characterize telephone surveys more generally. In addition, though, IVR interviews are subject to a form of nonresponse—breaking off—that is relatively rare in surveys with a live interviewer. With the recruit-and-switch version of IVR, many sample cases opt out of the interview during the switch to IVR; with both versions, many cases quit partway through the IVR questions. In one survey, Tourangeau and his colleagues (2002) observed a break-off rate of more than 30%; Cooley et al. (2000) report a rate of 24% in another study. A key factor seems to be the length of the IVR interview; without an interviewer, there are few inducements to finishing the questions and few barriers to quitting. This form of nonresponse adds to the bias from total nonresponse in IVR surveys—that is, it increases the value of E(pn) in Equation 1.
Web Surveys
Profound as the changes are that audio-CASI and IVR have produced, they pale in comparison to the dramatic changes brought on by the emergence of Web surveys. Roughly 60% of the adult population of the United States now has access to the Internet either at home or at work. Web surveys are the third generation of computerized counterparts to mail questionnaires (after disk-by-mail and e-mail surveys), and, like audio-CASI and IVR surveys, they combine the advantages of computerization and self-administration.
Web surveys have their own unique benefits as well. They eliminate the need for interviewers, sharply reducing the cost of data collection as compared to telephone and face-to-face interviews (though not necessarily compared to mail surveys). In addition, Web questionnaires can incorporate rich visual content (still images, diagrams, video clips) that would be difficult or impossible to deliver in a telephone or a mail survey. Given this marriage of low cost and high capabilities, it is hardly surprising that the growth in Web surveys has been explosive. Despite serious concerns about coverage and nonresponse in Web surveys (Couper 2001), the commercial research sector has rapidly embraced the Web for faster and cheaper data collection, and almost daily there are reports of new surveys being conducted over the Internet.
Still, the sampling problems in Web surveys are formidable. A substantial pro-portion of the population still does not have Internet access and those who have access differ substantially from those who don’t, a difference that some observers
have called a “digital divide” (National Telecommunications and Information Administration 2000). Even if the coverage problem weren’t so severe, it would still be extremely difficult to sample Internet users because there is no centralized list of households or persons with Internet access. With dwellings and telephone numbers, there are well-established methods for creating sampling frames and for selecting samples that give complete or nearly complete coverage of the population of interest. With Web surveys, there are no comparable methods yet.
The most ambitious attempt to date to create a representative sample for Web surveys has been carried out by Knowledge Networks, a firm that has created a large panel of households designed to represent the U.S. population. (CentERdata has created a similar but smaller panel in the Netherlands.) Knowledge Networks recruits panel members on an ongoing basis using RDD telephone surveys; re-cruits get WebTV units and free Internet access in exchange for their participation in the panel. In principle, this strategy might yield a representative sample, but several practical problems complicate matters. On its face, the panel provides the same population coverage as any list-assisted telephone sample, omitting approx-imately 7% or 8% of the household population. But the sample omits additional portions of the population because some areas do not have WebTV; these cover-age losses involve about another 7% of the household population. Even worse, sample members have multiple opportunities to avoid participating in the panel. Some households were never contacted for the initial telephone survey or refused to complete that interview; others completed the initial telephone interview but refused to take part in the panel. Still others said they would join the panel, but wouldn’t permit the installation of WebTV, and, for any given survey, some panel participants are unwilling or unavailable to complete the Web questionnaire. The cumulative response rate taking into account nonresponse at these various stages is generally between 20% and 30% (Dennis 2001). Thus, although the panel may have started out as a reasonably representative sample of the general population, the added coverage losses resulting from the need for access to WebTV and cu-mulative effect of nonresponse over the multiple stages of recruitment and data collection yield samples of uncertain representativeness.
Web surveys also raise some new measurement issues. Two rival approaches for the design of Web questionnaires have already evolved—the static (or scrollable) and dynamic (or interactive) approaches. Web surveys descended from mail ques-tionnaires and computer-assisted interviewing and these distinct pedigrees have led to the different design camps. Dillman (2000) (see also Dillman et al. 1998) is the leading advocate of the static approach, which argues for designing Web surveys as electronic versions of mail questionnaires. Web questionnaires embodying this approach typically consist of a single HTML form, with the respondents scrolling through the instrument much as they would page through a paper questionnaire. The questionnaire does not automate the skip instructions or carry out checks for inconsistent or out-of-range answers. Until the respondent presses the “submit” button at the end of the survey, he or she can back up and change answers at will. Web surveys that follow the computer-assisted interviewing tradition are more
interactive in nature. One or more questions are presented on a screen, and re-sponses are transmitted to the server after every question or set of questions. This permits automated skips, range and error checks, and all the other capabilities of CATI or CAPI instruments. Respondents can page back through earlier answers, or the programming can prevent this. Similarly, respondents can be permitted to skip an item or be forced to provide a response to every question.
Norman and his colleagues (Norman et al. 2001) report an experimental com-parison of static and dynamic versions of the same questionnaire. Their results suggest that the static version, which permits rapid scrolling through the question-naire, might be best for some tasks (e.g., entering data from existing records), but the dynamic version might be best for others. But exploration of the issue of the relative merits of each design approach has barely begun.
Web surveys often feature “user-friendly” interfaces to attract potential respon-dents and maintain their interest long enough to complete the questions. The danger is that seemingly irrelevant features of the interface may affect how respondents answer the questions. Nass and his colleagues (Fogg & Nass 1997, Nass et al. 1996, Reeves & Nass 1996) have investigated reactions to computer interfaces that fea-tured recorded voices or line drawings of faces (see also Walker et al. 1994). They argue that computers can trigger reactions from users like those evoked by other people; people sometimes seem to treat computers as if they were social actors rather than as inanimate tools. To the extent that people respond to computers as if they had human characteristics, adding a variety of humanizing cues may offset the benefits of computer-assisted self-administration for items on sensitive topics. Tourangeau et al. (2003) explicitly examined this possibility in a series of experi-ments that varied the characteristics of the interface in Web and IVR surveys. For example, they compared Web surveys that included pictures of and text messages from either a male or a female investigator; similarly, they varied whether an IVR survey used a male or female voice to record the questions. They found little sup-port for the “social interface” hypothesis; respondents gave the same number of socially desirable answers regardless of the “gender” of the interface or the other humanizing characteristics it had. Still, they did find some impact of the interface on responses to a battery of attitude items on sex roles; the answers were, on aver-age, tilted in a profeminist direction when the interface showed pictures of a female investigator or administered the questions in women’s voice than when it displayed a male investigator or used a male voice. Because Web surveys make it easy to add animation, visual images, and other potential humanizing cues, interface designs for Web surveys are likely to remain a lively topic for research.
Theories of Mode Effects
Tourangeau & Smith (1996) (see also Tourangeau et al. 2001) argue that respon-dents give different answers to the same questions under different modes of data collection largely because of underlying differences in three key variables—the degree of privacy the method affords, the legitimacy it confers, and the cognitive
burdens it imposes on the respondents. For example, they argue that audio-CASI is a relatively effective method for eliciting sensitive information mainly because it creates a strong sense of privacy (since the interviewer is unaware of the respon-dent’s answers). In addition, because an interviewer is still present, he or she can provide the respondent with various tokens of the legitimacy of surveys, such as photo ID badges and letters from senior federal officials endorsing the survey. Fi-nally, audio-CASI reduces the burden on working memory by presenting questions both aurally and visually; respondents can review the question text (and answer options) and set their own pace through the questionnaire. By contrast, telephone surveys are less likely to be viewed as private (unless an IVR system administers the questions). Because the questions are only presented aurally, long questions or long lists of answer options may tax the limits of working memory, and the interviewer may hurry the respondents. And respondents may be skeptical about the legitimacy of telephone surveys, confusing them with telemarketing calls (van Leeuwen & de Leeuw 1999). Some results by Moon (1998) suggest that Web respondents may also be concerned about the privacy of their answers; she found that respondents were more likely to give socially desirable answers when they thought a computer across the country was administering the questions than when they thought the computer in front of them was.
Holbrook et al. (2003) emphasize somewhat different variables. They argue that telephone surveys encourage respondents to use satisficing strategies to get through the interview, producing data that are worse than those from face-to-face interviews. Satisficing may take a number of forms in surveys, including nondif-ferentiation (giving similar responses to every item), selecting the “no opinion” or “don’t know” options, or acquiescence (Krosnick 1991, 1999). This difference be-tween telephone and face-to-face surveys may reflect the greater cognitive burden of telephone interviews, lower respondent motivation in that setting, respondent distraction during the interview, or a reduced sense of accountability.
CONCLUSION
Surveys will doubtless continue to evolve rapidly in response to broad movements in the larger society. Like most large-scale human endeavors, surveys are swept up in the tides of technological and social change; most survey innovations are adopted long before there is research evidence from methodological studies regarding their value. Given the proliferation of new modes of data collection, survey researchers are likely to continue to carry out comparisons between modes for some time to come. Several major research programs are already examining the design features of Web surveys as such surveys continue their explosive growth. Another major issue for Web surveys is whether the results can be adjusted statistically to com-pensate for the poor coverage of the total population and the low response rates characteristic of Web surveys (Couper 2001).
One other lively research area worth noting involves the character of the interac-tion that goes on in survey interviews. Some researchers have quesinterac-tioned whether
standardization has gone too far in surveys (Suchman & Jordan 1990). Tradition-ally, interviewers are trained to avoid biasing respondents (Fowler & Mangione 1990), but critics have argued that this means that they don’t offer respondents much in the way of help or clarification. In the face of these criticisms, some researchers have taken a closer look at the interactions that actually take place in face-to-face interviews (Maynard & Schaeffer 2002, Schaeffer & Maynard 1996). Others have experimented with alternatives (dubbed conversational interviews) to the traditional method of standardization (Conrad & Schober 2000, Schober & Conrad 1997). Survey respondents clearly bring with them interpretive habits de-veloped over a lifetime of everyday conversations (Schwarz 1996). Because of the huge cost associated with using interviewers to administer surveys, there is little doubt that researchers will continue to investigate how to make them more effective at collecting survey data.
Survey costs have been a major consideration in all three of the trends discussed here. The possibility of reduced cost was probably the main motivation for the move to list-assisted telephone sampling. Rising costs also impose serious constraints on efforts to maintain survey response rates. And the promise of greatly reduced costs is perhaps the strongest argument in favor of Web surveys. Along with rapid technological change, concerns about the cost of surveys are likely to remain primary forces behind the search for new and better methods to conduct surveys.
ACKNOWLEDGMENT
I am very grateful to Stanley Presser and Mick Couper for their very helpful and encouraging comments on an earlier draft of this chapter.
The Annual Review of Psychology is online at http://psych.annualreviews.org
LITERATURE CITED
Am. Stat. Assoc. 1999. More about telephone
surveys. Alexandria, VA: Sect. Surv. Res.
Methods, Am. Stat. Assoc.
Appel MV, Tortora RD, Sigman R. 1992. Di-rect data entry using Touch-Tone and voice recognition technology for the M3 survey.
Res. Rep. Ser. No. RR-92/01, Bur. Census, Stat. Res. Div.
Aquilino WS. 1994. Interview mode effects in surveys of drug and alcohol use. Public Opin.
Q. 58:210–40
Atrostic BK, Bates N, Burt G, Silberstein A. 2001. Nonresponse in U.S. government household surveys: consistent measures, re-cent trends, and new insights. J. Off. Stat. 17: 209–26
Baker RP, Bradburn NM, Johnson R. 1995. Computer-assisted personal interviewing: an experimental evaluation of data quality and survey costs. J. Off. Stat. 11:415–34 Baumgartner RM. 1990. Telephone answering
machines and completion rates for telephone surveys. Presented at Ann. Meet. Am. Assoc.
Public Opin. Res., May 17–20, Lancaster, PA Bergman LR, Kristiansson KE, Olofsson A, S¨afstr¨om M. 1994. Decentralised CATI ver-sus paper and pencil interviewing: effects on the results of the Swedish labor force surveys.
J. Off. Stat. 10:181–95
Blakely EJ, Snyder MG. 1997. Fortress
Amer-ica: Gated Communities in the United States.
Blom E, Lyberg L. 1998. Scanning and opti-cal character recognition in survey organiza-tions. In Computer Assisted Survey
Informa-tion CollecInforma-tion, ed. MP Couper, RP Baker,
J Bethlehem, CZ Clark, J Martin, et al., pp. 499–520. New York: Wiley
Blyth WG. 1997. Developing a speech recogni-tion applicarecogni-tion for survey research. In
Sur-vey Measurement and Process Quality, ed.
L Lyberg, P Biemer, M Collins, E de Leeuw, C Dippo, et al., pp. 249–66. New York: Wiley Brick JM, Waksberg J, Kulp D, Starer A. 1995. Bias in list-assisted telephone surveys.
Pub-lic Opin. Q. 59:218–35
Casady RJ, Lepkowski JM. 1993. Stratified telephone survey designs. Surv. Method. 19: 103–13
Catlin O, Ingram S. 1988. The effects of CATI on costs and data quality: a comparison of CATI and paper methods in centralized inter-viewing. See Groves et al. 1988, pp. 437–50 Chaiken S. 1980. Heuristic versus systematic information processing and the use of source versus message cues in persuasion. J.
Per-sonal. Soc. Psychol. 39:752–66
Church AH. 1993. Estimating the effects of incentives on mail survey response rates: a meta-analysis. Public Opin. Q. 57:62–79 Cialdini RB. 1984. Influence: The New
Psychol-ogy of Modern Persuasion. New York: Quill
Conrad FG, Schober MF. 2000. Clarifying question meaning in a household telephone survey. Public Opin. Q. 64:1–28
Cooley PC, Miller HG, Gribble JN, Turner CF. 2000. Automating telephone surveys: using T-ACASI to obtain data on sensitive topics.
Comput. Hum. Behav. 16:1–11
Couper MP. 2001. Web surveys: a review of issues and approaches. Public Opin. Q. 64:464–94
Couper MP, Blair J, Triplett T. 1999. A com-parison of mail and e-mail for a survey of employees in federal statistical agencies. J.
Off. Stat. 15:39–56
Couper MP, Nicholls W II. 1998. The his-tory and development of computer-assisted survey information collection methods. In
Computer-Assisted Survey Information
Col-lection, ed. MP Couper, RP Baker, J
Beth-lehem, CZ Clark, J Martin, et al., pp. 1–22. New York: Wiley
Curtin R, Presser S, Singer E. 2000. The effects of response rate changes on the Index of Con-sumer Sentiment. Public Opin. Q. 64:413–28 Cynamon M, Camburn D. 1992. Employing a
new technique to ask questions on sensitive topics. Presented at Ann. Meet. Natl. Field
Dir. Conf., May 17–20, Ft. Lauderdale, FL Daves R. 1990. You know what to do at the beep,
but do survey researchers? Presented at
Mid-west Assoc. Public Opin. Res., Chicago IL de Leeuw E, de Heer W. 2002. Trends in
house-hold survey nonresponse: a longitudinal and international comparison. See Groves et al. 2002, pp. 41–54
de Leeuw E, van der Zouwen J. 1988. Data qual-ity in telephone and face to face surveys: a comparative meta-analysis. See Groves et al. 1988, pp. 283–99
Dennis JM. 2001. Response timing and
cover-age of non-Internet households: data qual-ity in an Internet-enabled panel. Presented
at Ann. Meet. Am. Assoc. Public Opin. Res., May 17–20, Montreal
Dillman DA. 1978. Mail and Telephone
Sur-veys. New York: Wiley
Dillman DA. 1991. The design and administra-tion of mail surveys. Annu. Rev. Sociol. 17: 225–49
Dillman DA. 2000. Mail and Internet Surveys:
The Tailored Design Method. New York:
Wiley
Dillman DA, Gallegos JG, Frey JH. 1976. Re-ducing refusal rates for telephone interviews.
Public Opin. Q. 40:66–78
Dillman DA, Tortora RD, Conradt J, Bowker D. 1998. Influence of plain vs. fancy design on
response rates for web surveys. Presented at
Jt. Stat. Meet., Aug. 9–13, Dallas
Downes-Le Guin T, Soo Hoo B. 1994.
Disk-by-mail data collection for professional popula-tions. Presented at Annu. Meet. Am. Assoc.
Public Opin., May 12–15, Danvers, MA Epstein JF, Barker PR, Kroutil LA. 2001. Mode
effects in self-reported mental health data.