The Toronto Stock Exchange preopening session
∗Ryan J. Davies
†ISMA Centre, University of Reading, Whiteknights, PO Box 242, Reading, UK RG6 6BA
November 14, 2001
Abstract
This paper documents order submission strategies during the Toronto Stock Exchange preopening session. I find that the registered trader (RT) actively participates in the market opening, even though he cannot set the opening price directly, and has no ap-parent informational advantage. RT opening trades are profitable, moderate overnight price changes, and appear to be motivated, in part, by inventory adjustment concerns. I examine interlisted stocks that simultaneously open for trading under two different mech-anisms and show how the comparative levels of pre-trade market transparency of each exchange impacts RT profits and participation.
JEL Classification:G10
Keywords:Registered trader; market transparency; interlisted securities; price discovery.
∗The author is grateful for comments received from Dan Bernhardt, James MacKinnon, Melanie Cao, James
Angel, David Gross, an anonymous referee and seminar participants at: Queen’s, Concordia, Toronto, Vanderbilt, McMaster, the Ontario Securities Commission; the 2000 Northern Finance Association Meetings; and the 2000 Financial Management Association Meetings. All remaining errors are my own.
†Corresponding author. Tel.: + 44 (0)118 931 6117. E-mail address: r.davies@ismacentre.reading.ac.uk (R. Davies).
The Toronto Stock Exchange preopening session
This paper documents order submission strategies during the Toronto Stock Exchange preopening session. I find that the registered trader (RT) actively participates in the market opening, even though he cannot set the opening price directly, and has no apparent informa-tional advantage. RT opening trades are profitable, moderate overnight price changes, and appear to be motivated, in part, by inventory adjustment concerns. I examine interlisted stocks that simultaneously open for trading under two different mechanisms and show how the comparative levels of pre-trade market transparency of each exchange impacts RT profits and participation.
JEL Classification:G10
1 Introduction
This paper examines order submission strategies during the Toronto Stock Exchange (TSE) preopening session. I investigate whether there is evidence of market manipulation, signal-ing, or other forms of gaming during the preopening session. A detailed transactions database allows me to decompose order flow according to different market participant types and thereby focus on the role of the TSE’s designated market maker, the responsible registered trader (RRT) at the market opening. The TSE’s unusual combination of pre-trade transparency and “specialist” intermediation lies somewhere in-between the Paris Bourse’s automated, trans-parent preopening session and the New York Stock Exchange (NYSE)’s non-transtrans-parent, spe-cialist facilitated opening call auction.1 Understanding the role of the RRT at the market opening provides insight into how opening protocols can be designed to incorporate informa-tion efficiently into security prices after the overnight non-trading period.
The theoretical model of Medrano and Vives (2001) provides a useful starting point. They investigate a price discovery process similar to a preopening session and shows that during the beginning of the session an informed trader may deliberately manipulate prices using a contrarian strategy to neutralize the effects of the trades of competitive informed agents. The empirical evidence from the TSE preopening session, however, provides no evidence of market manipulation, signaling, or other forms of gaming. I find that only 5% of inside quote revisions during the preopening result from withdrawn orders, suggesting that most orders are submitted with the intention of being filled. My results suggest that neither the RRT nor other market participants appear to be using locked quotes (highest bid equals lowest ask) or crossed quotes (highest bid exceeds lowest ask) as a signaling device. In an order driven market, locked or crossed quotes can be a common, natural occurrence resulting from the absence of trade.
High levels of pre-trade market transparency and poor incentives for early order submis-sion cause most traders to wait until just before the TSE market opening to submit their
orders. This result is consistent with those found by Biais,et al.(1999) for the Paris Bourse.2 The price volatility caused by the hectic nature of late order submission at the market opening appears to provide an ideal opportunity for the RRT to improve price stability and price effi-ciency. The RRT’s ability to do so, however, is severely limited by exchange rules that penalize orders submitted by the RRT during the last two minutes of the preopening session.
These restrictions on RRT trade mean that, unlike the NYSE specialist, the RRT cannot set the opening price directly.3 The RRT’s incentives to trade at the market opening are reduced further by the TSE’s high level of pre-trade market transparency which appears to eliminate any informational advantage the RRT might have at the market opening. It is perhaps surprising then to discover that the RRT actively trades at the market opening and that, on average, these trades are profitable. To better understand RRT participation in the market opening, I study the following three issues:
1. Motivation for RRT opening trades: I find that RRT opening trades (i) moderate
overnight price changes, (ii) are influenced by the composition of order types submitted during the preopening session, and (iii) may be motivated, in part, by inventory adjust-ment concerns. Surprisingly, some RRTs appear to use the market opening to add to their previously accumulated positions. This suggests that RRTs may take more of a directional stance on the market than commonly acknowledged.
2. RRT trading behavior in interlisted stocks which simultaneously begin
trad-ing under two different market opentrad-ing mechanisms: Recently, more and more
2These results are also consistent with those of Madhavan, et al.(2000) that find an increase in the level of
pre-trade transparency on the TSE in 1990 reduced liquidity and resulted in higher execution costs and increased volatility.
3Madhavan and Panchapagesan (2000), characterizing the low level of pre-trade market transparency on the
NYSE with a “black box,” argue that the opening price set by the NYSE specialist is more efficient than the implied market clearing price. Their analysis, however, cannot determine whether any efficiency gain from specialist intermediation would still exist if other market participants had access to information contained in the limit order book, such as is the case for the TSE. The analysis provided in this paper suggests that the specialist’s contribution to price efficiency may not be solely due to his exclusive knowledge of the limit order book.
stocks are becoming listed on multiple trading venues. This market fragmentation in-creases the likelihood that a security will open for trading simultaneously on different exchanges, each with different opening mechanisms. Market participants should tend to submit their orders to the exchange with lower transaction costs and the optimal level of transparency given the information content of their trades, thereby influencing the loca-tion of price discovery and the relative liquidity of each exchange. The equilibrium out-come may not be obvious, as is demonstrated by experimental studies by Bloomfield and O’Hara (2000).4 To address this issue, I examine interlisted stocks that simultaneously open for trading under two different opening mechanisms, the TSE and a US exchange. A priori, one might argue that the less transparent opening call auction of the NYSE and AMEX should capture more informed order flow and thereby result in a relative informational disadvantage for RRTs assigned to NYSE/AMEX-interlisted stocks. My results, however, suggest that the RRT has lower gross trading revenues at the market opening for all stocks interlisted on a US exchange, including stocks interlisted on the Nasdaq (which has a more transparent pre-trade period). My results also suggest that RRTs assigned to interlisted stocks more aggressively attempt to moderate overnight price changes, possibly in response to competitive pressure from US market makers.
3. Existence of price inefficiencies in a transparent automated opening
mech-anism: Evidence presented in this paper suggests that the RRT takes advantage of
possible price over-reaction to overnight news. Other market participants may not be reacting to these price inefficiencies for several reasons. First, the hectic nature of order submission during the final minutes of the preopening session may prevent the timely submission of orders to exploit apparent imbalances. Second, the monitoring costs may exceed the potentially small, uncertain profits available. Third, the RRT’s ability to “auto-participate” allows the RRT to reverse an opening trade position quickly at more favorable prices. Finally, the RRT may have an informational advantage from talking with other market participants, such as “upstairs traders” employed by the same
mem-4Bloomfield and O’Hara (2000) investigate the conditions under which a transparent market can survive when
ber firm as the RRT.
The paper is organized as follows. The next section outlines the TSE’s institutional fea-tures. Section 3 describes the data and sample selection criteria. Section 4 explores order submission strategies of different market participants during the preopening session. Sec-tion 5 infers which factors influence RRT gross trading revenues and participaSec-tion at the market opening. Section 6 concludes.
2 Institutional Details
The TSE operates as an electronic limit order market with regular trading hours between 9:30AM and 4:00PM. The limit order book is transparent with market depth information dis-played for the top five bid and ask prices. Each actively traded stock is assigned an RRT whose main responsibilities are: (i) to contribute to market liquidity and depth; (ii) to mod-erate price volatility; (iii) to maintain a continuous two-sided market; and (iv) to fill odd lot orders. The RRT is also responsible to fill eligible market orders and tradeable limit orders up to a specified number of shares, the Minimum Guaranteed Fill (MGF), if the order cannot be filled from the order book. As partial compensation for these responsibilities, the RRT can announce his intention to “auto-participate” in any immediately executable order less than MGF-size. After this intention is displayed for market participants, the RRT can purchase (sell) up to 50% of an eligible incoming sell (buy) order (this percentage was recently reduced to 40%). Effectively, this allows the RRT to trade ahead of existing public limit orders. The RRT cannot auto-participate at the market opening.
During 1998, the ten most active member firms participated in over half of the TSE’s total dollar trading volume. This concentration of trading volume is particularly important because of the ability of member firms to internalizeorder flow. After receiving a customer order, a member firm’s “upstairs traders” can hold the order for up to 15 minutes before sending it to the consolidated limit order book. During this time, the order may either be traded with a member firm account (as a principal cross) or traded with another customer order of the member firm (as an agency cross). Smith,et al. (2001) find that while only 3.33% of trades
occur upstairs, these trades represent 56% of the TSE’s total trading volume.
The TSE preopening session operates from 7:00 to 9:30AM. During this time, market par-ticipants can submit market and limit orders for possible execution at the beginning of regular trading. Based on these new orders, the best bid and ask prices are updated and reported to the public. Because orders are not executed until the market opening, there may arise a sit-uation where the highest bid equals the lowest ask (locked quotes) or where the highest bid exceeds the lowest ask (crossed quotes). If there are either locked or crossed quotes, the sys-tem reports a calculated opening price (COP) that is equal to the price at which the largest number of shares will trade. If there are two or more prices at which this will occur, the COP is the price that minimizes the post-opening imbalance, and, if still not unique, it is the price nearest to the previous closing price. The COP is updated throughout the preopening session to reflect the arrival of new orders. In the absence of locked or crossed quotes, the system simply reports a two-sided quote based on the limit order book.
Normally, all securities open for trading at exactly 9:30AM. Market orders, better-priced limit orders, and must-be-filled (MBF) orders5 are all guaranteed execution. After these or-ders have been filled, all possible crosses are executed, giving priority to client oror-ders over non-client orders. Next, client limit orders at the opening price, client at-the-opening (OPG) orders,6and RRT orders (up to a size limit) are allocated, with client orders allocated on aper memberbasis up to a fixed amount and then allocated on apro ratabasis. Finally, remaining limit orders at the opening price and remaining OPG orders are allocated. In effect, these opening trade allocation rules mean that a limit order at the opening price may have a
bet-5Amust-be-filled(MBF) order is an order to buy or sell a security which is part of a basket of stocks being
bought or sold because of the expiry of an offsetting index-based option or futures contract. An MBF order must receive a complete fill at the opening price and has two benefits over a standard market order: (i) it is exempt from the short sale rule; (ii) it allows non-client orders to be entered into the MGF facility. MBF orders must be entered by 5:30PM on the evening before expiration day. This provides sufficient time to advertise net imbalances and thereby attract offsetting order flow prior to the open.
6Anat-the-opening(OPG) order is a special order, available to client accounts, that can participate at the stock’s
opening price, whatever it might be. Unlike a market order, an OPG order does not affect the COP and does not necessarily receive a partial or complete fill.
ter chance of being executed if it is submitted through a larger member firm (because of the higher probability of a cross).
During the preopening session’s last few minutes, traders employed by member firms and RTs may be able to use their superior trading facilities to submit a limit order that slightly undercuts the current COP and thereby receive a larger opening trade allocation. To offset this potential advantage, the TSE adopted ananti-scoopingrule in which any market orders or better price limit orders entered after 9:28AM for non-client accounts that do not change the COP are converted to OPG orders. In effect, these orders are moved to the “back of the line” in terms of opening allocation priority.
3 Data
From the TSE Equity History database, I obtain records of executed trades (board and odd lot) and inside quote revisions for all TSE-listed securities for the period January 1, 1998 to July 31, 1998. Each trade record identifies the member firm(s) involved on both sides of the transaction. Markers indicate whether a trade involved an order for the account of a client, non-client, or registered trader. Non-client orders include orders for the member firm’s inventory, orders for the accounts of partners, directors, officers and employees of the firm, and institutional orders.
Optional alpha-numeric identification codes indicate the specific account for which the or-der was placed and can identify oror-ders placed for a member firm’s inventory account. Member firms assume liability for their inventory account positions and use them to accumulate a large position for possible use in an “upstairs” trade with an institutional client. These up-stairs trades are executed on the exchange as a “put-through” or cross. Member firms can add to their accumulated position either by trading directly with the limit order book or by internalizing order flow.
The trade marker “R” indicates trades that involve orders placed by an RT, although not necessarily an order placed by theresponsibleRT. RTs can, and do, place orders for securities other than those for which they are directly responsible. Trade records involving the
respon-sibleRT can be isolated by restricting attention to records with the appropriate member firm field and alpha-numeric account identification code. Since RRTs have an obligation to fill odd lot orders, RRT field information can be obtained from odd lot trade records.7
3.1 Selection Criteria
I restrict attention to common stocks of Canadian-based companies and exclude securities that were under suspension, securities that were added or eliminated from the TSE stock list at any time during 1998, and securities that had a monthly trading dollar volume less than C$100,000 during any month in the sample period. For convenience, I also exclude any security that changed its symbol during 1998. Of the remaining sample, I focus attention on the largest 140 firms, based on market capitalization as of Dec. 31, 1997. Table 1 reports summary statistics for these firms.
Of the 140 selected firms, 45 were NYSE-interlisted, 5 were AMEX-interlisted, 10 were Nasdaq-interlisted, and 78 were not interlisted on a major US-based exchange. The remaining two changed their US-listing status during the year.8 Interlisted securities play an important role: In 1998, 58.7% of the TSE’s total trading dollar volume was comprised of trading in securities that were also listed on a US-based exchange, and 25% of trading in these stocks occurs in US markets.9
Insert table 1 about here.
The TSE market opening is the most active period of the trading day, accounting for 1.40% and 2.39% of total daily trading volume at the market opening and during the first three min-utes, respectively. These percentages, however, aremuch lowerthan the 9.7% of the NYSE’s total daily dollar trading volume that occurs at the market opening (reported by Madhavan
7I am careful to screen for occurrences when the RRT field information changes, as it might when an approved
backup acts as a substitute to the primary RRT in times of illness or scheduled vacations.
8A change in US-listing status occurs when a firm: (i) becomes listed on a US exchange; (ii) changes theirUS
exchangetrading symbol; (iii) becomes delisted from a US exchange; (iv) transfers to another US exchange.
and Panchapagesan (2000)) and the 8.6% of the Nasdaq’s total daily trading volume that occurs during the first three minutes of trading (reported by Cao,et al. (1997)). These differ-ences may be important for two reasons. First, the lower concentration of liquidity at the TSE market opening may reduce the efficiency of the opening price. This is especially important for smaller, less actively traded firms which depend to a greater extent on the enhanced level of liquidity and the associated reduced transaction costs provided by the market opening. Second, the comparatively low levels of pre-trade order flow on the TSE compared with US exchanges may influence the location of pre-trade price discovery for interlisted securities.
Approximately 79.4% of firm-days have an opening trade, where an opening trade could be either a trade at the normal market opening at 9:30AM or a trade when the stock begins trading after an opening delay. It is worth noting that, as a result of the “automated” TSE opening mechanism, opening delays are relatively rare, occurring on only 2.39% of firm days. In fact, a breakdown of delays into listing status suggests that most of the opening delays are for NYSE-interlisted firms. The NYSE opening is frequently delayed by the NYSE specialist in an attempt to attract order flow from floor traders to offset an opening imbalance. TSE-based trading in NYSE-interlisted firms is frequently delayed until the NYSE opening call auction is complete.
The estimates of RRT gross trading revenues are based on the following assumptions:
1. The RRT begins the sample period with a position of zero in all stocks of responsibility; 2. The RRT closes out his accumulated position at the end of the sample period at the last
recorded transaction price.
Let Kt
i denote the number of trades for security i involving the RRT during trading day t∈[1, T]. Letni(t, k)denote the number of shares of security isold (negative values indicate
purchases) at trade numberk∈[1, Kit]on trading dayt, and letPi(t, k)denote the
correspond-ing transaction price. Average daily RRT gross tradcorrespond-ing revenues in securityiover the sample period are estimated as:
πi= T1 XT t=1 Kt i X k=1 Pi(t, k)ni(t, k) −Pi(T, KT i ) T X t=1 Kt i X k=1 ni(t, k) . (1)
For the purposes of the upcoming time-series cross-section econometric analysis it is useful to calculate a measure of RRT gross trading revenues obtained from opening trades. Since it may not be possible to determine when the RRT reverses a position taken at the market opening (since the reversal may occur out of the sample period or involve numerous trades), I calculate RRT gross trading revenues from opening trades based on the assumption that potential profits/losses are taken at the closing market price. RRT gross trading revenues from opening trades for securityion trading daytare estimated as
πOi (t) = Kt i X k=1 Pi(t, k)ni(t, k)I(t, k)−Pi(t, Kit) Kt i X k=1 ni(t, k)I(t, k), (2)
whereI(t, k)is an indicator function which equals 1 if transactionkon trading daytoccurred at the market opening, 0 otherwise. Average RRT gross trading revenues from opening trades are then estimated as πOi = T1 PTt=1πOi (t).10 I find that RRT gross trading revenues at the market opening and during regular trading hours are positive and that trades at the market opening contribute a significant portion of the RRT’s total gross trading revenues. Mean and median daily gross trading revenues for NYSE/AMEX-interlisted firms are significantly higher than for non-interlisted firms. This reflects the fact that NYSE/AMEX-interlisted firms tend to be larger and more actively traded.
3.2 Composition of Opening Trades
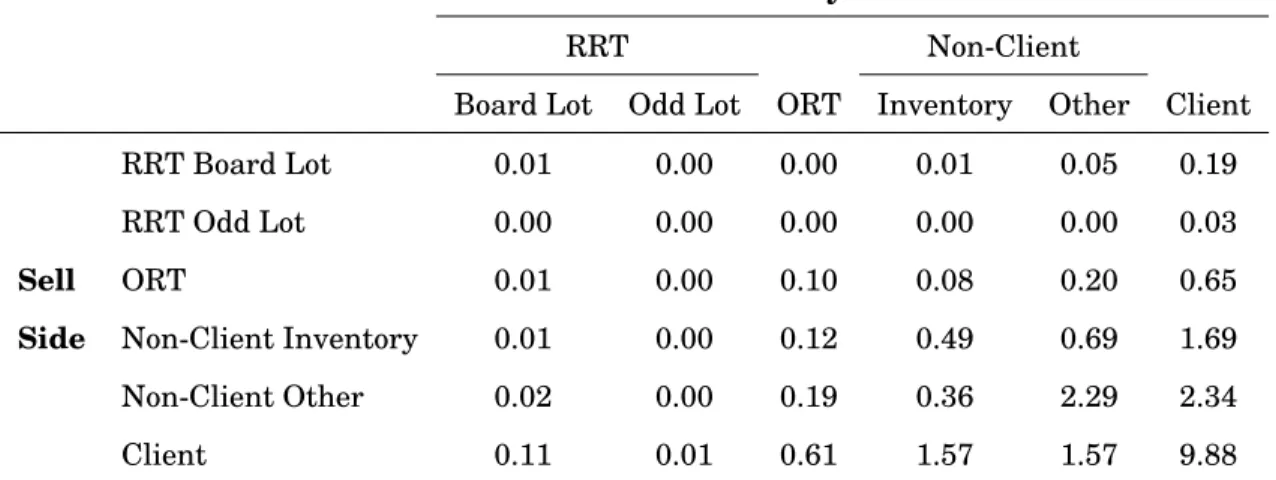
Table 2 classifies opening trade dollar volume11 according to whether it involved the follow-ing six possible order types: (1) RRT board lot; (2) RRT odd lot; (3) registered trader for non-assigned stocks (ORT); (4) non-client (NC) for inventory accounts; (5) non-client (NC) for non-inventory accounts; (6) client. Several observations are worth noting. First, I observe that approximately 23.28% of the opening trade dollar volume involve the same member firm
10It is likely that this measureunderstatespotential RRT gross trading revenues at the market opening, since
in practice the RRT has greater discretion about the timing of when he elects to take potential profits/losses. In the same sense, my measure of average daily gross trading revenues probablyoverstatesthe actual revenues since it assumes the RRT is able to dispose of his potentially large accumulated position at the end of the sample period without any price impact.
11Similar results were obtained when the composition of opening trades was based on the number of
on both sides of the trade. This distinction is important because of the opening trade alloca-tion rule, which dictates that all possible crosses from the same member firm are executed aheadof orders in the limit order book at the opening price. As a result, customers of larger member firms will benefit from the increased likelihood of a cross and thus an opening fill. This order flow also represents order flow that could be internalized by member firms in a more decentralized opening procedure.
Insert table 2 about here.
Next, I observe that non-client orders are involved in about 57.11% of opening trade dol-lar volume. When the analysis is repeated for trades executed during regudol-lar trading hours, non-client orders are involved in a slightly higher percentage, 63.13%, of trading volume. The distinction between the market opening and regular trading hours is more stark, how-ever, when examining the percentage of trades involving non-client, inventory account orders: these orders are involved in 21.8% of opening trade dollar volume compared with 48.12% of trade dollar volume during regular trading hours. Thus, “upstairs” traders have a signifi-cantly less important role at the market opening. Although crosses receive priority at the open, the respective member firm has little control over the opening price (which is deter-mined automatically by the trading system). In contrast, “put-throughs” that are executed during regular trading hours can be executed at a time when the prevailing price may be favorable.
Finally, I observe that the RRT actively participates in the opening. Approximately 8.39% of the total trading dollar volume involves the RRT. Furthermore, a significant majority (71%) of the RRT’s order flow involves board lot trades, which for the most part, represent voluntary participation. Again, it is important to remember that RTs can, and do, place trades for other securities. Surprisingly, RT trade in non-assigned securities (denoted ORT) accounts for ap-proximately 9.96% of the total trading dollar volume. Often, other RTs may be informally “in-vited” by the RRT to absorb large opening imbalances. In a sense, RTs share market-making responsibilities across their assigned stocks. The RRT, however, may face considerable compe-tition for order flow if RT trade in non-assigned securities is largely uninvited. In this sense, it may be more accurate in certain instances to model the TSE using a multiple dealer
envi-ronment. In the next two sections, I examine in greater detail the motivating factors behind RRT participation in the market opening.
4 Order Submission Patterns
This section answers the following three related questions about order submission strategies during the preopening session: (1) Is there evidence of market manipulation? (2) Are locked or crossed quotes a natural feature of preopening sessions or do they play a signaling role? (3) Do traders have any incentives to submit orders early? If the order submission patterns during the market opening provide evidence of market manipulation, signaling, or other forms of gaming, then this suggests that the RRT may be able to moderate these artificial price movements and thereby improve upon the performance of an otherwise purely automated market opening.
Is there evidence of market manipulation? To investigate the possibility of market
manipulation (by the RRT or by other market participants), I determine the percentage of inside quote revisions that indicate that an existing order has been withdrawn. Specifically, I identify inside quote revisions resulting from a withdrawn order by any of: (i) an increase in the bid-ask spread; (ii) no change in a positive bid-ask spread but a decrease in either the bid size or the ask size; (iii) no change in a bid-ask spread of zero but a decrease in the minimum of the bid size and the ask size. Dividing the preopening session into half-hour intervals, I find that the percentage of inside quote revisions resulting from a withdrawn order is: 5.19% between 7:00 and 7:30; 3.25% between 7:30 and 8:00; 8.81% between 8:00 and 8:30; 7.19% between 8:30 and 9:00; and 4.81% between 9:00 and 9:30. Thus, about 95% of all quote revisions lead to an increase in market depth and/or a decrease in the bid-ask spread. In other words, most orders are “serious” and are submitted with the intention of being executed.
Because the potential for market manipulation is influenced, in part, by the financial backing of preopening quotes, I next explore the intraday pattern of quoted market depth available at the inside quote (see figure 1). When the percentage bid-ask spread is less then
2%, I define quoted market depth as the average of the quoted size, in dollar terms, available at the inside bid and at the inside ask. Otherwise, I define quoted market depth as zero.12
Insert figure 1 about here.
Quoted market depth increases throughout the preopening session and reaches its highest level of the day at the market open. After peaking at the market open, quoted market depth drops during the first few minutes of trading as overlapping orders are executed. After this initial drop, quoted market depth gradually rises throughout the day. Average quoted market depth at 8:00AM, for example, is about C$38,500. This suggests that to manipulate the pre-opening price a moderately sized order would be necessary. At the market pre-opening, average quoted market depth surges to over C$173,000. Thus, for these large firms, typical orders from retail customers can be executed with little price impact and without the intervention of the RRT. There are, however, considerable differences in pre-trade market depth across firms and across trading days. For example, the next 140 largest firms by market capitalization, after the 140 included in this study, have an average quoted market depth of just C$3,855 at 8:00AM and C$27,220 at the market opening. Because a relatively small order could alter these preopening quotes, smaller firms could be more easily subject to pre-trade price manip-ulation. Despite this, there is no evidence of more withdrawn quotes for smaller firms. The low pre-trade market depth for smaller firms confirms that the role of the RRT as a liquidity provider is much more important for smaller, less actively traded firms.
Are locked or crossed quotes a natural feature of preopening sessions or do they
play a signaling role? Price discovery during the TSE preopening session frequently occurs
in an environment with locked or crossed quotes. When there are locked or crossed quotes, a single indicated price (the COP) is posted based on the algorithm described in section 2.13 Figure 2 illustrates that locked or crossed quotes are common and their likelihood rises as the market opening approaches.
12Although this measure provides a useful proxy for the actual depth available, it is important to note that it
does not make any allowances for depth that might exist a single tick size away from the inside quote nor does it account for hidden liquidity available from the upstairs market or from the RRT’s MGF requirements.
Insert figure 2 about here.
In the absence of trades, locked or crossed quotes are a defining characteristic of most preopening sessions. Cao, et al. (2000) find that locked and crossed inside quotes account for 11.3% and 23.6% of market quotes during the Nasdaq pre-trade period. They argue that Nasdaq dealers use locked and crossed inside quotes to signal to other market makers which direction the price should move.14 Because these quotes are non-binding, dealers can revise them frequently up until the market opening. Signaling, however, cannot explain the pattern of locked or crossed quotes on the TSE: preopening quotes on the TSE are driven by orders, not dealer quotes, and these orders are rarely revised or withdrawn prior to the market opening. Thus, neither the RRT nor other market participants appear to exhibit the sort of strategic behavior suggested by the theoretical model of Medrano and Vives (1998).
Also, note that in contrast to the TSE, Cao, et al. (2000) observe that the frequency of locked and crossed quotes falls as the opening approaches on the Nasdaq. This is because the Nasdaq trading guidelines mandate that during the last few minutes of the pre-trade period, dealers are suppose to make every effort to resolve locked or crossed quotes. This further highlights the important difference between the preopening sessions of quote driven and order driven markets.
Do traders have any incentives to submit orders early? Biais, et al. (1999) examine
the process of price discovery and learning during the Paris Bourse preopening period. They find that due to the high level of market transparency and the ease with which orders can be cancelled, traders are unwilling to submit the most informative orders until just prior to the market opening. Similar results are found for the TSE as shown in figure 2. It illustrates the average number of inside quote revisions per one minute interval during the preopening session. An inside quote revision is defined as a change in the price and/or size at the inside bid or ask. In the first few minutes, there is a small surge in quote revisions that may be attributed to the submission of new orders that arrived at member firms during the overnight
14Aggarwal and Conroy (2000) also argue that wholesalers, in particular, may initially enter a bid higher than
the best ask in the hope of getting other market makers to adjust their quotes during the preopening period of a Nasdaq initial public offering.
non-trading period. These orders may have been submitted early to attempt to take advantage of the ability of an order to establish priority up to a maximum number of shares by either being the first order to set a better bid or ask price or being the only order remaining on the bid or offer when all competing orders are cancelled or filled. A more likely explanation, however, is that these orders are just small retail orders submitted by investors who find it more convenient to trade after normal working hours.
Figure 2 also illustrates that quote revision accelerates every minute up to and including the last minute of the preopening session. A large number of traders literally wait until the last minute to submit their orders despite potential communication-related problems that might prevent their timely arrival.
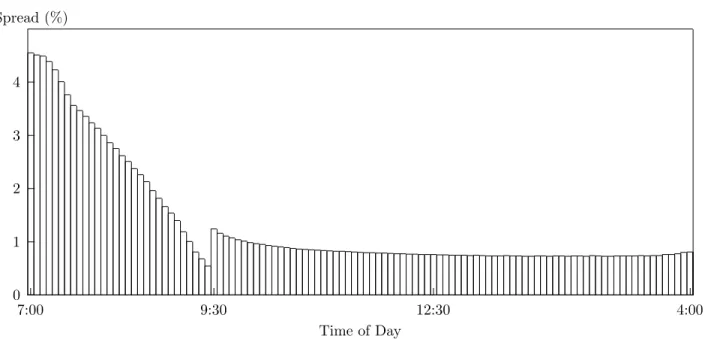
Insert figure 3 about here.
Despite the paucity of early order submissions, figure 3 illustrates that the percentage bid-ask spread narrows throughout the preopening session, with the narrowest spreads of the day occurring just prior to the open. As regular trading hours begin, spreads first widen as these orders are executed and then gradually narrow during the remainder of the trading day. The rapid quote revision at the end of the preopening session could be advantageous to traders with the ability to take advantage of any favorable opening imbalances. The TSE’s anti-scooping rule is designed to compensate for this by penalizing non-client orders submit-ted during the last two minutes of the preopening session. An important consequence of this rule, however, is that the RRTcannotsubmit orders during the last two minutes of the pre-opening session and is thus limited in his ability to reduce possible pre-opening price inefficiencies caused by the hectic nature of the market opening. This is investigated further in the next section.
5 Registered Trader Participation
Why does the RRT actively participate in trades executed at the market open? RRT partic-ipation is especially puzzling given that: (i) the high level of pre-trade market transparency
suggests that the RRT does not have a large informational advantage relative to other market participants; and (ii) the RRT cannot set the opening price directly and must submit orders prior to 9:28AM in order to influence the opening price. I now proceed to address this puzzle.
RRT participation in the market opening may be motivated by the following factors:
1. Desire to moderate overnight price changes: The performance of RRTs is evaluated,
in part, on their ability to maintain price stability. Exchange guidelines recommend that at least 70% to 80% of RRT trades in their stocks of responsibility should be stabilizing or neutral trades.15 An RRT’s performance evaluation impacts whether he/she is assigned responsibility for more desirable stocks in the future. To promote price stability, I expect that the RRT attempts to moderate overnight price changes by assuming an offsetting opening position. In general, I expect the probability of RRT participation to increase with the size of the overnight price change.16
2. RRT inventory adjustment: The deep market at the open provides ideal conditions
for the RRT to unload an unwanted inventory position (short or long) without unnecessarily disturbing the market. A priori, one might expect that the larger the RRT’s inventory position, the more likely that the RRT would want to trade in order to unwind the position. Summary statistics, however, suggest that this logic may be incorrect. I calculate a proxy for RRT inven-tory positions by assuming that the RRT begins the sample period with a position of zero in all stocks of responsibility and then adding or subtracting to the RRT’s position based on each of his trades thereafter. The value of the position is based on the last recorded transaction price. At the end of the sample period, RRT inventory positions are less than C$500,000 for 40.6% of firms, between C$500,000 and C$1,000,000 for 17.4% of firms, between C$1,000,000
15An exemption from these stabilization requirements is provided for RRTs dealing in all US-based interlisted
issues and in those Canadian-based interlisted issues in which more than 25% of the trading occurred in the US in the preceding year.
16To control for possible endogeneity issues, I estimate the overnight price change in the absence of RRT trade
using the indicated opening price at 9:25AM. The arbitrary 9:25AM cut-off was selected based on anecdotal evi-dence that the RRT has the incentive to delay submitting an order so as to take advantage of economic information and order imbalances that may develop during the preopening session. In addition, the RRT’s superior access to market trading facilities eliminates incentives to submit an order early because of possible communication related problems.
and C$2,000,000 for 13.0% of firms, and greater than C$2,000,000 for 29.0% of firms. While these positions may be partially offset by other positions held in liability accounts of the RRT’s member firm, it does suggest that the RRT frequently takes a position in his stocks of respon-sibility based on his expectations about future prices.
In addition to considering the RRT’s accumulated inventory position, I also consider the daily change in the RRT’s inventory position (or his “trade imbalance”). This variable is mo-tivated by the belief that the RRT begins each day with his desired inventory position in his stocks of responsibility. During the day, the RRT is required to make trades in order to fulfil his minimum guaranteed fill and price stability obligations. As a result, by the end of the trad-ing session, the RRT’s inventory position may become too large/small relative to his desired level. The liquidity provided by the market opening may provide an ideal opportunity for the RRT to re-adjust his position. RRT trade imbalances are C$0 for 2.5% of firm-days, between C$0 and C$50,000 for 66.1% of days, between C$50,000 and C$100,000 for 13.9% of firm-days, between C$100,000 and C$150,000 for 6.2% of firm-firm-days, and greater than C$150,000 for 11.4% of firm-days. Thus, despite the apparent existence of large accumulated positions, on a daily basis, RRT trades tend to net out to close to zero.
3. Composition of order flow: The RRT may be more likely to participate at the
mar-ket opening when opening order flow contains more liquidity-motivated orders. One signal to the RRT about the potential information content of trades might be the proportion of opening order flow involving non-client orders since they provide a good proxy for the level of insti-tutional trade in a security. On the one hand, large instiinsti-tutional orders may create opening imbalances that the RRT can profitably take advantage of. On the other hand, the RRT may be less likely to participate to the extent that institutional trading is more informed.
4. Competitive response to the presence of competing US market makers and
alternative opening mechanisms:To attract order flow away from US exchanges, an RRT
responsible for an interlisted stock may be more likely to participate at the open in an attempt to reduce transaction costs by moderating price volatility and improving liquidity. This effect is not clear, however. For example, Bacidore and Sofianos (2002) find that the NYSE specialist participatesless actively during regular trading hours for Canadian-based interlisted stocks
compared with similar US-based non-interlisted stocks. Also, the RRT may reduce participa-tion in interlisted stocks if informaparticipa-tion revelaparticipa-tion and pre-trade price discovery tends to occur on the US exchange, thereby placing the RRT at a potential informational disadvantage.
5. Index option expiration days:Upon the expiration of index-based option and futures
contracts, it is common for traders to purchase an offsetting quantity of the underlying securi-ties using the MBF order described earlier. Because these trades are relatively price inelastic, the RRT may participate more actively on these days so as to exploit possible “artificial” order imbalances.
Let P ART ICitequal 1 if the RRT participated in a trade in firmiat the market opening of trading dayt (observablein data); 0 otherwise. Let U∗
it indicate the unobservablebenefit
from RRT participation in opening trades of firmion trading dayt. RRT participation at the market opening is modelled as:
U∗ it= ξ0+ξ1 ¯ ¯ ¯ln³PO i,t/Pi,tC−1 ´¯¯ ¯+ξ2|P OSit|+ξ3|∆P OSit|+ξ4N Cit+ξ5DV OLi +ξ6Dny/axi +ξ7Dinz+ξ8Ditex+vit, P ART ICit= 1 ifUit∗ >0, and0otherwise.
(3)
fort= 1, ..., T andi= 1, ..., N. The variables are defined as: 1. PO
i,t is the average of the inside bid and ask prices posted at 9:25AM on trading daytfor
stocki.PC
i,t−1is the average of the inside bid and ask prices posted at the close of trading
dayt−1for stocki.
2. P OSit is the RRT’s accumulated inventory position in stock i resulting from all of his
trades from the start of the sample period up to the close of trading dayt−1, evaluated at the closing share price of trading dayt−1(in C$10,000,000s). This measure is only a proxy for the RRT’s actual inventory position since it assumes the RRT begins the sample period with a position of zero in all stocks of responsibility. ∆P OSitprovides the
change in the RRT’s inventory position (or his “trade imbalance”) in stockion trading dayt−1.
3. N Citindicates the share of opening trade volume, excluding RRT trade volume, on trad-ing daytfor stockiinvolving a non-client order.
4. DV OLi is the average daily dollar volume traded for firm i (in C$10,000,000s). This
variable is included in the model in order to capture the sense that more actively traded firms are more likely to have an opening trade, which increases the probability that the RRT will be required to participate at the market opening to fulfill his odd lot and minimum guaranteed fill obligations.
5. Diny/axandDnz
i are dummy variables indicating whether the stockiis interlisted on the
NYSE /AMEX and Nasdaq, respectively. The base case is a non-interlisted stock.17 6. Dex
it is a dummy variable that equals 1 on index expiration days for stocks included in
the TSE 35 Composite Index; 0 otherwise.
I consider two possible specifications of the unobservable error term,vit: a random effects
probit model and a pooled probit model. The random effects probit model allows for non-observable heterogeneity across firms. Under the assumption that the heterogeneity across firms is time-invariant, the error term is vit = αi +uit where αi denotes the firm specific unobservable effect and uit is a disturbance. It is assumed that uit ∼ IN(0, σu2) with uit
in-dependent of the other explanatory variables. The random effects probit model treatsαi as
random, with αi ∼ IN(0, σα2) and independent of uit and the explanatory variables. This
implies the correlation between two successive error terms for the same firm is a constant, ρ =corr(vi,t+1, vi,t) = σ
2 α σ2
α+σ2u. This represents the proportion of the observed total variance of
the error term accounted for by unobserved heterogeneity. The pooled probit model estimates the model under the assumption thatρ= 0and thus ignores the panel nature of the data.
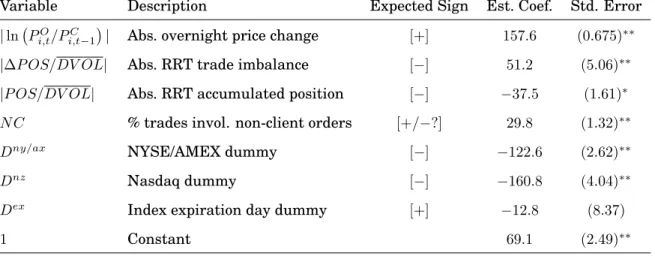
Insert table 3 about here.
Table 3 summarizes the predicted signs of the estimated coefficients and reports the cor-responding estimation results. Generally, the random effects and the pooled probit models produce similar estimates. The estimate of ρ suggests that there is significant unobserved heterogeneity. The probability of RRT participation at the open:
• Rises with the size of the overnight price change.
• Rises with the size of the average daily trading dollar volume.
• Is increasing in the share of opening trades involving a non-client order (this suggests that the RRT is often more concerned about taking advantage of possible order imbal-ances than the information content of the opening trades).
• Is not significantly different on index expiration days than on other trading days. • Does not depend on the size of the RRT trade imbalancefrom the previous session. The
pooled probit model provides some evidence that an RRT with a larger accumulated position is more likely to participate at the market opening.
The random effects probit model provides some evidence that an RRT assigned to NYSE/AMEX-interlisted stocks is less likely to participate at the market opening. The less transparent opening call auction used by the NYSE and AMEX causes the RRT to observe only part of the total opening order flow of a NYSE/AMEX-interlisted stock. As a result, the RRT has incomplete information concerning how the market is going to adjust prices to reflect new information accumulated overnight. This informational disadvantage is compounded by the tendency of informed order flow to be sent to the less transparent exchange. The RRT reduces his participation at the market opening in NYSE/AMEX-interlisted stocks to avoid exposing himself to the risk of potential losses resulting from an unexpectedly high or low NYSE/AMEX opening price. In contrast, the estimated Nasdaq-interlisted dummy variable coefficient is in-significant for both models. Because the RRT can view Nasdaq preopening quotes, he is less likely to expose himself to the risks associated with an unexpected Nasdaq opening price.
The reported results illustrate factors affecting RRT participation in both board and odd lot trades at the market opening. Since RRT participation in odd lot trades is mandatory, I also investigate whether the results differ if attention is restricted to board lot trades which are more representative of voluntaryRRT participation. Specifically, the model is re-estimated usingP artic = 1if the RRT participated in aboard lottrade at the market opening,0 other-wise. For the most part, the estimated coefficients are similar in magnitude and significance and are therefore not reported here.
be motivated by: (i) a desire to improve overnight price stability; and (ii) a desire to unwind an inventory position. To investigate whether the economic intuition provided earlier is con-sistent with observed RRT behavior, I estimate the following model:
RT OP Nit=ω0+ ln à PO i,t PC i,t−1 ! [ω1+ω2Dny/axi +ω3Dinz] +ω4 P OSit DV OLi +ω5∆P OSit DV OLi +εit, (4) E³ε2it´=σi2, E(εitεjt) =σij, εit=ρiεi,t−1+vit, E(vit) = 0, E(vitvjt) =φij, E(vitvjs) = 0fort6=s, E(εi,t−1vjt) = 0; i= 1, . . ., N and t= 1, . . ., T
where the variable RT OP Nit denotes the RRT’s net opening position for firm i on trading
daytas a share of daily trading volume (scaled by100,000). The other variables are as defined before. The model allows for cross-section heteroskedasticity, first-order autoregressive errors, and contemporaneous cross-section correlation. I include the interlisted dummy variables as multiplicative terms with the price change in order to examine whether the presence of competing market makers makes the RRT more or less likely to moderate price volatility.
A priori, I expect thatω1<0if the RRT is moderating price volatility and thatω4 <0and
ω5 <0if the RRT uses the open as an opportunity to re-adjust his inventory position. I expect
thatω2<0andω3 <0if an RRT assigned to an interlisted stock more aggressively (in terms of
trade size) attempts to moderate overnight price changes. As reported in table 4, the estimates ofω1, ω2 and ω3 are significant and negative. Thus, RRT trades tend to moderate overnight
price changes and this tendency is more important for interlisted stocks. This suggests that the RRT may be responding to competitive pressure from US market makers. The coefficients ω4 and ω5 are significant but of opposite signs. At the market opening, the RRT partially
unwinds a position obtained during the previous trading session. In contrast, an RRT with a large accumulated position (acquired over several sessions) appears to be more confident about the stock’s future price direction and thus is more likely to trade in order to add to the position.
Insert table 4 about here.
What factors contribute to RRT gross trading revenues at market opening? To
I estimate the model: πO it DV OLi = η0+η1 ¯ ¯ ¯ ¯ln µ PO i,t PC i,t−1 ¶¯¯ ¯ ¯+η2 ¯ ¯ ¯DV OLiP OSit ¯ ¯ ¯+η3 ¯ ¯ ¯∆ P OSit DV OLi ¯ ¯ ¯+η4N Cit +η5Diny/ax+η6Dinz+η7Dexit +εit, (5) E³ε2it´=σi2, E(εitεjt) =σij, εit=ρiεi,t−1+vit, E(vit) = 0, E(vitvjt) =φij, E(vitvjs) = 0fort6=s, E(εi,t−1vjt) = 0; i= 1, . . ., N and t= 1, . . ., T
whereπOit indicates the estimate of gross trading revenues from the RRT’s opening trades in firm ion trading day tusing equation (2) and the other variables are defined as before. To allow comparisons across the cross-section of firms, I adjust RRT trading profits, RRT trade imbalance, and RRT accumulated position by the average dollar trading volume of the stock.
The motivation is as follows. I expect thatη1 >0 if the RRT takes advantage of potential price over-reaction resulting from news released during the overnight non-trading period. I expect thatη2 <0andη3 <0if the RRT sacrifices potential trading revenues in order to avoid
further increasing his long/short inventory position. TheN Cvariable establishes whether or not RRT profits depend on the level of institutional activity in the security at the open. On the one hand, I expect thatη4 > 0 if the RRT benefits from potential artificial order imbalances
created by larger institutional orders. On the other hand, I expect thatη4 < 0 if non-client
orders have higher information content and thereby reduce the RRT expected profits at the market opening. I expect that η5 < 0 and η6 < 0 if the RRT’s ability to trade profitably is
hindered by the presence of competing market makers and alternative opening mechanisms for interlisted stocks. Finally, I expect thatη7 >0if the RRT can profit from artificial opening
imbalances on index expiration days. These imbalances are caused by price inelastic orders submitted to offset an expiring index-based option or futures contract.
Insert table 5 about here.
The estimation results reported in table 5 are summarized as follows:
• The magnitude of overnight price changes has a significant positive impact on RRT profits at the open. Often, when bad (good) news is announced during the overnight non-trading period, a flood of sell (buy) orders arrives during the preopening session.
Without RRT intermediation, this opening imbalance would cause a price over-reaction at the open. The RRT, recognizing the imbalance, can take an offsetting position which will be profitable when the price partially reverts back during the trading session. In this manner, the RRT moderates price volatility at the open.
• The absolute value of the RRT’s trade imbalance from the previous trading session has a significant, positive impact on RRT gross trading revenues at the market opening. In contrast, the absolute value of the RRT’s accumulated position has a significant, neg-ative impact on RRT gross trading revenues at the market opening. While this result is difficult to interpret, one possible interpretation is that a larger imbalance from the previous session may have been caused by a large price movement. If this price move-ment was not based on fundamove-mentals, the RRT may be able to further profit from this deviation at the market opening.
• The percentage of opening trade volume involving non-client orders has a significant, positive impact on RRT profits.
• RRT profits are significantly lower for stocks interlisted on a US exchange. This result holds irrespective of the comparative level of pre-trade market transparency of the US exchange.
• Index expiration days are not significantly different from other trading days with respect to RRT gross revenues at the market opening.
Given the high level of transparency on the TSE, it seems a bit surprising that the RRT is able to gain consistent positive trading revenues at the opening despite the apparent ability of other market participants to also profitably take advantage of these opportunities. There are four possible explanations: First, the RRT can use his ability to auto-participate to un-load quickly accumulated inventory positions acquired at the market opening at more favor-able prices than availfavor-able to other market participants. Second, the RRT may gain special insight from “upstairs” traders employed by the same member firm about upcoming large in-stitutional orders. Third, communication-related difficulties and the hectic nature of order
submission during the final minutes of the preopening session may prevent the timely sub-mission of orders to exploit apparent imbalances. Finally, the potential profits are generally small and may not be sufficient to compensate other participants for their monitoring costs.
Firm size: This study has focused on the largest, most actively traded stocks listed on
the TSE. Results obtained, but not reported here, show that the pattern of pre-trade order submission is similar across all firm sizes. Thus, my results are not being dominated by a single actively traded firm. Clearly, smaller, less actively traded firms have wider preopening quotes and much less market depth. This suggests that the RRT’s role at the market opening is relatively more important for these firms.
Firm-by-firm estimation: To ensure that the cross-sectional nature of the data does not
conceal important differences in RRT behaviour across firms, I report the results of a firm-by-firm estimation analysis in the appendix. These results confirm that the RRT’s desire to moderate overnight price changes is an important motivating factor in RRT participation in the market opening and in the direction of RRT opening trades. The firm-by-firm results suggest that, conditional on RRT participation in the market opening, the explanatory vari-ables considered here may have weak power in their ability to explain fully RRT gross trading revenues at the market opening.
Summary of estimation results: For clarity, I summarize the most important
estima-tion results obtained in this secestima-tion:
• RRT opening trades actively moderate overnight price changes. The larger the overnight price change, the higher the likelihood of RRT participation at the market opening. • RRTs assigned to interlisted stocks trade more aggressively in the opposite direction of
overnight price changes, possibly in response to competition from US market makers. As well, RRTs assigned to interlisted stocks typically have lower gross trading revenues from opening trades. The relative level of pre-trade transparency of the US exchange appears to make little difference.
• The price inelastic orders submitted on index expiration days neither increase the likeli-hood of RRT participation nor increase RRT gross trading revenues at the market
open-ing. This suggests that advertised MBF order imbalances posted on the evening prior to index expiration days are effective in attracting offsetting interest from other market participants.
• RRT participation and RRT gross trading revenues are increasing in the percentage of trades involving non-client orders. This suggests that the RRT may benefit from artificial order imbalances caused by typically larger institutional orders or that the RRT may receive advance warning about upcoming institutional orders from “upstairs traders” of the RRT’s member firm.
• RRTs use the market opening to unwind positions accumulated during the previous trading session. In contrast, however, RRTs with large positions that they have accu-mulated over several trading sessions tend to add to these positions, even though it is not profitable in the short-run. This suggests that RRTs may be taking a stance about the future price direction of the stock.
6 Conclusion
Prior to this study, the role of a market maker, such as the RRT, in the opening price discovery process of a highly transparent financial market was not well understood. The detailed TSE transactions database provided an ideal opportunity to examine this environment. The main conclusions of the paper can be summarized as follows:
1. There is little evidence either of market manipulation or of using locked or crossed quotes as a deliberate signaling tool during the preopening session.
2. The RRT actively participates in the TSE preopening session despite not being able to set the opening price directly and not having exclusive knowledge of the limit order book. RRT opening trades are profitable and are able to take advantage of possible price over-reaction to overnight news. The direction of RRT opening trades may be partially motivated by a desire to reverse trade imbalances acquired during the previous trading session.
3. RRTs assigned to interlisted stocks respond to competition from US market makers. RRT trading profits at the market opening are lower for interlisted stocks and RRTs assigned to interlisted stocks more aggressively attempt to moderate overnight price changes. Little evidence is provided to show that RRT trading behavior in interlisted stocks that simultaneously begin trading under two different opening mechanisms de-pends on the relative levels of pre-trade transparency.
4. Overall, there appears to be a limited role for a specialist, or RRT, in an automated, transparent preopening session. The RRT’s superior trading facilities, access to infor-mation about upcoming trades from “upstairs traders” and ability to auto-participate (and thereby quickly adjust inventory positions) seem to allow the RRT to take advan-tage of artificial opening order imbalances and thereby improve opening price efficiency.
References
Aggarwal, R. and P.Conroy, 2000, Price Discovery in Initial Public Offerings and the Role of the Lead Underwriter, Journal of Finance 55(6), 2903–2922.
Bacidore, J.M. and G. Sofianos, 2002, Liquidity provision and NYSE specialist trading in NYSE-listed non–U.S. stocks, Journal of Financial Economics 63(1), forthcoming.
Biais, B., P. Hillion, and C. Spatt, 1999, Price Discovery and Learning during the Preopening Period in the Paris Bourse, Journal of Political Economy 107(6), 1218–1248.
Bloomfield, R. and M. O’Hara, 2000, Can transparent markets survive?, Journal of Financial Economics 55(3), 425–459.
Cao, C., H. Choe, and F. Hatheway, 1997, What is Special about the Opening? Evidence from NASDAQ, Seoul Journal of Business 3(1), 1–36.
Cao, C., E. Ghysels, and F. Hatheway, 2000, Price Discovery without Trading: Evidence from the Nasdaq Pre-opening, Journal of Finance 55(3), 1339–1365.
Domowitz, I. and A.H. Madhavan, 2001, Open Sesame: Alternative Opening Algorithms in Securities Markets, in: R. Schwartz, ed., The Electronic Call Auction: Market Mechanism and Trading - Building A Better Stock Market (Kluwer Academic Publishing), forthcoming. Heckman, J.J., 1979, Sample Selection Bias as a Specification Error, Econometrica 47(1), 153– 161.
Madhavan, A.H. and V. Panchapagesan, 2000, Price Discovery in Auction Markets: A Look Inside the Black Box, Review of Financial Studies 13(3), 627–658.
Madhavan, A.H., D. Porter, and D. Weaver, 2000, Should securities markets be transparent?, University of Southern California Working Paper.
Medrano, L.A. and X. Vives, 2001, Strategic behavior and price discovery, RAND Journal of Economics 32(2), 221–248.
Smith, B.F., D.A.S. Turnbull, R.W. White, 2001, Upstairs Market for Principal and Agency Trades: Analysis of Adverse Information and Price Effects, Journal of Finance 56(5), 1723– 1746.
A Appendix
Firm-by-firm analysis: The cross-section time-series estimation results reported in the
pa-per may conceal important differences in the behavior of RRTs assigned to different firms. To verify the results, I conduct a firm-by-firm estimation procedure. It is important to note that such a procedure haslessstatistical power, since it discards important information about relationships among the firms. One benefit of this procedure, however, is that it allows me to use the two-step procedure proposed by Heckman (1979) to estimate the factors influenc-ing the direction of RRT trades and RRT gross tradinfluenc-ing revenues while correctinfluenc-ing for possible sample selection bias induced by the RRT’s decision about whether or not to participate at the market opening.
The notation remains the same. For each firm, the following probit model of RRT partici-pation is estimated: U∗ t = ϕ0+ϕ1 ¯ ¯ ¯ln³PO t /PtC−1 ´¯¯ ¯+ϕ2¯¯¯DV OLP OSt ¯ ¯ ¯+ϕ3¯¯¯∆P OSt DV OL ¯ ¯ ¯+εt, εt∼N(0,1), P ART ICt= 1 ifU∗ t >0, and0otherwise. (6)
fort = 1, ..., T. From the estimated probit models, I obtain the estimated Inverse Mill’s Ra-tio,18 denoted λˆt. I then restrict the sample to trading days in which the RRT participated in an opening trade. Based on this sub-sample, I estimate using ordinary least squares the following regression model of the direction of RRT opening trades:
RT OP Nt=γ0+γ1ln à PO t PC t−1 ! +γ2 P OSt DV OL +γ3 ∆P OSt DV OL +γ4ˆλt+εt. (7) I then use the same approach to estimate, using ordinary least squares, the following regres-sion model of RRT gross trading revenues at the market opening:
πO t DV OL =ζ0+ζ1 ¯ ¯ ¯ ¯ ¯ln à PO t PC t−1 !¯ ¯ ¯ ¯ ¯+ζ2 ¯ ¯ ¯ ¯DV OLP OSt ¯ ¯ ¯ ¯+ζ3 ¯ ¯ ¯ ¯∆DV OLP OSt ¯ ¯ ¯ ¯+ζ4λˆt+εt. (8)
The estimated coefficients are summarized in table 6. To ensure that the probit model can be properly estimated, I exclude eleven firms for which the RRT either participated on less
18The estimated Inverse Mill’s Ratio is defined asφ(X0
tβˆ)/Φ(Xt0βˆ)whenP ART ICt= 1andφ(Xt0βˆ)/(Φ(Xt0βˆ)−1) whenP ART ICt= 0, whereβˆis a vector of estimated coefficients,Xtis the vector of datetexplanatory variables, φis the standard normal density function andΦis the cumulative normal density function.
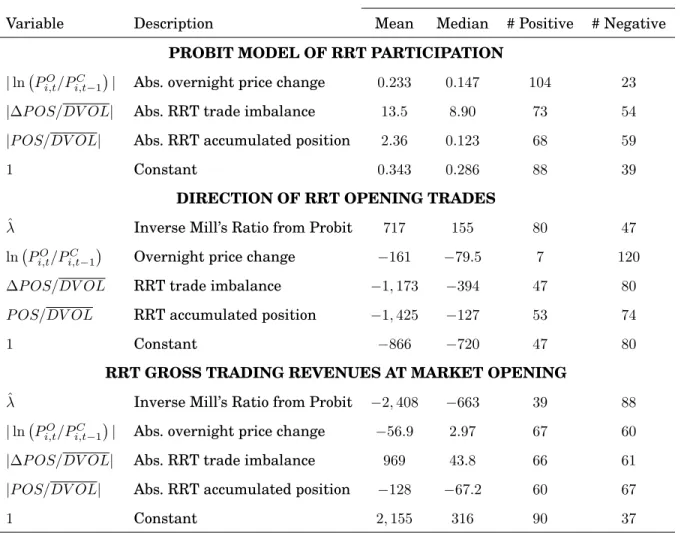
than six trading days or participated on more than 141 trading days. The results can be summarized as follows:
Probit model of RRT participation: With 104 out of 127 firms reporting a positive
coefficient for the overnight price change variable, these results provide convincing evidence that the RRT is more likely to participate at the market opening when there has been a large overnight price change. A similar number of estimated coefficients for the RRT trade imbalance and RRT accumulated position variables are positive and negative. These results support my previous finding that inventory adjustment considerations are not an important determinant of the RRT’s decision about whether or not to participate in trades at the market opening.
Insert table 6 about here.
Regression model of direction of RRT opening trades: With 120 out of 127 firms
reporting a negative coefficient on the overnight price change variable, the results provide very strong evidence that the RRT’s opening trades are motivated by a desire to moderate overnight price changes. Some support is found for the argument that an RRT will use the additional liquidity found at the market opening to unwind a trade imbalance from the previ-ous trading session.
Regression model of RRT gross trading revenues at the market opening: The
re-sults suggest that after accounting for the probability of RRT participation (by the inclusion of the Inverse Mill’s Ratio), my model of RRT gross trading revenues at the market opening has very little power at the firm level. This is not surprising given that a simple ordinary least squares model will have difficulty capturing the feature that potential trading revenues depend, in large part, on the complex nature of price movements (as evident from the sophis-ticated GARCH-style models of asset returns). The pooled estimation results reported previ-ously are able to provide more insight into the factors influencing gross trading revenues since they better account for the cross-sectional and time-series properties of price movements.
Table 1: Summary Statistics. The mean, median, maximum, and minimum are calculated across firms (i.e. they are based on the cross-sectional distribution). The average closing price is based on the last reported normal trade, omitting trading days in which the stock did not trade.
Mean Median Minimum Maximum
Market cap. 12/31/97 (C$M) 4,253 2,146 878 33,037
Avg. closing share price (C$) 39.90 30.39 4.26 476.91
Avg. # of transactions / day 220.9 118.8 2.4 2,158.6
Avg. # of inside quote revisions / day 271.5 155.2 8.3 1,896.1 Avg. daily trading volume (in 1,000s) 340.9 176.6 1.4 2,059.1
Avg. daily dollar volume (in C$1,000,000s):
•All firms 11.4 4.7 0.1 106.9
•Non-interlisted 5.8 3.5 0.1 60.7
•NYSE/AMEX-interlisted 21.2 10.2 1.2 106.9
•Nasdaq-interlisted 6.1 4.6 1.0 14.6
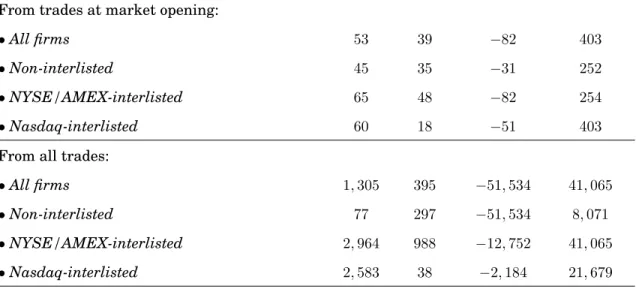
RRT average gross trading revenue (C$ per day):
From trades at market opening:
•All firms 53 39 −82 403
•Non-interlisted 45 35 −31 252
•NYSE/AMEX-interlisted 65 48 −82 254
•Nasdaq-interlisted 60 18 −51 403
From all trades:
•All firms 1,305 395 −51,534 41,065
•Non-interlisted 77 297 −51,534 8,071
•NYSE/AMEX-interlisted 2,964 988 −12,752 41,065
Table 2:Composition of opening trades by dollar volume.Reported numbers correspond to the percentage of all reported opening trades across firms and trading days that had the indicated property. By construction, the reported percentages should sum to 100 (allowing for rounding errors). Opening trades include all trades that occur at the instant the security opens for regular trading (normally at 9:30AM, except when the opening is delayed).
Same member firm involved on both sides of trade [23.28%]
Buy Side
RRT Non-Client
Board Lot Odd Lot ORT Inventory Other Client
RRT Board Lot 0.01 0.00 0.00 0.01 0.05 0.19
RRT Odd Lot 0.00 0.00 0.00 0.00 0.00 0.03
Sell ORT 0.01 0.00 0.10 0.08 0.20 0.65
Side Non-Client Inventory 0.01 0.00 0.12 0.49 0.69 1.69
Non-Client Other 0.02 0.00 0.19 0.36 2.29 2.34
Client 0.11 0.01 0.61 1.57 1.57 9.88
Different member firms involved on each side of trade [76.72%]
Buy Side
RRT Non-Client
Board Lot Odd Lot ORT Inventory Other Client
RRT Board Lot 0.00 0.00 0.13 0.29 0.33 2.08
RRT Odd Lot 0.00 0.00 0.00 0.02 0.03 1.19
Sell ORT 0.12 0.00 0.27 0.63 0.52 2.64
Side Non-Client Inventory 0.30 0.02 0.62 1.55 1.87 4.49
Non-Client Other 0.27 0.02 0.53 1.20 12.69 5.13