Sensory Ecology of
Foraging in Bumblebees
Sensory Constraints and the Effect of Scaling
Dissertation
at the
Faculty of Biology
Julius-Maximilians-Universität Würzburg
submitted by
Johannes Spaethe
Erlangen
Würzburg, 2001
Sensorische Ökologie bei
Sammelnden Hummeln
Sensorische Limitierungen und Körpergrößeneffekte
Dissertation zur Erlangung des
naturwissenschaftlichen Doktorgrades
der Bayerischen Julius-Maximilians-Universität Würzburg
vorgelegt von
Johannes Spaethe
Erlangen
Erlärung:
Hiermit erkläre ich ehrenwörtlich, dass die vorliegende Dissertation von mir selbständig und nur unter Verwendung der angegebenen Quellen und Hilfsmittel angefertigt wurde.
Diese Dissertation wurde weder in gleicher noch in ähnlicher Form in einem anderen Prüfungsverfahren vorgelegt.
Des weiteren erkläre ich, dass ich früher weder akademische Grade erworben noch zu erwerben versucht habe.
Eingereicht am: ...
Mitglieder der Promotionskommision:
Vorsitzender: ... 1. Gutachter: PD Dr. Lars Chittka
2. Gutachter: Prof. Dr. Hans Joachim Poethke
Tag des Promotionskolloquiums: ...
Wiser far than human seer,
Yellow-breeched philosopher!
Seeing only what is fair,
Sipping only what is sweet,
Thou dost mock at fate and care,
Leave the chaff, and take the wheat.
Contents
INTRODUCTION... 8
I. FLOWER SIZE AND COLOR AFFECT SEARCH TIME AND FLIGHT BEHAVIOR ... 10
INTRODUCTION... 12
MATERIAL AND METHODS... 13
Flight arena and flowers... 13
Color analysis ... 13
Experimental procedures ... 15
RESULTS... 17
DISCUSSION... 20
Floral color properties and detectability... 20
Detection area and color recognition area... 21
Flower size and flight behavior... 22
Implications for studying foraging behavior... 23
II. OPTICAL SCALING AND SPATIAL RESOLUTION IN BUMBLEBEES... 24
INTRODUCTION... 26
MATERIAL AND METHODS... 27
Animals and body measures... 27
Scanning electron microscope (SEM) ... 27
Experimental setup and stimuli... 28
Procedures ... 29
Data analysis... 30
RESULTS... 31
Scaling of optical properties ... 31
Minimum visual angle ... 31
DISCUSSION... 33
Optical features ... 33
Behavioral performances ... 33
Implication on foraging behavior ... 34
III. SIZE POLYMORPHISM IN THE OLFACTORY SYSTEM OF BUMBLEBEES .... 35
INTRODUCTION... 37
MATERIAL AND METHODS... 38
Animals and body measures... 38
Scanning electron microscope (SEM) ... 39
Peripheral olfactory system ... 40
Glomerular organization of the antennal lobe... 41
Scaling of the antennal lobe neuropil ... 42
Non-isometrical scaling of sensory and central neuropils... 44
DISCUSSION... 44
Scaling of the olfactory system... 45
Does the antennal lobe neuropil increase isometrically with size?... 46
Functional significance of scaling of the olfactory system ... 46
Brain size polymorphism – a factor influencing division of labor in social insects? ... 47
IV. SIZE VARIATION AND FORAGING RATE IN BUMBLEBEES ... 48
INTRODUCTION... 50
MATERIAL AND METHODS... 51
Study animals ... 51
Foraging parameters... 51
Data analysis... 52
RESULTS... 52
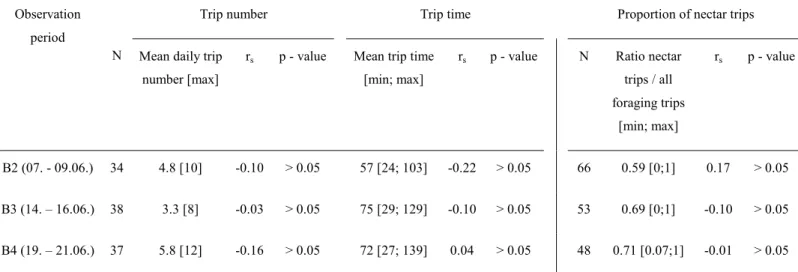
Trip time, number of trips and probability of nectar foraging... 52
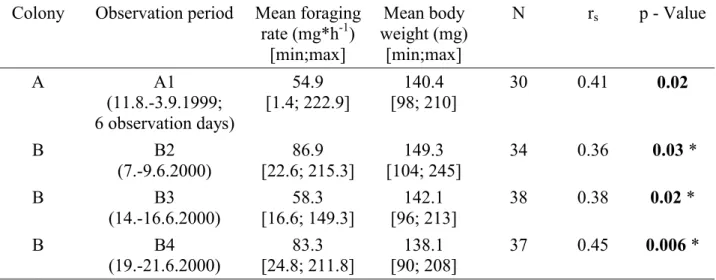
Nectar foraging rate... 54
DISCUSSION... 54
Trip time, trip number and probability of pollen foraging ... 55
Why do large foragers have higher nectar foraging rates?... 55
Worker size variation – constraint or adaptation? ... 56
DANKSAGUNG ... 58 SUMMARY... 59 ZUSAMMENFASSUNG ... 61 REFERENCES ... 63 APPENDIX ... 70 PUBLICATIONS ... 72 CURRICULUM VITAE ... 74
Introduction
One of the fundamental insights in animal behavior from the founders of ethology was the idea that every animal has its own umwelt, formed by the kinds of information its senses can process (Uexküll, 1934/1957). Consequently, when behavioral scientists attempt to study the behavior of an animal, they have to regard how this animal specifically processes sensory information (Shettleworth, 1998).
Every animal must be able to respond appropriately to its own food, offspring, mates and predators. The cues that it can use to do so are determined by the environment characteristic of its species (Dusenbery, 1992). Sensory capacities of a species are biological traits which reflect some balance between adaptation and constraint. Natural selection may act to optimize sensory capabilities of a species for living and acting in a certain environment, but phylogenetic, developmental and structural limitations may keep the traits far from optimum (Chittka et al., 1999a; Dukas, 1989). Moreover, an animal is not only restricted by the sensory characteristics of its species but possesses also individual-specific modifications of its sensory system due to developmental history, physical stage or experience. However, most of the behavioral and sensory-physiological studies in the past did not attach importance to the existence of individuality (Thomson and Chittka, 2001).
The subject of my thesis is the sensory ecology of foraging in bumblebees, Bombus terrestris, an important pollinating insect. For behavioral biologists, bumblebees and honeybees have served as a model system for a long time to test predictions of the optimal foraging theory (Cresswell et al., 2000; Heinrich, 1983; Pyke, 1978), and many studies on foraging behavior and bees’ pollinating efficiency were conducted (for review see Alford, 1975; Heinrich, 1979; Plowright and Laverty, 1984). Bumblebees are important pollinator for several agricultural crop plants like apple, almond, tomato, canola, red clover and blueberry (McGregor, 1976; Parker et al., 1987; Thomson, 1993) and much efforts is attempted to augment natural pollination by bringing bumblebees to the crops and to improve the commercial rearing of bumblebee colonies (De Ruijter and Van den Eijnde, 2000; Van den Eijnde, 1990).
In a further field, distinct from behavioral biology, physiologists investigated the sensory capabilities of bumblebees and honeybees, starting at the beginning of the last century, when Karl v. Frisch discovered for the first time that bees can discriminate colors and concluded that they possess a color vision system (Frisch, 1914). Only a few years later, Kühn found that the visual spectrum of bees extend to the UV, a part of the light spectrum which is completely imperceptible to humans (Kühn, 1924). Since this time we clearly know that bees and humans life in a distinct separated sensory umwelt. The bee’s visual system, for example, possesses in comparison to humans a worse spatial resolution but a higher temporal resolution (Giurfa et al., 1996; Srinivasan and Lehrer, 1988). Bees and humans differ in quantity and quality of odor perception (Frisch, 1919), and a multitude of studies reveal differences in several other senses like thermo-, CO2-, vibration- or polarized light perception (Dettner and Peters, 1999; Penzlin,
Despite this long tradition in the bee research and an expended knowledge of the bee’s foraging behavior and sensory capabilities, only few biologists have attempted to combine the knowledge of both fields for a more integrative understanding of the bee’s behavior. Thus, the aim of my study was to integrate knowledge from both biological fields gaining deeper insights in the interplay of sensory capacities and the foraging behavior of bees.
In the first part of my thesis I focus on the sensory-perceptual processes that may constrain foraging behavior of bumblebees. Bumblebees collect pollen and nectar to satisfy the requirements of their colony. Behavioral ecologists have made intriguing predictions on how pollinators should behave in complex situations where flowers of different species differ in detectability (Dukas and Clark, 1995), but the perceptual dimensions that underlie search behavior, and the floral parameters involved, have been little addressed. Possibly for this reason, predictions of optimal foraging theory are often inconsistent with observations of natural foraging behavior (Heinrich, 1983; Schmid-Hempel, 1993; Varjú and Núñez, 1991; Wells et al., 1986). In my experiments I attempt to identify the neuronal channels used in the natural approach of a bee towards a flower. I also evaluate the bees’ flight behavior to see whether the temporal limitations imposed by the underlying neural processes can account for the bees’ observed searching strategy.
The next part of this study deals with the inter-individual variation of the sensory system among bumblebees. A bumblebee individual is not only constrained by its phylogenetic based settings of its sensory-perceptual system, but also by its individual-specific modifications due to an individual developmental history. Till this day, the importance of individuality in foraging behavior of bees was mostly ignored. Behavioral or physiological data from different individuals were pooled and intra-specific variation was regarded to be noise and was eliminated (Thomson and Chittka, 2001). In bumblebees, workers of the same colony exhibit a pronounced size polymorphism (Michener, 1974). In my thesis I examined for the first time inter-individual differences in the capabilities of the visual and olfactory system of bumblebees due to scaling and possible constraints on foraging behavior.
Differences in the visual and olfactory system predict different capacities in flower detection between large and small bumblebees, and thus impact on the nectar and pollen foraging performance. In the last part, I survey possible effects of size variation among workers of the same colony on nectar foraging rate in freely foraging bumblebee colonies.
This study hopes to bring two things forward. First, that considering the sensory-perceptual processes underlying flower detection is crucial for understanding foraging behavior of bumblebees. And second, that the visual and olfactory system of a bumblebee are not only determined by its species-specific properties but also strongly modified due to scaling.
C
HAPTER I
Visual constraints in foraging bumblebees:
flower size and color affect search time and
flight behavior
Abstract
In optimal foraging theory, search time is a key variable defining the value of a prey type. But the sensory-perceptual processes that constrain the search for food have rarely been considered. Here I evaluate the flight behavior of bumblebees (Bombusterrestris) searching for artificial flowers of various sizes and colors. When flowers were
large, search times correlated well with the color contrast of the targets with their green foliage-type background, as predicted by a model of color opponent coding using inputs from the bee's UV, blue, and green receptors. Targets which made poor color contrast with their backdrop, such as white, UV-reflecting ones, or red flowers, took longest to detect, even though brightness contrast with the background was pronounced. When searching for small targets, bees changed their strategy in several ways. They flew significantly slower and closer to the ground, so increasing the minimum detectable area subtended by an object on the ground. In addition they used a different neuronal channel for flower detection: instead of color contrast, they now employed only the green receptor signal for detection. I relate these findings to temporal and spatial limitations of different neuronal channels involved in stimulus detection and recognition. Thus, foraging speed may not only be limited by factors such as prey density, flight energetics and scramble competition. The results show that understanding the behavioral ecology of foraging can substantially gain from knowledge about mechanisms of visual information processing.
INTRODUCTION
Choosing flower types that involve minimal search times is critical in flower visitors for several reasons. Flight is energetically the most costly activity in insects (Wolf et al., 1999), and even though pollinating insects often operate at the limit of sustaining their flight activity, their fitness depends on the surplus forage brought home to provision their young (Heinrich, 1979; Schaffer et al., 1979). Most flowers offer only small quantities of nectar reward, to keep pollinators moving between plants and so maximize pollen transfer. Activities of many competing flower visitors further reduce those rewards. Bees have been widely used to study foraging decisions, and behavioral ecologists have made intriguing predictions on how pollinators should behave in complex situations where flowers of different species differ in detectability (Dukas and Clark, 1995). But the perceptual dimensions that underlie search times, and the floral parameters involved, have been little addressed. Possibly for this reason, predictions of optimal foraging theory are often inconsistent with observations of natural foraging behavior (Heinrich, 1983; Schmid-Hempel, 1993; Varjú and Núñez, 1991; Wells et al., 1986). In my experiments, I attempt to identify the neuronal channels used in the natural approach of a bee towards a flower. I also evaluate the bees’ flight behavior to see whether the temporal limitations imposed by the underlying neural processes can account for the bees’ observed searching strategy.
To estimate the color contrast a flower makes with its background, which is critical for its detectability, I need to know the color receptor types of the animal in question, and I need a model to predict how color difference is computed on a neuronal level. Most species of bees have 3 color receptor types most sensitive in the UV, blue, and green part of the spectrum (Chittka, 1996; Menzel and Backhaus, 1991). The responses from these are evaluated by two color opponent processes, and bees appear to ignore brightness cues when identifying flowers (Backhaus, 1991; Vorobyev and Brandt, 1997).
The spatial resolution of bee vision is not only limited by the interommatidial angle (which should allow for a resolution of about 2.8° in the vertical and 5.4° in the horizontal direction in honeybees (Autrum and Wiedemann, 1962; Eheim and Wehner, 1972), and of about 5° in bumblebees (Meyer-Rochow, 1981)), but also by subsequent processing. When a target subtends at least 5° (and no more than 15°), bees employ green contrast, i.e. the difference in signal provided by the green receptor between background and target, for detection. The receptive fields of color coding neurons are comparatively large, so that an area of 15° (equivalent to 59 ommatidia of its compound eye; Giurfa et al., 1996) must be subtended for a honeybee to identify a flower by its color – thus from a distance of 1m, a flower must be 26 cm in diameter so that a bee can recognize its color, or to detect a flower by using color contrast! In this view, flowers would inevitably be first detected by using the green signal as the bee approaches a flower, unless it moves towards very near flowers whose visual angle exceeds 15° at the start of the flight (Giurfa et al., 1996; Lehrer and Bischof, 1995).
These results, however, were obtained with bees making choices at a constrained distance from the target (the fork of a Y-maze), and under the assumption that both the bee and the target are stationary. Times to make a choice, which are crucial in foraging, were not recorded. When the
bee is in motion, as during natural foraging, temporal constraints of the respective neuronal channels might become relevant for the detection process. As a bee moves across a meadow with flowers, the contrast each flower makes with its background is reduced, and spatial resolution also decreases (Srinivasan and Lehrer, 1985). With increasing flight speed, the amount of time a flower passes through the receptive field of a visuo-neuronal channel is reduced. Beyond a critical speed, this time window may be too short for the flower to be resolved by the temporal sensitivity of a receptor or neuronal channel, and the bee may fail to detect the object. In experiments with flickering stimuli, Srinivasan & Lehrer (1985) concluded that a bee needs 10 ms to compute the color of an object. The green receptor channel, which also drives the bees' movement avoidance response, has been reported to have about half that integration time, which appears to be close the photoreceptors' temporal resolution (Srinivasan and Lehrer, 1984). Whether these limitations apply when a single target suddenly appears in the visual field of a bee, and moves across the retina, is unknown.
MATERIAL AND METHODS
Flight arena and flowers
All experiments were performed with individually marked bumblebee workers from four different Bombus terrestris colonies. The colonies were housed in wooden nest boxes, connected to a flight arena with a plastic tube. The flight arena measured 120 × 100 × 35 cm. It was covered with a UV-transparent Plexiglas cover. The floor consisted of two layers of plastic boards. The upper board was colored green (for spectral reflection see Fig. 1), 1mm thick, and was punctured with 575 holes in 25 rows and 23 columns, 2 mm in diameter and 4 cm apart. The lower board contained an equal number of holes, 4 mm in diameter at the same positions as in the upper board. Into the wells in the lower board, small plastic caps for sugar solution with a maximum volume of 50µl could be placed. Artificial flowers were made of round pieces of Plexiglas 1 mm thick with a central hole (Æ=1mm), painted with pigment colors. I used seven flower colors (see below) and five flower sizes with diameters of 5, 8, 15, 22 and 28 mm respectively. The two smallest sizes did not have holes, but were placed so that the holes with rewards were placed directly adjacent to the stimuli.
Color analysis
Spectral reflectance functions of the stimuli and the background was measured using a spectrometer (Ocean Optics S2000 with a Deuterium/Halogen light source). The color parameters (relative excitation values in the bees' UV, blue, and green receptors, color contrast, green contrast, and brightness; Table 1) were calculated according to Backhaus (1991) using the
color hexagon (Fig.1; Chittka, 1992); for alternative models, see Vorobyev & Brandt (1997). The relative amount of light absorbed by each photoreceptor color type is:
700
P = R ò IS(l) S(l) D(l) d l (1)
300
IS(l) is the spectral reflectance function of the stimulus; S(l) is the spectral sensitivity function of the receptor (I used the functions of Peitsch et al. (1992) for the Bombus terrestris UV, blue, and green receptors). D(l) is the illuminant (in my case, a standard neon light filtered through the Plexiglas cover combined with natural daylight). The sensitivity factor R in eqtn. 1 is determined by:
700
R = 1 / ò IB(l) S(l) D(l) d l (2) 300
IB(l) is the spectral reflection function of the background to which the receptors are adapted (Fig.1). With this model, it is assumed that the photoreceptors display half their maximal response when stimulated by the light reflected from the adaptation background. When the maximum excitation Emax of the photoreceptors is normalized to 1, the photoreceptor excitation
can be described by
E = P / (P + 1) (3)
where P is the stimulus strength (eqtn. 1), in units such that for P = 1, E = 0.5 (i.e. half the maximum potential; for details see Backhaus (1991); Vorobyev and Brandt (1997)). Thus, for the adaptation background, E equals 0.5 in each photoreceptor. Green contrast, then, is the degree to which any given stimulus generates an excitation value different from 0.5 in the green receptor. Because excitation can range from 0 to 1, the maximum green contrast is 0.5. Stimulus brightness is defined as the sum of all three photoreceptor excitations, so it can have any value from 0 to 3. Because the background, by definition, has a brightness of 1.5, brightness contrast can have any value up to 1.5.
Table 1. Color properties of the artificial flowers
Color Distance to background
(Hexagon units) Brightness contrast Green contrast
UV-absorbing white 0.16 0.87 0.33 Blue 0.23 -0.22 -0.16 Yellow 0.35 -0.07 0.21 Lemon 0.31 0.31 0.30 Turquoise 0.10 0.32 0.08 Red 0.06 -0.94 -0.29 UV-reflecting white 0.07 0.77 0.26
Color distance is measured in hexagon units, brightness as the sum of the excitations of all three receptor types after adaptation to background, and green contrast as the specific excitation of the green receptor. In the analysis the absolute values of green contrast and brightness contrast were used.
For calculation of hexagon color loci from receptor excitation values, see Chittka (1992). Color distance in the color hexagon is correlated with the degree to which two stimuli are perceived as differently colored. The background color locus lies in the center of the color hexagon. Distance from the center to any of the hexagon's corners is unity. Therefore, color contrast of a given stimulus with its backdrop can range from 0 to 1.
Experimental procedures
Before the experiments, bees were allowed to familiarize themselves freely with the arena, and to feed from transparent plastic dishes containing 1 molar sucrose solution. Prior to experiments, bees were not exposed to colored targets. During an experiment, only one bumblebee at a time was allowed to enter the arena. During a search bout (a round trip from the nest to the flowers and back), I offered three flowers in the flight arena. The flowers were arranged in an equilateral triangle with a side length of 30 cm. Each flower disk was positioned exactly above a hole in the floor, filled with 30 µl 1.5 molar sucrose solution. In each bout the triangle was randomly arranged on the floor and the flowers were cleaned with 30% alcohol after each visit to eliminate scent marks by bees. The floor was cleaned in the same way after each third bout (Chittka et al., 1999b).
An experiment started by training a single bee to search for the flowers and feed on the sugar solution provided by the cap under each flower. Each bee was tested on one color only, but on different flower sizes. During the training phase, I presented the largest size (28 mm in diameter) for 15 bouts. The subsequent test phase for the 28mm flowers comprised five
b
a
Blue B lu e-g reen Gre en UV-green UV UV -blu e 1 6 5 4 3 2 7 Wavelength P er ce nt re fl ec ta nc e 6 3 1 5 4 2 background 300 350 400 450 500 550 600 650 700 0 20 40 60 80 100 7 (nm) Fig. 1.Color stimuli employed in the study: a) Spectral reflection curves of the artificial flowers and background. b) Color loci of the stimuli in the color hexagon. The color space inside the central circle (< 0.1 hexagon units) appears achromatic for the bees. 1 yellow, 2 UV-absorbing white, 3 blue, 4 turquoise, 5 red, 6 UV-reflecting white, 7 lemon.
foraging bouts. After that I reduced the size for the next six bouts, and then reduced it further. I did not evaluate the first bout of each new size to exclude phases when bees first familiarized themselves with a new foraging situation. In each bout I measured the search time from entering the flight arena until landing on the third flower excluding the feeding times. In order to reduce high variation in search time due to different distances between the arena entrance and the first flower, I used only search times between flowers. I also excluded the time between the second and the third flower, since bees sometimes returned to the first flower. I tracked the bees' behavior using the computer program Observerâ which allowed us to record behavioral observation data with defined push-button combinations on a laptop.
In the first experiment, I determined how flower size affected search time. Each of 6 bees was tested on blue flowers of five sizes (28, 22, 15, 8 and 5 mm in diameter) in descending order. For all sizes and for each bee, I calculated the mean search time between the first and the second flower of all five bouts.
In my second experiment, I tested the influences of color properties on search time. I trained bees of seven groups to forage on one color of flower each. The flowers had the colors blue (bee-blue), yellow (bee-green), red (bee-uncolored), turquoise (bee-blue), UV-reflecting white
(bee-uncolored), lemon (bee-green) and UV-absorbing white (bee-blue-green). The bees were tested on three flower sizes (28, 15 and 8 mm respectively) in a descending order. For the UV-absorbing white flowers, I also tested the effect of flower size on flight speed and height for three flower sizes (28, 15, and 8 mm respectively). The final foraging bout on each floral size was video-taped. The flight path was recorded by a digital camera (Sony DCR-VX 1000E, 25 frames / s) from the side of the arena through a transparent Plexiglas sheet. Because one camera was used it was only possible to measure velocity in the vertical x-y plane. Using this method, the recorded velocity and flight height of a bumblebee on a video tape depends on the distance between the bee and the camera lens. Therefore, I evaluated only video tape sequences during which the bee flew in a defined distance to the camera. I mounted a light emitting diode in front of the camera. The experimenter observed the flying bee from above and switched the diode on when the bee was flying above a defined area which had been marked on the arena floor. This area had the shape of a narrow strip of the arena floor (10 cm width, but covering the entire width of the arena). The strip was arranged perpendicular to the direction in which the camera was pointing; its distance to the camera was 60 cm. I excluded all recordings one second before and after landing on a flower to avoid confounding search behavior and landing maneuvers. For each bee and floral size I obtained a mean number of 195 frames (32 to 384) of the flight paths within the marked area. This method enabled me to assess the real mean velocity (assuming that the velocity in the x-y plane is equal to the velocity in the x-z plane) and to determine differences between foraging flights for various flower sizes. For digitizing and analyzing video
recordings, I used a computer-based video analysis system (WINanalyzeâ).
RESULTS
A decrease in flower size prompted a drastic increase in search time, from 10.4 s ± 8.5 s at a
size of 28 mm to 124.3 s ± 86.0 s at 5 mm size (Fig. 2). Overall, search time is highly
negatively correlated with size (Spearman rank test: rs = -1.0, p < 0.0001, N = 5). For the bees,
it is substantially harder to detect the smaller flowers. Such flowers involve longer search times and thus lower foraging efficiency.
0 30 60 90 120 150 180 a b b b a Sea rc h t im e ( s) Fig. 2.
Search time for detecting blue flowers of various sizes. Same letters indicate no significant differences
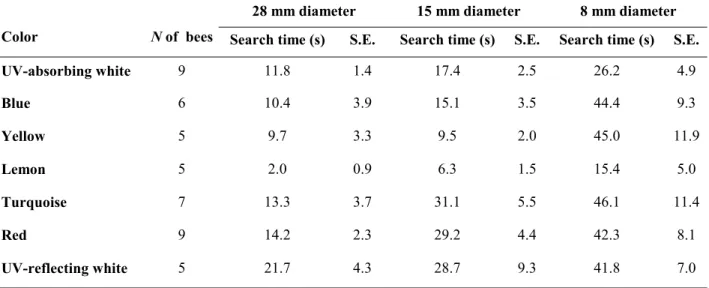
For the tested flower sizes of 28, 15 and 8 mm diameter, mean search time differs significantly among flower colors (Kruskal-Wallis H-test: 28 mm: H = 16.3, p < 0.01; 15 mm: H = 23.6, p < 0.001; 8 mm: H = 12.8, p < 0.05). For large flowers, search time ranges from 2.0 seconds (lemon flowers) to 14.2 sec (red flowers) or even 21.7 seconds (UV-reflecting white flowers; Table 2). For small flowers search times are more than doubled, ranging from 15.4 seconds (lemon flowers) to 46.1 seconds (turquoise flowers). The mean search times for each color and size are plotted in Fig. 3a-b as a function of color contrast and green contrast provided by the flowers. For large flowers, Spearman's rank test reveals a significant negative correlation between search time and color contrast (rs = -0.93, p < 0.01, N = 7). No correlation with the
achromatic properties brightness (rs = -0.71, p = 0.08) or green contrast (rs = -0.11, p = 0.82)
was found. The same picture is obtained for the medium flower size (Color contrast: rs = -0.86,
p < 0.05; brightness contrast: rs = 0.64, p = 0.12; green contrast: rs = -0.32, p = 0.48). This
means that with an increase in color contrast, search time decreases.
Table 2. Mean search times for flowers of different colors and sizes
28 mm diameter 15 mm diameter 8 mm diameter Color N of bees Search time (s) S.E. Search time (s) S.E. Search time (s) S.E.
UV-absorbing white 9 11.8 1.4 17.4 2.5 26.2 4.9 Blue 6 10.4 3.9 15.1 3.5 44.4 9.3 Yellow 5 9.7 3.3 9.5 2.0 45.0 11.9 Lemon 5 2.0 0.9 6.3 1.5 15.4 5.0 Turquoise 7 13.3 3.7 31.1 5.5 46.1 11.4 Red 9 14.2 2.3 29.2 4.4 42.3 8.1 UV-reflecting white 5 21.7 4.3 28.7 9.3 41.8 7.0
Mean search times for flowers of different colors and sizes. Time was measured from leaving the first flower to landing on the second flower.
An entirely different picture is obtained for small flowers (8 mm). Here, a significantly negative correlation is found between mean search time and green contrast (rs = -0.89, p < 0.01), but no
correlation with color contrast (rs = 0.00, p = 1.0) or brightness contrast (rs = -0.36, p = 0.43).
For this size, a larger green contrast leads to a shorter search time.
The switch from one neuronal channel to the other is particularly striking when comparing search times in the yellow and UV-absorbing white flowers: yellow flowers exhibit a higher color contrast to the background, but only approximately two thirds of the amount of green
0 10 20 30 40 50 0.06 0.12 0.18 0.24 0.30 0.36 0 10 20 30 40 50 0.02 0.08 0.14 0.20 0.26 0.32 0.38 Se ar ch t im e (s )
Color contrast (hexagon units)
Green contrast
b
a
Fig. 3.
Relation between search time and (a) color distance and (b) green contrast respectively for the three different flower sizes. Circle indicates 28 mm, triangle 15mm, and rhombus 8 mm flower diameter. Filled symbols indicate significant correlation (for details see text).
contrast. Bees take longer to search for the large UV-absorbing white flowers (22% longer compared to yellow flowers), suggesting that color contrast is the relevant parameter. But search times are reversed in the small flowers: here they are longer for the yellow flowers (72% longer compared to the white flowers), presumably because bees now use green contrast instead of color contrast.
I find a significant decrease in flight height and velocity with decreasing flower size (Fig. 4).
0 20 40 60 80 0 50 100 150 200 250 300 28 15 8 p < 0.03 ns p < 0.02 F lig ht he ig ht ( m m )
a
Flower diameter (mm) 28 15 8 p < 0.02 ns ns F lig ht v e lo ci ty ( m m /s)b
Fig. 4.Flight height (a) and flight velocity in the vertical x-y plane (b) while searching for flowers of different flower sizes (Wilcoxon-matched-pairs test; numbers indicate p-level). Mean ± S.D.; N = 7. ns, not significant.
The mean flight height drops from 52.0 mm (± 15.2) for 28 mm flowers to 26.1 mm (± 5.2) for 8 mm flowers. The velocity declines from 208.6 mm / s (± 38.8) to 165.1 mm / s (± 23.2).
DISCUSSION
I tested whether the optical properties of a flower, measured as color contrast, green contrast and size, affect search time and flight behavior of foraging bumblebees. The results reveal a strong influence of these properties on search time and thus foraging costs. I discuss these findings in the light of optimal foraging behavior.
Floral color properties and detectability
Both chromatic and achromatic color properties of a flower affect search time, depending on flower size (Fig. 3 and Table 2). In large flowers search time is a function of color contrast, whereas in small flowers it is correlated with green contrast. Consequently, the bees seem to be limited alternatively by chromatic or achromatic features, depending on the visual angle subtended by the flower.
At first glance, these findings are nicely consistent with the results obtained in dual choice experiments for honeybees (Giurfa et al., 1997; Giurfa et al., 1996). In these experiments, bees were trained to discriminate between two objects, providing various visual angles and either chromatic or achromatic contrast or both. When provided with an angle between 5° and 15°, the bees’ choice behavior was governed by green contrast. When the angle was >15°, the bees used solely chromatic cues. At close inspection, however, my results are not so easily explained by these earlier findings. As a bee approaches a flower, that flower will inevitably exceed the 5° threshold before the 15° threshold. Therefore, detectability should always be correlated with green contrast, unless such contrast is not available, or unless flowers are extremely close to one another. Identification by color would always happen subsequent to detection by green contrast. The results indicate that bumblebees use color contrast to detect large flowers. This result is not explicable by the possibility that each flower already subtends more than 15° when seen from the other flowers: from 30 cm away, the largest flower type covers only 5°, even if presented vertically. I suggest that bees may be selectively using color contrast when they expect large flowers, and ignore the signal from the green receptor channel. This may enable bees to identify flowers with more certainty, simply because color contrast uses three input variables, whereas green contrast is only defined by one. Thus, bees face a tradeoff between reliable identification and rapid detection, and the relative benefits of both might change depending on floral size. To estimate the theoretical increase in search costs if bees would use the color channel for small flowers, it is useful to consider the size of the area inside which the bee is able to detect a flower from a given flight height.
Detection area and color recognition area
As a bee searches the arena for flowers, the probability of its success does not depend directly on stimulus size. Rather, at any given flight altitude, this probability is dependent on the likelihood that she enters the area inside which the flower subtends either a visual angle of ³
15° for using the color channel or ³ 5° for using the green contrast channel. I will henceforth designate the circular area (with radius = r, see Fig. 5) directly above the flower, inside which detection is possible, as detection area, and that inside which an assessment of color contrast is feasible, color recognition area (Fig. 5). Considering the mean flight height (h), the corresponding flower diameter (d), and the minimum visual angle (α) of 5° or 15° respectively, I calculated these areas as follows:
A = r2 * p (4) (5). sin 16 2 4 2 2 2 2 2 r where 2 4 2 2 4 2 2 2 2 2 ÷ ÷ ø ö ç ç è æ ÷ ø ö ç è æ -+ + -÷÷ø ö ççè æ -± -= a dh d d h h d h d h
(For explanation see appendix).
It follows that the color recognition area (visual angle ³ 15 ° at the bee’s eyes) is 91.9 cm2 for 28 mm flowers and 3.6 cm2 for 8 mm flowers. The detection area (a minimum visual angle of 5° is subtended by the flowers) is 352.2 and 50.5 cm2 for 28 mm and 8 mm flowers respectively. This means that, using color contrast, bees would have to face a roughly 25 fold increase in search times (because the probability of a searching bee to enter the detection area
b
a
d
h
c
e
r
Fig. 5. This sketch illustrates the geometry necessary to calculate the radius ofthe detection area r, within which a
bee flying at a given height h will be able to detect a flower with diameter d, given a resolution of a ³ 5° (a ³ 15° for the color recognition area; r = radius of the circular detection area, a = visual angle subtended by the flower when the bee is situated at point e).
is proportional to its surface) when searching for 8 mm instead of 28 mm flowers. If bees switch from color contrast to green contrast (and thus from a 15° to a 5° receptive field) when searching for smaller flowers, I would expect an increase in search time by only a factor of 1.8, which is almost within the range of factors (1.9 to 4.6) which I empirically determined (Table 2). Note that, while the detection area is always larger than the color recognition area, its relative advantage decreases with floral size. In 28 mm flowers, the color recognition area
measures 26% of the detection area, whereas in 8 mm flowers, color contrast can only be used in 7% of the total detection area. I conclude that, with increasing floral size, the increase in search time by using color contrast is compensated by acquiring higher precision of floral recognition.
Flower size and flight behavior
I showed that the size of an artificial flower strongly affects the time a bee needs to detect this flower (Fig. 2). Two scenarios might explain this increase in search time: (1) the bee’s flight height and velocity stay constant while searching for flowers of different sizes. This leads to a reduced detection area. In this case, the probability of a randomly searching bee to enter this area decreases, and thus the time until she detects the object increases. (2) The bee adapts her flight height to the sought objects in such a way that detection area is maintained constant. Here the detection area becomes larger compared to the first scenario, but the total area scanned by the bee per time decreases. The results indicate that bees use a strategy which is closer to second possibility: the bees sacrifice total area scanned per unit time to increase
detection areas. When the bees search for small flowers they decrease their flight height from
52 to 26 mm, close to the theoretical height of 15 mm when they would keep the detection area
exactly constant.
With a decrease in flower size, flight velocity also decreases. This means that bees forgo even more of area scanned per time, suggesting that temporal constraints play a role in floral detection as well. The results of Srinivasan & Lehrer (1985) suggest that bees take about 10 ms to compute the color of an object seen in flight. They concluded that bees flying at a speed of 7 m/s at a height of 2 m can still resolve two objects spaced 12.5 cm apart on the ground.
Can the 10 ms limit explain the strategy used by bees searching for small flowers? Yes. Consider a bee flying at a speed of 30 cm/s at a height of 5.2 cm – these are the values obtained for bees searching for flowers with Æ = 28mm. For a neuron with a receptive field of 5°, this flower would "appear" for 48 ms (and 78 ms for a receptive field of 15°) – a value large enough for processing color information. But bees even further reduce their speed when flowers are smaller (23 cm/s for flowers of Æ = 8 mm). In this case, a flower would appear for 24 ms for a receptive field of 15°, but only for 5ms for a receptive field of 5° - too short for processing color information!
Hence the bee can only rely on the green contrast for detecting small flowers at a speed of 23 cm/s, or they would have to fly even slower and thus further increase search times. Note that energetic constraints appear to play a marginal role in adjusting foraging velocity: Ellington et
al. (1990) found that, in bumblebees, energetic expenses are constant over a very large range of flight speeds. Together with my findings, these results suggest that temporal limitations of visual processing are critical to determine the optimal flight speed.
Implications for studying foraging behavior
Studies of foraging behavior in bees have treated visual cues, such as color and shape, as stimuli with which the bees can associate and discriminate between different rewarding units (Heinrich et al., 1977; Hill et al., 1997; Real et al., 1982; Smithson and Macnair, 1996; Wells et al., 1986; Wells and Wells, 1983). Most of these authors paid attention to effects of the amount of nectar provided and the density of nectar dispensers, but not the possible effects caused by the cues themselves. I emphasize that, for assessments of the energetic value of a prey type, it is essential to include the costs of detecting this type. In the optimal foraging literature, there is a wide range of papers that deal with optimal foraging speed. As possible factors contributing to adjustments of speed, these papers discuss energetic considerations (Hedenström and Alerstam, 1995; Kunze and Chittka, 1996), motivation (Roces, 1993), and scramble competition (Shaw et al., 1995). My study shows that understanding the mechanisms of visual information processing is also crucial to interpret optimal search behavior. For example, optimal foraging theory predicts that two flower types with equal nectar rewards, and with equal density, should be chosen equally frequently. The results do not only show that the net caloric value of a flower type will be fundamentally determined by its color, which has strong effects on search time. More intriguingly, my findings lead to the prediction that the bees' relative preference for flowers of two colors may switch depending on floral size; one floral color may be easier to detect at large size, but the same color may be harder to detect than the other color when flowers are small. This is because different neuronal channels with different spatio-temporal properties are used for detection of large and small flowers. Floral advertising strategies may respond to these perceptual constraints: a strong color contrast with the background (independently of direction) may be favored in large flowers, whereas small flowers should strive to optimize green contrast only.
C
HAPTER
II
Optical Scaling and Spatial Resolution in
Bumblebees
Abstract
Foraging efficiency in bees is strongly affected by proficiency of detecting flowers. Both floral display size and bee spatial vision limit flower detection. In chapter one I have shown that search times for flowers strongly increases with decreasing floral display size. The second factor, bee spatial vision, is mainly limited by two properties of compound eyes: (a) the interommatidial angle Çå and (b) the ommatidial acceptance angle Çá. When a pollinator strives to increase the resolving power of its eyes, it is forced to increase both features simultaneously.This chapter examines the effect of body size variation in bumblebees on the optical properties of the compound eyes by means of morphological and behavioral investigations. Bumblebees show a large variation in body size. I found that larger workers with larger eyes possess more ommatidia and larger facet diameters. Large workers with twice the size of small workers (thorax width) have about 50 % more ommatidia, and a 1.5 fold enlarged facet diameter.
In a behavioral test, large and small workers were trained to detect the presence of a colored stimulus in a Y-maze apparatus. The stimulus was associated with a sucrose reward and was presented in one arm, the other arm contained neither stimulus nor reward. The minimum visual angle a bee is able to detect was estimated by testing the bee at different stimuli sizes subtending angles between 30° and 3° on the bee’s eye. Minimum visual detection angles ranged from 3.4° to 7.0° among tested workers. Larger bumblebees were able to detect objects subtending smaller visual angles, i.e. larger bees were able to detect smaller objects than their small conspecifics. Thus morphological and behavioral findings indicate an improved visual system in larger bees. I suggest that larger workers can decrease their search times for flowers and increase their foraging rates due to their superior visual system.
INTRODUCTION
The ability to detect flowers and discriminate between flowers of different species strongly influences foraging efficiency in pollinating insects. Flowers serve as carbohydrate and protein sources, and optimal foraging theory predicts that pollinators strive to exploit these resources efficiently. As flowers differ in the quantities of their nectar and pollen rewards and in the frequency of their occurrence, pollinating insects are expected to restrict their visits to a subset of profitable flower species (Chittka et al., 1999a). Flowers display several optical features like color, size and shape which pollinators can use to detect and identify a certain flower type. Thus, the optical system of pollinators is an important sensory modality which may limit foraging efficiency (see also chapter 1).
All insect pollinators possess the same optical system, namely compound eyes, but the design, and thereby spatial resolution, varies substantially among different species. Compound eyes comprise a varying number of ommatidia, the receptor units of the eye, and must be capable of two basic things. First, the eye must be able to collect sufficient light, and second it must be able to reliably determine the direction of light sources and objects, respectively. Therefore, the array of the receptor units and the dimension of the ommatida are the two most important factors which affect both cases of spatial resolution, single object and grating resolution (Land, 1997b; Warrant and McIntyre, 1993). The angle between two ommatidia ( = interommatidial angle Çå) in a compound eye is one of the fundamental determinants of its spatial resolution. When a compound eye, for example, faces a grating of black and white strips the eye can resolve the two black (or white) strips as two distinct objects only when the visual angle between them subtends a minimum of 2Çå. In that case each black and white strip projects onto at least one ommatidium. However, this minimum resolution of 2Çå can only be realized when the intensity contrast perceived by two neighboring ommatidia is large enough to be detectable. If the two alternate strips present only a weak contrast (e.g. light and dark gray strips), resolution is additionally limited by ommatidial diameter (and thus by ommatidial acceptance angle Çá; Land, 1997a). The larger the ommatidial diameter, the smaller the contrast differences which can be detected. Beside the amount of absorbed light quanta, ommatidial diameter mainly limits the visual field of an individual photoreceptor by the phenomenon of diffraction (Land, 1997b). This phenomenon is caused by an important physical characteristic of light itself (for explanation see Warrant and McIntyre, 1993). As a consequence, light which passes a convex lens and focuses in the combustion point always induces a complex diffraction pattern (Airy disc), a central intensity maximum and a series of rings of minima and maxima of sharply decreasing intensity, rather than a single point. The wider the lens aperture (= lens diameter) the narrower the Airy disc and hence the finer the image resolution (Land, 1997a). For these reasons, increasing the resolution of a compound eye of a particular size results in a dilemma. The interommatidial angle Çå can be increased by increasing the number of ommatidia. Unfortunately, in this case ommatidial diameter drops too, and the contrast detection of the eye is reduced and diffraction is increased. On the other hand, increasing ommatidial diameter and thereby increasing contrast detection entails an increase of Çå. The
only way to improve resolution without the cost of decreased contrast detection or increased
Çå is, therefore, enlarging eye size (Land, 1985).
Additionally, when identifying the color of a flower, pollinators are not only limited by the optical properties of their eyes as mentioned above, but additionally by subsequent neuronal processing. In honeybees, for example, the receptive field of color coding neurons is comparatively large, and a colored target must subtend at least 15° (equivalent to a minimum of 59 ommatidia of bee’s compound eye; see chapter 1 and Giurfa et al., 1996) so that the bee can identify its color. In the case of a target subtending less than 15° but at least 5° (equivalent to a minimum of 7 ommatidia) bees can only use the achromatic green contrast channel for detection, i.e. the difference in signal provided by the green receptor between background and target (Giurfa et al., 1997).
In this chapter I examine possible effects of size variation on flower detection in pollinators. I use bumblebees as ideal study objects, since workers exhibit a pronounced size variation (Garófalo, 1978; Inouye and Kato, 1992; Knee and Medler, 1965). Large workers can reach up to 7 times the body weight of small workers in a colony (Cumber, 1949). Increasing body size results in an increase in eye size and thus the question arises if large workers possess a higher spatial resolution compared to their smaller nestmates. I assess scaling effects on (1) anatomical features of workers’ compound eyes and (2) behavioral performances in single object detection. The first aspect provides a theoretical estimation of the impact on visual resolution, the second facilitates an assessment to which extent the visual information perceived by the compound eye can be used by the bumblebees in detection tasks.
MATERIAL AND METHODS
Animals and body measures
I used bumblebee workers from three Bombus terrestris colonies reared in the lab at the University of Würzburg. For morphometrical measurements bumblebee workers were selected according to their size and killed by cooling them in a freezer at -20°C. Head and thorax of each bee were mounted on a table with a micrometer screw. Size measurements were carried out with a stereomicroscope (Wild TM M3Z, Switzerland) at twenty fold magnification. I determined head width (from eye to eye), thorax width (intertegula span) and length of left eye from each worker (for anatomical terminology see Michener, 2000).
Scanning electron microscope (SEM)
For estimating ommatidia number and diameter I removed the left eyes of freshly killed bees with a razor blade and glued them with their inner side on a SEM table. Afterwards they were air-dried, gold-palladium coated (Balzers sputter coater SCD 005, Liechtenstein) and viewed with a scanning electron microscope (Zeiss DSM 962, Germany). On the SEM photos I marked
a 1 mm2 area in the center of each eye and counted all ommatidia inside this area. Of 15 randomly selected ommatidia I measured facet diameter (tip to tip distance of the hexagonal lens). I scanned the photos of each eye into a computer and measured eye surface using a imaging program (Scion image, Scion corporation, USA). Number of ommatidia per eye was calculated by counting ommatidia per 1 mm2 multiplied with eye surface (in mm2).
Experimental setup and stimuli
All colonies were housed in small wooden boxes (15 * 28 * 11 cm) inside the lab. Each colony was connected to a flight cage (0.45* 0.45 m, 0.3 m height; Fig. 2) via a Plexiglas tube (2 cm diameter, 0.3 m length). Shutters between nest and arena allowed to control access of selected workers. The flight cage was directly connected to the experimental apparatus, a Y-maze with two tunnels (0.3 m width, 0.2 m length and 0.3 m height) branching from a trilateral decision chamber (0.3 m * 0.3 m * 0.42 m, 0.3 m height), similar to that used by Srinivasan & Lehrer (Srinivasan and Lehrer, 1988 and Fig. 2). The two back walls of the tunnels consisted of white plastic boards (0.3 m * 0.3 m) with a central hole (1 cm diameter). On the back side of each board a small plastic tube (1 cm diameter, 6 cm length) with a feeder (20 ml) was mounted at its end connected to the central hole (Fig. 2). Both, back walls and feeders, could be interchanged independently between the two arms. The arena was covered by a UV-transmitting Plexiglas top.
As flower stimulus I used yellow paper disks (HKS 3N; K +E Stuttgart, Stuttgart-Feuerbach, Germany) 15.9, 7.9, 5.5, 3.9, 3.1, 2.4, and 1.6 cm in diameter, respectively. Spectral reflectance functions of the stimulus and the background was measured as described in chapter one (Fig. 1). I measured color contrast, green contrast and brightness contrast between stimulus and background (see chapter one and Chittka, 1992). The color disc was glued with plasticine onto the back wall of one arm of the Y-maze (termed positive arm). Large discs (up to 5.5 cm diameter) were perforated at their center with a hole (1 cm diameter) that fitted to the hole in
0.0 0.2 0.4 0.6 0.8 1.0 300 400 500 600 700 Pe rc en ta ge r e flec ta nc e Wavelength (nm) Fig. 1.
Spectral reflectance curves of the yellow stimulus and back wall. Dotted line, back wall; solid line, stimulus.
the back wall (Fig. 2). Smaller color discs without perforation were mounted directly above the hole. During all training and test phases color stimulus was always associated with a reward of sucrose solution in the feeder behind the back wall. The back wall of the second arm (termed negative arm) contained no stimulus and always an empty feeder (except during pre-training phase; see below).
Fig. 2.
Assembly drawing of the Y-maze apparatus. Plus indicates back wall with stimulus and filled feeder. D, distance between decision point and stimulus (= 30cm).
Procedures
During the pre-training phase, both arms presented a color disc (15.9 cm diameter) associated with a reward. Bees had free access to the Y-maze for several days. Bees discovered the entrances to the feeders in both arms within one day and started collecting sucrose solution for their colony. I marked foragers with numbered ‘Ophalitplättchen’ on their thorax. When marked bees continuously visited the feeders in both arms I started training and testing foragers individually.
During training and test phases only one arm presented the stimulus associated with the reward. Back wall, stimulus and feeder were interchanged randomly and independently between both arms after each trial. After each fifth trial the disc was replaced by a new one. In order to exclude that bees used possible olfactory cues I cleaned the back wall and the entrance tunnel to the feeder after each third trial with alcohol. Each training and test trial started when the bee entered the decision chamber. I defined the initial choice of the bee as the point when she crossed the choice line of the positive or negative arm for the first time (see Fig. 2). After each
visit at the feeder the bee returned to the colony and the next trial started when she initialized a new foraging trip.
Table 1. Visual angle of stimuli calculated with D = 30 cm.
Disc diameter (cm) 15.9 7.9 5.5 3.9 3.1 2.4 1.6
Visual angle (°) 30 15 10 7.5 6 4.5 3
During training phase only the largest stimulus (15.9 cm diameter) was presented. Each bee was trained until she reached a performance level of 80% or higher for the largest stimulus (at least for a minimum of 20 trials) before test phase started. During the test phase, I presented the stimuli in a descending order, starting with a color disc of 15.9 cm in diameter. The bee was tested for ten trials at each stimulus size when she made no mistake (wrong choice), twenty trials when she made one or two, and a maximum of thirty trials when she made more than two mistakes. To obtain a threshold estimation for the minimum visual angle of a stimulus the bee was able to detect I first calculated the visual angle subtended by each tested stimulus at distance D = 30cm, the distance between stimulus and the ‘decision point’ (defined as the mean distance between the point where the bee entered the Y-maze and where she crossed crossed the decision line; see Table 1 and Fig. 2). Second, for each bee I plotted the percentage of correct choices as a function of the visual angle of the stimulus. I employed the learning criterion established by Giurfa et al. (1996): a bee is able to detect a given stimulus when she chooses the positive arm of the Y-maze with a probability of correct choices greater than 60%. Therefore, detection threshold was interpolated as the visual angle corresponding to the 60% level.
After testing, the bee was killed and size was measured as described above. Thus, for each bee I obtained body size and minimum visual angle at which the bee was able to detect the stimulus with a probability of 60%.
Data analysis
I tested possible correlations between measured parameters with a nonparametric test for association (Spearman’s rank correlation) except for body size versus eye length, where I used a least square regression (model I; Sokal and Rolf, 1981). All p-values above 0.05 were considered as not statistically significant.
RESULTS
Scaling of optical properties
In order to test whether eye size scales with body size, I measured eye size of 34 bumblebee workers whose thorax widths varied between 2.6 and 4.0 mm. Larger workers possess larger eyes (Fig. 3). Data reveal a linear correlation of eye size with body size (N = 34; r = 0.91; p < 0.0001).
As a next step I tested what factors underlie the increase in eye size. I estimated ommatidia number and mean ommatidial diameter of ten workers. Both, ommatidia number (Fig. 4A) and size (Fig. 4B) correlated with eye surface. Ommatidia number ranged from 2963 to 4132 per eye, ommatidial diameter from 19.3 µm to 29.4 µm. These data show that eye size of large workers increased due to more and larger ommatidia. However, total ommatidia number per eye might be underestimated because facet diameter in the dorsal and ventral area of the eye might be smaller than in the central area (Meyer-Rochow, 1981).
2.4 2.6 2.8 3.0 3.2 3.4 3.6 3.8 4.0 4.2 1.8 2.0 2.2 2.4 2.6 2.8 3.0 2 N = 34 r = 0.91 p < 0.0001 Eye l engt h ( m m ) Thoracic width (mm) Fig. 3.
Thorax width of 34 bumblebees plotted against eye length of left eye (r = 0.91, p < 0.0001). Red dots show data from four honeybee workers for comparison.
Minimum visual angle
Color contrast, green contrast and brightness contrast between stimulus and back wall was measured as described in chapter one. The tested stimuli provided substantial contrast of all measured parameters (color contrast: 0.301; green contrast: -0.105; brightness contrast: -0.912). In the first test phase, during which the largest stimulus size (subtending 30°) was presented, bees reached performance levels between 80% and 100%. Up to a visual angle of 10° performance level stays constant. Performance level decreased for stimuli smaller than 10° visual angle. I plotted minimum visual angle of all tested bees as a function of thorax width.
Minimum visual angle ranged from 3.4° to 7.0°. I found a significant negative correlation between minimum visual angle and body size (Fig. 5). The data clearly show that larger bees possess a higher single object resolution and are therefore able to detect objects of a definite size from a larger distance than their smaller nestmates.
18 20 22 24 26 28 30 A N = 10 rs = 0.78 p < 0.01 O m m a ti di um di am et er 1.2 1.6 2.0 2.4 3000 3300 3600 3900 4200 B N = 10 rs = 0.88 p < 0.001 O m m a ti di a / E ye Eye size (mm2) Fig. 4.
Eye size (measured as eye surface; see material and methods) plotted against A ommatidia diameter and B ommatidia number per eye.
3.3 3.6 3.9 4.2 4.5 4.8 3 4 5 6 7 8 N = 11 rs = -0.73 p = 0.01 Thorax width (mm) M ini m u m v is ual a ngl e (° ) Fig. 5.
Data reveal a significant negative correlation between thorax width and minimum visual angle of bumblebee workers (N = 11, rs =
-0.73, p = 0.01). Dotted line corresponds to the minimum visual angle found in honeybees.
DISCUSSION
The data suggest that the size of a bumblebee affects both investigated properties of its visual system, anatomical eye design and behavioral performance. Larger bumblebee workers seem to possess a superior visual system for object detection compared to their smaller conspecifics.
Optical features
As mentioned above, an increase in eye size can be due to an increase in ommatidia number or ommatidia size. In large bumblebees both ways are realized. Larger workers therefore possess the anatomical condition which is required for an improved eye resolution (Warrant and McIntyre, 1993).
In the case of bumblebees only few data on eye anatomy are available. Meyer-Rochow (1981) investigated ommatidia number and diameter of an “average bumblebee worker” (p. 125) of B.
hortorum. He estimated that one eye contains at least 6000 ommatidia and that ommatidial
diameters range from 26 – 28 µm. Because he gave no data on worker size it is not clear if the higher ommatidia number and diameter he found is due to species-specific differences or to a scaling effect. However, although he did not investigate size effects, he expected that “... dimensions of the eye are adjusted proportionately, correlated with body size” (Meyer-Rochow, 1981; p. 125).
The larger ommatidia number in large individuals indicates smaller interommatidial angles which contribute to a higher spatial resolution. However, the causality between interommatidial angle and ommatidia number is only valid when the shape of the eye stays constant with scaling. In Cataglyphis ants, for example, larger individuals possess more ommatidia with smaller interommatidial angles (Zollikofer et al., 1995). This finding is due to an unchanged surface curvature of the compound eye among different sized ants, i.e. the shape of the eye does not change with size. I took cross sections through the lateral meridian of eyes from small and large bumblebee workers and found no noticeable changes in the curvature of the surface (data not shown). However, a direct measurement of the angular spacing of ommatidia by means of the pseudopupil technique would be recommendable (Stavenga, 1979).
Behavioral performances
To estimate how similar or different two colors are perceived by a bumblebee I applied a bee color model described in chapter one. By means of this model I found that the stimulus (yellow disc) provides sufficient color and green contrast to the background. Bumblebees are therefore able to discriminate between stimulus and back wall on the basis of input from both visual channels, the achromatic and chromatic channel. Under these conditions honeybees can detect objects with a minimum visual angle of 5° (Giurfa et al., 1996; Lehrer and Bischof, 1995). The minimum visual angle of tested bumblebee workers ranged from 3.6° to 7.0°, i.e. small bumblebee workers have a weaker object resolution, whereas large workers possess a better object resolution than honeybees. A medium sized bumblebee worker with a thorax width of
approximately 4.2 mm possesses the same object resolution as found in honeybee workers (Fig. 5). In a recent study Macuda et al. (Macuda et al., 2001) tested the visual acuity (= grating resolution) of Bombus impatiens workers and found that bumblebees possess a 25% better resolution compared to honey bees. Unfortunately, the authors give no data on worker size, so it is hard to estimate the effect of scaling. My results demonstrate that large Bombus terrestris
workers can reach a roughly 40% higher object resolution compared to honeybees. Taking into account that in some bumblebee species workers can reach a much larger body size (for example large B. griseocollis workers can reach the double weight of large B. terrestis workers; Fisher, 1987), visual resolution of these species is expected to be still higher.
Implication on foraging behavior
Spatial resolution of insect pollinators varies among sexes of the same species and among different species. In honeybee drones, for example, the dorso-frontal part of the compound eye comprises a zone of very large ommatidia with small divergence angles (Menzel, 1991), which is assumed to be an adaptation to the mating behavior in honeybees. Drones can detect objects in their dorso-frontal visual field subtending only 0.5° (e.g. a flying queen in a distance of two meter against the sky; Vallet, 1993). Compared to honeybee workers, the density of ommatidial axes per square degree (which is a good measure for spatial resolution) in the dorso-frontal visual field of drones is 7 times higher (Stavenga and Wunderer, 1999).
What are the consequences of differences in the spatial resolution among bumblebee workers for the bearer of a small or a large eye? Large individuals are supposed to be better in all behavioral contexts where vision plays a limiting role. For example, larger bumblebees may fly earlier in dawn and later in dusk when light intensity is still low due to their expected higher light sensitivity. During flight they are able to detect important landmarks in the landscape for orientation at a larger distance than their smaller conspecifics. Spatial resolution also limits search time during foraging on flowers (see chapter one). Bumblebees visit hundred to thousands of flowers in order to fill their crop, because most flowers provide only small quantities of nectar reward. Thus, when search time per flower increases only slightly due to a worse spatial resolution, foraging rates of small workers would drop substantially and their impact on nectar or pollen influx into the colony decreases too. To summarize, all findings indicate that the visual system of large bumblebees is superior in flower detection and orientation during flight than that of their smaller conspecifics.
A bumblebee colony exhibits a size-related division of labor among its members. Larger workers tend to forage outside the nest, smaller ones perform nest tasks (Cumber, 1949; Free, 1955b; Garófalo, 1978). It is assumed that by allocating its largest foragers to foraging a colony will maximize its nectar influx because of the higher foraging rates of larger workers (see chapter four). My data support the idea that not only physical factors may responsible for higher foraging rates in large bumblebees, but also neglected sensory limitations due to different sensory capabilities.
C
HAPTER
III
Size Polymorphism in the Olfactory System of
Bumblebees
Abstract
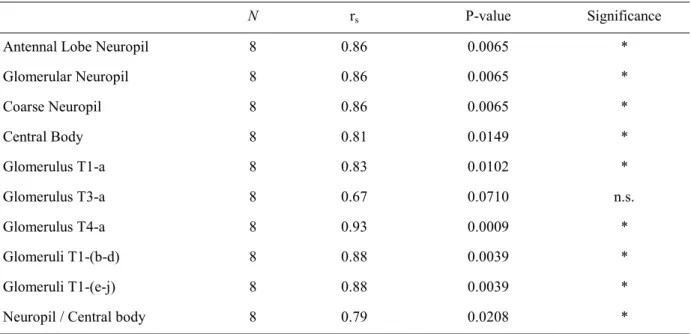
Olfaction is a very important sensory modality in an insect’s life. It is essential in most behavioral tasks. Pollinating insects, for example, utilize species-specific odors for detecting and identifying nectar and pollen rich flowers. I investigated the olfactory system of an important insect pollinator, Bombus terrestris, and the effect of scaling on its antennal olfactory sensilla and the first olfactory neuropil, the antennal lobes. Bumblebees exhibit a pronounced size polymorphism among workers of the same colony. I found that worker size (2.7 to 4.3 mm head width) correlates significantly with sensilla number (sensilla placodea; 708 to 2594 per antenna), sensilla density (2377 to 3168 mm-2), volume of antennal lobe neuropil (5.7 to 19.0 * 106 µm3) and volume ofsingle identified glomeruli. The enlarged volume of the first olfactory neuropil in large individuals is caused by an increase in glomeruli volume and coarse neuropil volume. Additionally, beside an overall increase of brain volume with scaling I found that the olfactory neuropil increases disproportionately compared to a higher order neuropil, the central body.
The data predict a higher odor sensitivity in larger bumblebee workers. Thus I propose B.
terrestris as an excellent model system for testing the implication of sensilla number on
INTRODUCTION
Olfaction is a very important sensory modality in an insect’s life. It is essential in most behavioral tasks: orientation (Cardé and Minsk, 1997; Chittka et al., 1999b), feeding (Bernays and Chapman, 1994), mating (Cardé and Minsk, 1997) and communication (Free, 1987; Hölldobler, 1995; Vander Meer et al., 1998). The majority of insect olfactory sense organs (sensilla) are located on the antennae, which are specific modified head appendages (Keil, 1999). The number of olfactory sensilla on the antennae among different species ranges from a few tens up to 100.000 with more than 300.000 sensory neurons (Chapman, 1982). The highest sensilla numbers are found in male insects which need to find females over long distances. Intra-specific differences in the number of sensilla are related to size, sex, different feeding habits or behavioral specializations (Bernays et al., 2000; Chapman, 1982).
Besides differences in sensilla number, insect species also differ in the organization of their first olfactory brain neuropil, the antennal lobes (Rospars, 1988). The antennal lobes are composed of small spherical subunits, called glomeruli, in which the synaptic connections between the invading antennal sensory neurons and the antennal lobe interneurons occur (Boeckh et al., 1990; Boeckh and Tolbert, 1993). It is assumed that the individual glomerulus is a functional unit and the spatial array of the glomeruli in the antennal lobe represents a functional separation of different input channels, i.e. similarly tuned sensory neurons project into the same glomerulus or group of glomeruli (Hansson and Christensen, 1999). Evidence for this hypothesis comes from selective staining of identified sensory neurons (Hansson, 1997; Hansson et al., 1992) and from functional Ca++ imaging techniques (Galizia et al., 1999b). The number and spatial arrangement of glomeruli is mostly invariant within species. However, intraspecific differences in the number of glomeruli may occur between sexuals. In many moth species, for example, males possess enlarged glomerular complexes (so-called macroglomerular complexes) which are lacking in females, specialized for the perception of the female’s sex-pheromones (Hildebrand, 1996). Additional to variation in glomeruli number, the volume of glomeruli can vary among individuals of the same species. In the hemimetabolous insect
Periplaneta americana, for example, glomeruli volume increases up to the adult stage due to an
addition of sensilla with each larval instar (Prillinger, 1981). Sensilla number as well as glomeruli number and glomerular volume, are thought to be correlated with qualitative and quantitative differences in odor perception (Hansson and Christensen, 1999).
In the present study I examine size-related effects on the number of olfactory sensilla and on the volume of antennal lobe neuropil in adult workers of Bombus terrestris. The olfactory system of bumblebees resembles that of the closely related honeybees. The antennae bear the same main olfactory sensilla type, the sensilla placodea (Agren and Hallberg, 1996; Esslen and Kaissling, 1976). In bumblebees, these sensilla are innervated by 13-20 sensory neurons, most commonly 14-15 (Agren and Hallberg, 1996). Electrophysiological recordings in honeybees demonstrated that the poreplate sensory neurons are sensitive to a variety of plant and flower odors as well as pheromones (Vareschi, 1971). All poreplate sensory neurons project into the glomeruli of the antennal lobe. The sensory neurons of a single poreplate project to different