Responses of microbial community functional structures to pilot-scale uranium in
situ bioremediation
Meiying Xu
1,2, Wei-Min Wu
3, Liyou Wu
1, Zhili He
1, Joy D Van Nostrand
1, Ye Deng
1, Jian Luo
4,
Jack Carley
5, Matthew Ginder-Vogel
3, Terry J Gentry
5, Baouhua Gu
5, David Watson
5, Philip M
Jardine
5, Terence L Marsh
6, James M Tiedje
6, Terry Hazen
7, Craig S Criddle
3and Jizhong Zhou
1,7 1Institute for Environmental Genomics and Department of Botany and Microbiology, University ofOklahoma, Norman, OK, USA;
2Guangdong Provincial Key Laboratory of Microbial Culture Collection and Application, Guangdong Institute of Microbiology, Guangzhou, China;
3Department of Civil and Environmental Engineering, Stanford University, Stanford, CA, USA;
4Department of Civil and Environmental Engineering, Georgia Institute of Technology, Atlanta, GA, USA; 5Oak Ridge National Laboratory, Environmental Sciences Division, Oak Ridge, TN, USA;
6Center for Microbial Ecology, Michigan State University, East Lansing, MI, USA 7Lawrence Berkeley National Laboratory, Earth Sciences Division, Berkeley, CA, USA
A pilot-scale field test system with an inner loop nested within an outer loop was constructed for in situ U(VI) bioremediation at a US Department of Energy site, Oak Ridge, TN. The outer loop was used for hydrological protection of the inner loop where ethanol was injected for biostimulation of microorganisms for U(VI) reduction/immobilization. After 2 years of biostimulation with ethanol, U(VI) levels were reduced to below drinking water standard (<30 μgl-1) in the inner loop monitoring wells. To elucidate the microbial community structure and functions under in situ uranium bioremediation conditions, we used a comprehensive functional gene array (GeoChip) to examine the microbial functional gene composition of the sediment samples collected from both inner and outer loop wells. Our study results showed that distinct microbial communities were established in the inner loop wells. Also, higher microbial functional gene number, diversity and abundance were observed in the inner loop wells than the outer loop wells. In addition, metal-reducing bacteria, such as Desulfovibrio, Geobacter, Anaeromyxobacter and Shewanella, and other bacteria, for example, Rhodopseudomonas and Pseudomonas, are highly abundant in the inner loop wells. Finally, the richness and abundance of microbial functional genes were highly correlated with the mean travel time of groundwater from the inner loop injection well, pH and sulfate concentration in groundwater. These results suggest that the indigenous microbial communities can be successfully stimulated for U bioremediation in the groundwater ecosystem, and their structure and performance can be manipulated or optimized by adjusting geochemical and hydrological conditions.
Keywords: bioremediation; functional genes; GeoChip; microbial community; uranium bioreduction
Introduction
Uranium produced by mining and enrichment
activities during the Cold War is a major soil
and groundwater contaminant at US
Department of Energy sites. In many
instances, uranium in contaminated
groundwater is in the U(VI) form, which is
highly soluble and mobile in the subsurface
environments. Under the appropriate
conditions, the highly soluble U(VI) can be
reduced to insoluble U(IV) and precipitated as
mineral uranium by biotic and/or abiotic
reactions (Hazen and Tabak, 2005; Tabak et
al., 2005). A promising strategy for preventing
the spread of subsurface uranium
contamination is by U(VI) bioreduction and
immobilization (Lovley et al., 1991; Bender et
al., 2000; Istok et al., 2004; Wu et al., 2007).
In recent years, different scales of U(VI)
bioreduction/ immobilization have been tested
(Finneran et al., 2002; Holmes et al., 2002;
Anderson et al., 2003; Istok et al., 2004; Gu et
al., 2005; Wu et al., 2006c, d), and a wide
phylogenetic diversity of microorganisms have been found to be capable of reducing U(VI) and other metals in pure and mixed cultures (Lovley, 1991; Wall and Krumholz, 2006).
Following addition of an electron donor such as ethanol or acetate, U(VI) reduction is dependent on subsequent microbial activity and appropriate geo-chemical conditions. Various microorganisms may be important in uranium bioremediation through direct enzymatic reactions and/or indirect chemical
reductions (Wuet al., 2007). The reduction of U(VI)
to U(IV) typically coincides with an increase in populations of Fe(III)-reducing and sulfate-reducing
bacteria (SRB) (Holmes et al., 2002; Wall and
Krumholz, 2006; Cardenas et al., 2008). However,
U(VI) reduction is transient and the maintenance of microbial populations capable of U(VI) reduction is one of the key issues for a long-term reduction and
stabilization of uranium in situ (Anderson et al.,
2003). During in situ bioremediation, the delivery
of electron donor and the resulting reduction/ oxidation reactions are also related to subsurface hydrology. Therefore, the impact of hydrological parameters on microbial populations and the U(VI)
reduction process should be considered (Luoet al.,
2005, 2007). To date, most of the efforts to describe microbial communities during the remediation of uranium have been focused on phylogenetic
composition (Nevin et al., 2003; Brodie et al.,
2006; Akob et al., 2007, 2008). Little research has
been undertaken to determine the microbial com-munity functional structure and its possible rela-tionship to hydrogeochemical parameters during
thein situ bioremediation of uranium.
One of the major challenges for linking the microbial community structure to ecosystem func-tioning is the extreme diversity and as-yet unculti-vated status of many microorganisms. Functional gene arrays, which contain the genes encoding key enzymes involved in biogeochemical cycling pro-cesses, have been used to overcome such obstacles for studying microbial communities (Zhou, 2003). GeoChip 2.0, which covers more than 10 000 genes involved in critical microbially mediated biogeo-chemical processes, has been successfully used for tracking and studying the biogeochemical processes in different ecosystems including the dynamics of
metal-reducing bacteria during in situ
bioremedia-tion in contaminated groundwater (He et al., 2007;
Van Nostrand et al., 2009; Waldron et al., 2009).
Combined with multivariate statistical analyses (Ramette, 2007), several systematic experimental evaluations have indicated that GeoChip can be used as a specific, sensitive tool for detecting microbial populations and functional processes in
environmental settings (Wuet al., 2001; Rheeet al.,
2004; Gentry et al., 2006; Zhou et al. 2008; Wang
et al. 2009).
A pilot-scale field test for in situ bioremediation
of U(VI) has been conducted in Area 3 of the
Department of Energy’s Oak Ridge site (Wu et al.,
2006c, d, 2007). After 2 years of bioremediation by intermittent injection of ethanol into the inner loop, U(VI) concentrations in the groundwater
decreased from the initial concentration of 50 mg l1
to below the US Environmental Protection Agency maximum contaminant level for drinking water
(o30mg l1), and a new microbial community had
been established in both sediments and
ground-water (Wuet al., 2007; Cardenaset al., 2008; Hwang
et al., 2009). The objective of this study was to characterize the functional structure of the sediment microbial communities at the Oak Ridge site after 2 years of successful bioremediation using GeoChip-based metagenomic technologies.
Materials and methods
Experimental design and sampling procedures
The pilot-scale treatment system for uranium bio-remediation was located in Area 3 at the Integrated Field Research Site field site adjacent to the former S-3 Pond at the Y-12 National Security Complex, Oak Ridge, TN. This test system was composed of an outer loop for hydraulic protection and an inner loop for bioreduction by injecting ethanol with three
multilevel sampling (MLS) wells for routine
monitoring (Supplementary Figure 1). The full des-cription of the hydraulic connection between the
wells is reported elsewhere (Luoet al., 2006, 2007).
Biostimulation with ethanol was started on
7 January 2004 (day 137) and continued by injection
of ethanol (1.07–1.34 mM) at a flow rate 0.45 l min1
into FW104 over a 48 h period each week (Wuet al.,
2006d). After 2 years of treatment, aqueous U concentrations fell below the US Environmental Protection Agency maximum contaminant level (o30mg l1; Wu et al., 2007). On day 774, the total amount of ethanol injected was 4100 g, and sedi-ment samples were collected from 11 wells by the surge block method as previously described (Wu et al., 2006d), including outer injection well (FW024), outer extraction well (FW103), inner injection well (FW104), inner extraction well (FW026) and seven MLS wells in different depths below ground surface (bgs) with three outer loop monitoring wells: FW100-2 (13.7 m bgs), FW100-3 (12.19 m bgs) and FW100-4 (10.67 m bgs) and four inner loop monitoring wells: FW101-2 (13.7 m bgs), FW101-3 (12.19 m bgs), FW102-2 (13.7 m bgs) and FW102-3 (12.19 m bgs). After sediment sampling, we characterized the hydrology of the treatment zone by injecting a conservative tracer (sodium bromide) together with ethanol and monitoring the mean travel time (MT) and bromide recovery (BR) as
described by Luoet al. (2007).
Analytical methods
Previous reports (Wu et al., 2006c, d, 2007) have
given detailed descriptions about the source and
1061 2
quality of chemicals used at the field site, methods used to measure sulfate, sulfide, nitrate-N, cations (Fe, Mn, U and so on), ethanol and acetate, the use of a kinetic phosphorescence KPA-11 analyzer for U analysis (Chemchek Instruments, Richland, WA, USA), and groundwater and sediment sample collection.
DNA extraction, amplification and labeling
Sediment DNA was extracted by freeze-grinding mechanical lysis and purified by Wizard DNA Clean-up System (Promega, Madison, WI, USA) as
described previously (Zhou et al., 1996). Rolling
circle amplification of 50 ng purified DNA was carried out using the TempliPhi kit (GE Healthcare, Piscataway, NJ, USA) and the products were labeled with cyanine-5 using random priming with
mod-ified protocols described by Wu et al. (2006a).
Labeled DNA was purified using QIA Quick Puri-fication kit (Qiagen, Valencia, CA, USA) according to the manufacturer’s instructions, measured on a ND-1000 spectrophotometer (NanoDrop Technologies Inc., Wilmington, DE, USA) and then dried down in a SpeedVac (ThermoSavant, Milford, MA, USA) at
451C for 45 min.
Microarray hybridization
A 50mer functional gene array, also called GeoChip
2.0 (He et al., 2007) was used to dissect the
functional structure of the sediment microbial communities from different wells. All
hybridiza-tions were carried out in triplicate at 451C with 50%
formamide for 10 h after a 45 min prehybridization
with a prehybridization solution (5SSC, 0.1%
SDS and 0.1% bovine serum albumin) as described
by Waldron et al. (2009). Following hybridization,
the slides were then washed three times at 451C for
1 min and one time at room temperature (RT) for 30 s
with a 1.5 min soaking using wash buffer I (1SSC,
0.1% SDS), one time at RT for 1 min with a 1.5 min
soaking using wash buffer II (0.1SSC, 0.1% SDS),
four times at RT for 1 min using wash buffer III
(0.1SSC), one time at RT for 1 min using water and
then dried at RT under a slow stream of nitrogen gas. All prehybridization, hybridization and washing processes were performed using a HS4800 Hybridi-zation Station (TECAN US, Durham, NC, USA). After hybridization, the arrays were imaged by ScanArray Express Microarray Scanner (PerkinElmer, Boston, MA, USA) and analyzed using ImaGene version 6.0 (BioDiscovery, El Segundo, CA, USA). Raw data output from ImaGene was submitted to Microarray Data Manager in our website (http:// ieg.ou.edu/microarray/) and was analyzed using a GeoChip 2.0 data analysis pipeline. A signal to noise
ratio of X1.5 was considered as a positive signal.
For the GeoChip 2.0 design, in most cases three probes target the same gene, or the same group of highly similar genes with few targets only having
one or two probes (He et al., 2007). Because three
replicates (up to nine data points) were conducted for each sample in this study, at least 0.34 time of the final positive spot (probe) number (minimum of two spots) was required for each detected gene.
Data analysis
Data normalization was based on the mean signal intensity between replicates. After normalization, each hybridization/sample had a total of signal intensities from all detected probes. Total abun-dance of each sample scored as present was the sum of the normalized intensity of the sample on the microarray. To allow comparison across experimen-tal samples, we calculated relative abundance values for each gene category by dividing the total normalized intensity of a certain gene category by the sum of the normalized intensity of the gene categories detected for the sample. Each probe on the GeoChip was mapped to its target, which is from a cultured or uncultured microorganism/taxa. If an organism had multiple probes, the average signal intensity was taken. The abundance for a specific taxa (for example, species, family, order, class) is the sum of signals from different organisms detected in this taxa. For comparing a particular functional gene from a certain organism in different samples, we calculated the average abundance of this gene by dividing the sum of normalized intensity of this gene by the number of detected gene sequences for this organism.
Principal component analysis (PCA), redundancy analysis (RDA) and variation partitioning analysis (Ramette and Tiedje, 2007) were performed with the package CANOCO 4.5 (Biometris/Plant Research International, Wageningen, The Netherlands) using functional gene communities and environmental parameters for each sediment sample as covariables and significance was tested by a Monte Carlo permutation test based on 999 random permuta-tions. To identify patterns of variation among functional gene communities, we normalized envir-onmental variables by subtraction of the mean and division by standard deviation before performing multivariable analyses. Significant Pearson’s linear correlation (r) analysis was conducted in SPSS 10.0 for Windows (SPSS Inc., Chicago, IL, USA).
Correla-tions were considered significant at a Po0.05
baseline and considered to indicate a strong trend
at a Po0.10 baseline. Hierarchical clustering was
performed in Cluster 3.0 using the pairwise com-plete-linkage hierarchical clustering algorithm and trees were visualized using TreeView.
Results
Microbial functional gene diversities
After two 2 years of biostimulation, low levels of
uranium (o30mg l1) were achieved and maintained
in the inner MLS located at the fast flow zone of the
test system (Wuet al., 2007; Cardenaset al., 2008).
The major geochemical parameters related to micro-bial activities on day 774 when the sediment samples were collected from these wells are pre-sented in Table 1. Sulfide was detected in both groundwater and sediment in the inner loop due to SRB activities. The sediments from the inner loop wells were reduced with U(IV) (except for FW026) and higher Fe(II) content, but those in the outer loop were less reduced. An ordination plot constructed on the basis of the geochemical parameters sepa-rated the inner loop samples from the outer loop samples as two main clusters (Supplementary Figure S2). The microbial community compositions of the 11 sediment samples were analyzed with the GeoChip 2.0. More than 2350 genes in 138 gene families showed positive hybridization signals. Overall, the gene numbers and signal intensities detected revealed significant differences between the inner loop and outer loop wells. Most of the samples from the inner loop contained higher gene numbers and signal intensities than those from the outer loop. For instance, the number of genes with statistically significant positive signals in the outer loop injection well FW024 and extraction well FW103 was 25 and 123, whereas the number detected in the inner loop injection well FW104 and extraction well FW026 was 393 and 227, respec-tively. Furthermore, the overall genetic diversity detected in each of the sediment samples suggested that bioremediation treatment had strong effects on the microbial communities. Both Simpson’s
diver-sity index (1/D) and Shannon–Weaver index (H0)
indicated that the levels of genetic diversity in the outer loop wells were much lower than those in the
biostimulated inner loop wells. The1/Din the inner
loop injection well FW104 and extraction well
FW026 was 582.7 and 413.6, whereas the 1/D in
the outer loop injection well FW024 and extraction well FW103 was only 125.5 and 216.2, respectively. The proportion of overlapping genes in different samples was consistent with the bioremediation treatment. For the inner loop injection well FW104, only 2.2% and 11.2% of the genes detected shared with the outer loop injection well FW024 and extraction well FW103, respectively, whereas higher proportions were shared with the genes from inner loop wells. These results suggested that microbial communities were effectively stimulated by the addition of electron donor, and similar community compositions were constructed within the same treatment loop.
Cluster analysis with the all microarray hybridi-zation data indicated that 11 wells were separated into two broad groups (inner loop and outer loop) (Figure 1a). Five major gene groups can be visua-lized (Figure 1b), which seemed to well correlate with the location of the wells. In groups 1, 2 and 4, the average signal intensities in the samples from
the outer loop wells were much higher than those Table
1 Maj or geoche mical pro perties of the tr eatment area after bio remediati on (5 Oc tober 20 05) Location Outer loop wells Inner loop wells r a P b Paramet ers Abbreviation 024 103 100-2 100-3 100-4 104 026 101-2 101-3 102-2 102-3 Groundwate r pH pH 5.87 5.92 5.50 5.87 5.80 5.75 5.74 6.23 6.10 6.45 6.23 0.752 0.008 Sulfate (mg l 1) G-sulfate 151.8 145.3 148.1 139.3 138.6 113.0 114.9 102.7 114.9 96.6 105.8 0.963 o 0.001 Sulfide (mg l 1) G-sulfide 0.016 0.29 0 0 0 9.6 1.18 13.8 3.46 5.17 11.43 0.874 o 0.001 Nitrate-N (mg l 1) G-nitrate 2.1 1.37 3.36 4.48 313.6 0 1.37 0 0.59 0.70 0.14 0.313 0.349 U(VI) (mg l 1) G-U(VI) 0.022 0.047 0.233 0.078 0.358 0.136 0.125 0.036 0.026 0.020 0.014 0.468 0.146 Fe (mg l 1) G-Fe 0.16 0.21 0.14 0.15 0.18 1.74 0.34 1.9 0.29 2.2 2.5 0.910 o 0.001 Mn (mg l 1) G-Mn 0.75 1.18 2.57 1.48 4.51 3.98 3.93 4.05 3.45 4.26 4.56 0.710 0.014 Sedi ment U(IV)/U S-U(IV)/U 0 0 0 0 0 61 0 54 51 17 30 0.743 0.009 U(VI) (mg kg 1) S-U(VI) 371 658 980 1098 1501 10300 1220 574 894 429 612 0.049 0.886 T otal Fe (g kg 1) S-Fe 50.8 44.9 32.4 36.2 34.4 199.1 47.1 43.3 29.4 33.7 36.4 0.182 0.592 Fe(II) (g kg 1) S-Fe(II) 11.13 0.23 4.10 2.30 1.87 105.5 6.97 11.86 8.64 10.41 10.45 0.309 0.356 Sulfide (g kg 1) S-sulfide 0.07 0 0 0 0 23 0.034 0.67 0.27 0.56 0.43 0.245 0.468 T race test c Mean trav el time (h) MT 7.8 7.8 223 43 211 0 8.1 2.9 17.9 11.6 3.7 0.507 0.111 Bromide recovery (%) BR 4.5 10 12 18 8 100 50 93 60 94 94 0.901 o 0.001 Abbreviations: BR, bromide recovery; MT , mean travel time. aPearson’ s linear correlation between PC1 scores and geochemical parameters. bP -value for two-tailed significance test, bold values are statistically significant ( P o 0.05). cMT is the mean travel time between injection well and monitoring well. High bromide recovery indicated better hydraulic connection to inner loop inje ction well. 1063 4
from the inner loop wells, whereas in groups 3 and 5 the samples with high signal intensities were all from the inner loop wells. Functional genes for organic contaminant degradation and metal resis-tance were the main groups, especially in groups 3 and 5. The biggest group, group 5, was clustered into two subgroups, which were mostly contributed by the samples from inner loop injection well (FW104) and extraction well (FW026), respectively. Metal resistance genes were more enriched in FW104, such as for arsenic resistance (arsB) (gi.3095051), cadmium, zinc and cobalt resistance (gi.1749680), and chromate transport (gi.23012809). In addition, high average signal intensities were also detected
from several important U(VI)-reducing bacteria (for
example, Anaeromyxobacter sp., Desulfovibrio sp.,
Geobactersp.,Shewanellasp.) in sample FW104.
Principal component analysis was used to exam-ine overall patterns of variation among functional gene communities of these 11 sediment samples. Similar to the PCA results based on geochemical data, the inner loop microbial communities are well separated from the outer loop microbial commu-nities along PC1, which explained 25.8% of the total variance (Figure 2). These results suggested that the microbial community functional structures were significantly altered in the inner loop by bioreme-diation efforts. 1 2 3 4 5 Group 1 Group 2 Group 3 Group 4 0 0.2 0.4 0.6 0.8 1 1.2 1.4 1.6 0 0.2 0.4 0.6 0.8 1 1.2 1.4 1.6 0 0.2 0.4 0.6 0.8 1 1.2 1.4 1.6 0 0.2 0.4 0.6 0.8 1 1.2 1.4 1.6 0 0.2 0.4 0.6 0.8 1 1.2 1.4 1.6 102-3 101-3 101-2 102-2 100-4 100-2 100-3 Group 5 FW FW FW026 FW FW104 FW FW FW FW FW103FW024
Figure 1 Cluster analysis of all genes detected by GeoChip 2.0. The figure was generated using Cluster and visualized in TreeView.
Black indicates signal intensities below the threshold value and red indicates a positive hybridization signal. The color intensity indicates differences in signal intensity. Eleven samples were clearly separated into two groups: outer loop and inner loop. Five gene patterns were observed and indicated by numbers in the tree (a), and also illustrated in the graphs (b).
1064
Characteristics of individual functional gene groups relevant to U(VI) reduction
Overall, the relative abundances of different gene categories in the inner loop samples were more consistent than those in the outer loop samples (Figure 3). Total signal intensities of the functional gene categories in the inner loop were much higher
than the outer loop, including dsr genes,
cyto-chrome c genes, metal resistance genes,
denitrifica-tion genes and organic remediadenitrifica-tion genes. For example, the organic remediation genes were the most abundant genes detected among all samples, ranging from 33.9% to 35.6% in the inner loop samples and 28.9–36.2% in the outer loop samples, respectively. The abundance of the genes involved in metal resistance varied from 11.8% to 15.5% in the inner loop samples and 9.6–15.3% in the outer loop samples, respectively.
Most of the genes involved in aromatic and chlorinated compound (TCE) degradation were abundant in the inner loop wells (Supplementary Figure S3A). The benzoyl-CoA reductase gene from
Rhodopseudomonas palustris (gi.2190579) was
abundant across most samples (Supplementary Figure S3A). For sulfate reduction genes, the samples from the inner loop and the outer loop were also well separated along PC1 axis, which explained 32.7% of the total variance (data not
shown). Most of dsrA/B genes were dominated in
inner loop injection well (FW104), extraction well (FW026), MLS wells FW101-2 and FW102-2.
A positive correlation (r¼0.567, P¼0.069) was
observed between signal intensities of SRB detected and uranium concentrations in sediments. Based
on hierarchical cluster analysis, 75% of the dsr
genes detected by GeoChip were based on the probes from environmental libraries and most of them were originally found at the Integrated Field Research Site (Supplementary Figure S3B). The Integrated Field Research Site groundwater clone TPB16009B
1.0 -1.0 -0.8 0.8 FW101-3 FW102-3 FW026 FW104 FW101-2 FW102-2 FW100-2 FW100-4 FW100-3 FW024 FW103 25.8% 18.8%
Figure 2 Ordination plot produced from principal component
analysis (PCA) of all of genes detected by GeoChip 2.0. Open circles represent samples collected from five outer loop wells and solid circles represent samples collected from six inner loop wells. 0% 20% 40% 60% 80% 100% 100-2 100-3 100-4 101-2 101-3 102-2 102-3 Wells Relative abundance
C degradation C fixation Sulfate reduction Cytochrome c Metal resistance Methane generation Methane oxidation N fixation N oxidation/assimilation Nitrate/nitrite reduction Contaminant degradation
Outer loop Inner loop
FW024 FW103 FW FW FW FW104 FW026 FW FW FW FW
Figure 3 Relative abundance of all functional gene groups. The total signal intensity of genes detected for different wells was used to
calculate the relative abundance of each gene group. The patterns represent the different gene categories detected.
1065 6
was abundant in all samples except the outer loop injection well (FW024). These results also indicated that the GeoChip-based detection is reliable even though the detected number of genes is lower in some samples.
Over all sampling wells, the genes detected by GeoChip were based on the probes from 234 microbial genera. Microorganisms from or similar to
a-proteobacteria (Rhodopseudomonas), g
-proteo-bacteria (Pseudomonas and Shewanella) and
d-proteobacteria (Anaeromyxobacter, Desulfovibrio
and Geobacter) were detected in all samples.
Interestingly, most of these microorganisms are capable of U(VI) reduction (Wall and Krumholz,
2006; Wuet al., 2006d; Amoset al., 2007) and those
from d-proteobacteria have also been detected
from the samples using 16S rRNA clone libraries
(Cardenas et al., 2008). However, a significant
change was observed in the average intensities of these microorganisms based on the number of
cytochromecgenes detected (Figure 4). The average
signal intensities of these microorganisms detected from inner loop wells were much higher than those from outer loop wells. Comparing the genera detected from different wells, we observed less than 30% overlap between the inner loop injection well FW104 and the outer loop injection well FW024, whereas more than 61% overlap was detected between the injection well FW104 and exaction well FW026 in the inner loop. Much higher signal intensity derived from uncultivated bacteria was detected from FW104 than FW024. More than 10 times higher total
intensities of these populations were detected from inner loop injection and extraction wells than those from outer loop where electron donor was limited.
Relationship of microbial community functions and hydrogeochemical parameters
The difference in microbial community structure among the different wells could be influenced by hydrogeochemical parameters. Six hydrogeo-chemical parameters, groundwater sulfate concentra-tion (G-sulfate), groundwater nitrate concentraconcentra-tion (G-nitrate), pH, sediment Fe(II) content [S-Fe(II)], MT and BR (Table 1), were selected based on a forward selection procedure and variance inflation factors with 999 Monte Carlo permutations. The forward selection for RDA models provided the evaluation of the six parameters with the following order from the most to the least explicative vari-able of the microbial functional gene data: G-sulfate
4pH4MT4S-Fe(II)4G-nitrate4BR. The
vari-ance inflation factors of these six parameters were all less than 20.
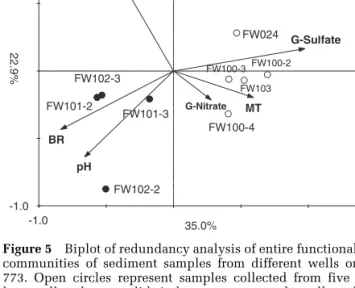
The relationship between the functional gene communities and the six parameters in the RDA ordination plot (Figure 5) was very consistent with the PCA ordination patterns. The first axis of the RDA explained 35.0% of the variation in functional gene communities, and is positively correlated with the samples from the outer loop wells and nega-tively correlated with the samples from the inner loop wells. Interestingly, the injection well from
Well
Average signal intensity ratio
0.0 0.1 0.2 0.3 0.4 0.5 0.6 0.7 Anaeromyxobacter sp. Desulfovibrio sp. Geobacter sp. Rhodopseudomonas sp. Shewanella sp.
Outer loop Inner loop
12 11 10 9 8 7 6 5 4 3 2 1 0
Figure 4 Relative abundance of cytochromecgenes detected from different microorganisms. The relative abundance of genes was
calculated from different samples based on the average signal intensity of each microorganism. The patterns represent the different gene categories detected. 1, FW024; 2, FW103; 3, FW100-2; 4, FW100-3; 5, FW100-4; 6, FW104; 7, FW026; 8, FW101-2; 9, FW101-3; 10, FW102-2; 11, FW102-3.
inner loop (FW104) grouped closely with its extrac-tion well (FW026), and the injecextrac-tion and extracextrac-tion wells from outer loop (FW024 and FW103) grouped together in the RDA profile.
These six hydrogeochemical parameters explai-ned 65.8% of the total variance. Within these six parameters, G-sulfate appeared to be the most important environmental parameter, which
signifi-cantly explained 23% (P¼0.001) of the variance.
Among these six parameters, significant correlations
were observed between G-sulfate and BR (r¼ 0.868,
P¼0.001), pH and BR (r¼0.829,P¼0.002), G-sulfate
and pH (r¼ 0.707,P¼0.015) and G-nitrate and MT
(r¼0.647,P¼0.031).
To better understand how much each environ-mental variable influences the functional commu-nity structure, we performed variation partitioning analysis. Among the three important environmental parameters, G-sulfate, pH and MT, no significant correlations were observed between G-sulfate and
MT (r¼0.499, P¼0.118); negative correlation was
observed between G-sulfate and pH (r¼ 0.707,
P¼0.015), and pH and MT (r¼ 0.560, P¼0.073).
A total of 48.1% variations of microbial commu-nities can be explained by G-sulfate, pH and MT, as well as by their interactions. G-sulfate was able to independently explain 17.1% of the variation observed whereas pH explained 14.2% and MT explained 12.4%. Interactions between the three variables appeared to have more influence in this system than individual environmental variables. These results suggest that pH, the concentration of sulfate and the hydraulic flow of groundwater
appeared to be key factors in shaping microbial community functional structures in this system.
Discussion
Microbially mediated reduction of highly soluble uranium (VI) to insoluble uranium (IV) is a promis-ing strategy for the potential remediation of uranium-contaminated groundwater. In this test system, a nested-well groundwater recirculation facility was used to achieve hydraulic control and a series of conditioning steps were accomplished to create a new microbial community for uranium
bioremediation (Wu et al., 2006c, d). After 2 years
of performance, a low uranium level (o0.30mg l1)
was achieved and maintained stably under
anaero-bic conditions (Wuet al., 2007). This was the first
demonstration that high-level uranium-contami-nated groundwater can be successfully
bioreme-diated in situ to the level below the maximum
contaminant level.
Knowledge of microbial community structure and their functions in relation to environmental conditions is important for designing a successful bioredmediation strategy (Lovley, 2003). Microbial communities can be stimulated to be more effective in U(VI) reduction in response to ethanol injection. It is expected that those stimulated populations are able to grow with ethanol or/and use ethanol or its derived products as electron donors. In this case, distinct microbial communities could be formed between inner loop and outer loop wells due to the differences of ethanol and intermediate (acetate) concentrations. This is supported by our GeoChip data. First, high diversity and abundance of microbial populations and functional genes were observed in the inner loop wells, especially for microorganisms/genes involved in metal reduction/ resistance and organic remediation. Also, although most of the known U(VI)-reducing bacteria were found in both inner and outer loop wells, little overlap in the U(VI)-reducing microbial commu-nities was observed between those two zones. In addition, more than 10 times higher total signal intensity was detected from U(VI)-reducing bacteria in the inner loop injection well FW104 than in outer loop injection well FW024. These results indicated that microbial communities could be critical in reducing U to very low concentrations.
As distinct microbial communities were observed between the inner and outer loop well, it is expected that some microbial populations related to U(VI) reduction were stimulated or enriched in the inner loop wells. Indeed, we observed that the
U(VI)-reducing bacteria, Desulfovibrio spp. (Lovley and
Phillips, 1992; Payne et al., 2002), were enriched in
the inner loop. Also, in recent years, many studies
have indicated thatAnaeromyxobacterspp. are
invol-ved in U(VI) reduction in contaminated subsurface
environments (North et al., 2004; Wu et al., 2006b;
1.5 -1.0 -1.0 1.0 pH G-Sulfate MT G-Nitrate BR S-Fe(II) FW024 FW104 FW026 FW103 FW100-2 FW100-3 FW100-4 FW101-2 FW101-3 FW102-2 FW102-3 22.9% 35.0%
Figure 5 Biplot of redundancy analysis of entire functional gene
communities of sediment samples from different wells on day 773. Open circles represent samples collected from five inner loop wells, whereas solid circles represent samples collected from six outer loop wells. Descriptors (arrows) are the concentration of three geochemical parameters (sulfate, pH and nitrate) in ground-water, mean travel time (MT), bromide recovery (BR) in the subsurface and Fe(II) content in sediment [S-Fe(II)].
1067 8
Sanfordet al., 2007; Akobet al., 2008; Cardenaset al., 2008). In addition, although there is very little information about the metal reduction of the versatile
photosynthetic bacterium Rhodopseudomonas spp.,
the complete genome sequence of R. palustris
indi-cated that this strain contains several cytochrome c
genes (Larimer et al., 2004), which were detected
frequently in the inner loop wells by GeoChip. Finally,
the high proportion of Pseudomonas spp. genes
detected could be due to the presence of other carbon sources such as aromatic, chlorinated compounds, which were detected in the groundwater before
biostimulation (Wu et al., 2006c) as well as
degrada-tion of dead biomass grown on ethanol. They could
be importantin situU bioremediation by maintaining
environments favoring U(VI) reduction. Those stimu-lated key microbial populations may be important directly or indirectly in U(VI) reduction and main-tenance of a low uranium concentration in this system. Microbial community structures and functions are affected by many environmental factors, such as electron donors and acceptors, concentrations of chemical compounds, environmental pH, and hydrological conditions in aqueous systems. It has been reported that the reduction of aqueous U(VI) can be enhanced by the presence of aqueous sulfate
at laboratory, pilot or field scales (Spearet al., 2000;
Wu et al., 2006d). Nyman et al. (2007) found that
sulfate was required for the growth of
U(VI)-reducing bacteria, and Desulfovibrio-like species
were predominant organisms in U(VI)-reducing enrichments from U(VI)-contaminated sediment.
Similar to our previous studies (Wu et al., 2006a;
Heet al., 2007), the signal intensities of manydsrA/
B containing sulfate-reducing populations
pre-viously recovered from this site showed significant correlations with the bioremediation treatment. A
high abundance of cytochrome c genes was also
obtained from the important SRB,Desulfovibriospp.
The relative abundance of Desulfovibrio spp. from
inner loop wells, where ethanol was added as an electron donor, was substantially higher than those from outer loop wells. Sulfate level could
signi-ficantly explain 17.1% (P¼0.028) of the microbial
community variations (Figure 5). It is highly possible that sulfate in the treated area supported the growth of U(VI)-reducing SRB and facilitated U(VI) reduction.
In addition to amendment with electron donor, pH adjustment is another key strategy for U(VI)
reduction in situ. U(VI) adsorption is highly pH
dependent and a slight pH change near the optimal pH (6.0) for U(VI) adsorption could cause a relatively large change in the U(VI) concentration
(Bostick et al., 2002; Liu et al., 2005; Wu et al.,
2006d). On the other hand, pH has a key role in shaping microbial diversity and activity. During our field test, a bicarbonate buffer was used to raise pH in subsurface and higher pH (5.7–6.5) was obtained
in the inner loop (Wu et al., 2006d, 2007).
Consis-tently, higher microbial diversity and functional
gene abundance were obtained from inner loop wells (Figures 1, 3 and 4). RDA results also showed that pH was an important hydrogeochemical factor
(P¼0.017) for the microbial community functional
gene structures.
Although the geochemical factors for U(VI) bio-remediation have been widely studied, little is known about the influences of hydrological factors. The hydrological condition during the bioremedia-tion process influences fluid transport through the subsurface and the delivery or availability of electron donor, nutrients as well as migration of microorgan-isms. A high hydraulic connection indicated by a high BR in this study is essential to ensure delivering chemicals to the target (contaminated area), and a short MT means that electron donor is consumed less when it reaches the target area. A significant influence of the MT on the microbial functional gene structures was found in this study. The highest microbial diversity, gene number and community overlap between injection and extraction wells were measured for the MLS well FW101-2 that had the shortest MT and highest BR. Similarly, higher microbial diversity and gene number were also observed in outer loop extraction well FW103, where a small fraction of electron donor escaped from the inner loop, than in the injection well FW024 where clean water was injected.
In conclusion, the results of our study showed that a low level of aqueous uranium could be maintained under anaerobic conditions, and that U(VI)-reducing bacteria likely have a key role. U(VI) reduction can be achieved under controlled hydro-geochemical conditions, and the key factors to stimulate the U(VI)-reducing microbial community are related to the delivery of electron donor and hydrological conditions. The available electron acceptors, such as sulfate and nitrate, influence the microbial community structure. This study con-firmed that the establishment of microbial commu-nity function was strongly correlated with geo-chemical conditions (such as sulfate level and pH) and hydraulic flow condition (which influences available electron donor) in the treatment zone. These findings allow us to better understand the linkage between microbial community structure and functions in the groundwater ecosystems, and provide relevant insights on the microbial role in
in situU bioremediation.
Acknowledgements
We thank Tonia Mehlhorn, Sue Carroll and Kenneth Lowe for sampling and analytical help. This work was a part of the Virtual Institute for Microbial Stress and Survival (http://VIMSS.lbl.gov) supported by the US Department of Energy, Office of Science, Office of Biological and Environmental Research, Genomics Program: GTL through contract DE-AC02-05CH11231 between Lawrence Berkeley National Laboratory and the US Department of Energy, the Oklahoma Center for the Advancement of Science and
Technology under Oklahoma Applied Research Support Program, and by the Team Project of the Natural Science Foundation of Guangdong, China (9351007002000001).
References
Akob DM, Mills HJ, Gihring TM, Kerkhof L, Stucki JW, Anastacio AS et al. (2008). Functional diversity and electron donor dependence of microbial populations capable of U(VI) reduction in radionuclide-contami-nated subsurface sediments. Appl Environ Microbiol
74: 3159–3170.
Akob DM, Mills HJ, Kostka JE. (2007). Metabolically active microbial communities in uranium-contami-nated subsurface sediments.FEMS Microbiol Ecol59: 95–107.
Amos BK, Sung Y, Fletcher KE, Gentry TJ, Wu WM, Criddle CSet al. (2007). Detection and quantification of Geobacter lovleyi strain SZ: implications for bio-remediation at tetrachloroethene- and uranium-im-pacted sites.Appl Environ Microbiol73: 6898–6904. Anderson RT, Vrionis HA, Ortiz-Bernad I, Resch CT, Long
PE, Dayvault R et al.(2003). Stimulating the in situ activity ofGeobacterspecies to remove uranium from the groundwater of a uranium-contaminated aquifer. Appl Environ Microbiol69: 5884–5891.
Bender J, Duff MC, Phillips P, Hill M. (2000). Bioremedia-tion and bioreducBioremedia-tion of dissolved U(VI) by microbial mat consortium supported on silica gel particles. Environ Sci Technol34: 3235–3241.
Bostick BC, Fendorf S, Barnett MO, Jardine PM, Brooks SC. (2002). Uranyl surface complexes formed on subsurface media from DOE facilities. Soil Sci Soc Am J66: 99–108.
Brodie EL, DeSantis TZ, Joyner DC, Baek SM, Larsen JT, Andersen GL et al. (2006). Application of a high-density oligonucleotide microarray approach to study bacterial population dynamics during uranium reduc-tion and reoxidareduc-tion. Appl Environ Microbiol 72: 6288–6298.
Cardenas E, Wu WM, Leigh MB, Carley J, Carroll S, Gentry T et al. (2008). Microbial communities in conta-minated sediments, associated with bioremediation of uranium to submicromolar levels. Appl Environ Microbiol74: 3718–3729.
Finneran KT, Housewright ME, Lovley DR. (2002). Multi-ple influences of nitrate on uranium solubility during bioremediation of uranium-contaminated subsurface sediments.Environ Microbiol4: 510–516.
Gentry TJ, Wickham GS, Schadt CW, He Z, Zhou J. (2006). Microarray applications in microbial ecology research. Microb Ecol52: 159–175.
Gu BH, Wu WM, Ginder-Vogel MA, Yan H, Fields MW, Zhou J et al. (2005). Bioreduction of uranium in a contaminated soil column. Environ Sci Technol 39: 4841–4847.
Hazen TC, Tabak HH. (2005). Developments in bioreme-diation of soils and sediments polluted with metals and radionuclides: 2. Field research on bioremedia-tion of metals and radionuclides. Rev Environ Sci Biotechnol4: 157–183.
He ZL, Gentry TJ, Schadt CW, Wu LY, Liebich J, Chong SC et al.(2007). GeoChip: a comprehensive microarray for investigating biogeochemical, ecological and environ-mental processes.ISME J1: 67–77.
Holmes DE, Finneran KT, O’Neil RA, Lovley DR. (2002). Enrichment of members of the family Geobacteraceae associated with stimulation of dissimilatory metal reduction in uranium-contaminated aquifer sediments. Appl Environ Microbiol68: 2300–2306.
Hwang C, Wu WM, Gentry TJ, Carley J, Carroll SL, Watson Det al.(2009). Bacterial community succession during in situ uranium bioremediation: spatial similarities along controlled flow paths.ISME J3: 47–64.
Istok JD, Senko JM, Krumholz LR, Watson D, Bogle MA, Peacock Aet al.(2004). In situbioreduction of tech-netium and uranium in a nitrate-contaminated aquifer. Environ Sci Technol38: 468–475.
Larimer FW, Chain P, Hauser L, Lamerdin J, Malfatti S, Do L et al. (2004). Complete genome sequence of the metabolically versatile photosynthetic bacte-rium Rhodopseudomonas palustris. Nat Biotechnol
22: 55–61.
Liu CX, Zachara JM, Zhong LR, Kukkadupa R, Szecsody JE, Kennedy DW. (2005). Influence of sediment bioreduction and reoxidation on uranium sorption. Environ Sci Technol39: 4125–4133.
Lovley DR. (1991). Dissimilatory Fe(III) and Mn(Iv) reduc-tion.Microbiol Rev55: 259–287.
Lovley DR. (2003). Cleaning up with genomics: applying molecular biology to bioremediation. Nat Rev Micro-biol1: 35–44.
Lovley DR, Phillips EJP. (1992). Reduction of uranium by Desulfovibrio desulfuricans. Appl Environ Microbiol
58: 850–856.
Lovley DR, Phillips EJP, Gorby YA, Landa ER. (1991). Microbial reduction of uranium.Nature350: 413–416. Luo J, Cripka OA, Wu WM, Fienen MN, Jardine PM, Mehlhorn TL et al. (2005). Mass-transfer limitations for nitrate removal in a uranium-contaminated. Environ Sci Technol39: 8453–8459.
Luo J, Wu WM, Carley J, Ruan C, Gu B, Jardine PMet al. (2007). Hydraulic performance analysis of a multiple injection–extraction well system. J Hydrol 336: 294–302.
Luo J, Wu WM, Fienen MN, Jardine PM, Mehlhorn TL, Watson DB et al.(2006). A nested-cell approach for in situremediation.Ground Water44: 266–274. Nevin KP, Finneran KT, Lovley DR. (2003).
Micro-organisms associated with uranium bioremediation in a high-salinity subsurface sediment.Appl Environ Microbiol69: 3672–3675.
North NN, Dollhopf SL, Petrie L, Istok JD, Balkwill DL, Kostka JE. (2004). Change in bacterial community structure during in situ biostimulation of subsurface sediment cocontaminated with uranium and nitrate. Appl Environ Microbiol70: 4911–4920.
Nyman J, Gentile M, Criddle C. (2007). Sulfate require-ment for the growth of U(VI)-reducing bacteria in an ethanol-fed enrichment.Bioremed J11: 21–32. Payne RB, Gentry DM, Rapp-Giles BJ, Casalot L, Wall JD.
(2002). Uranium reduction by Desulfovibrio desul-furicansstrain G20 and a cytochromec3mutant.Appl Environ Microbiol68: 3129–3132.
Ramette A. (2007). Multivariate analyses in microbial ecology.FEMs Microbiol Ecol62: 142–160.
Ramette A, Tiedje JM. (2007). Multiscale response of microbial life in spatial distance and environmental heterogeneity in a patchy ecosystem.Proc Natl Acad Sci USA104: 2761–2766.
Rhee SK, Liu XD, Wu LY, Chong SC, Wan XF, Zhou JZ. (2004). Detection of genes involved in biodegradation
1069 10
and biotransformation in microbial communities by using 50-mer oligonucleotide microarrays. Appl Environ Microbiol70: 4303–4317.
Sanford RA, Wu Q, Sung Y, Thomas SH, Amos BK, Prince EKet al.(2007). Hexavalent uranium supports
growth of Anaeromyxobacter dehalogenans and
Geobacter spp. with lower than predicted biomass yields.Environ Microbiol9: 2885–2893.
Spear JR, Figueroa LA, Honeyman BD. (2000). Modeling reduction of uranium U(VI) under variable sulfate concentrations by sulfate-reducing bacteria. Appl Environ Microbiol66: 3711–3721.
Tabak HH, Lens P, van Hullebusch ED, Dejonghe W. (2005). Developments in bioremediation of soils and sediments polluted with metals and radionuclides—1. Microbial processes and mechanisms affecting bior-emediation of metal contamination and influencing metal toxicity and transport.Rev Environ Sci Biotech-nol4: 115–156.
Van Nostrand JD, Wu WM, Wu L, Deng Y, Carley J, Carroll Set al.(2009). GeoChip-based analysis of func-tional microbial communities during the reoxidation of a bioreduced uranium-contaminated aquifer. Environ Microbiol11: 2611.
Waldron PJ, Van Nostrand JD, Watson DB, He Z, Wu L, Jardine PMet al.(2009). Functional gene array-based analysis of microbial community structure in ground-waters with a gradient of contaminant levels.Environ Sci Technol43: 3529–3534.
Wall JD, Krumholz LR. (2006). Uranium reduction.Annu Rev Microbiol60: 149–166.
Wang F, Zhou H, Meng J, Peng X, Jiang L, Sun P et al. (2009). GeoChip-based analysis of metabolic diversity of microbial communities at the Juan de Fuca Ridge hydrothermal vent. Proc Natl Acad Sci USA 106: 4840–4845.
Wu LY, Liu X, Schadt CW, Zhou JZ. (2006a). Microarray-based analysis of subnanogram quantities of microbial community DNAs by using whole-commu-nity genome amplification. Appl Environ Microbiol
72: 4931–4941.
Wu LY, Thompson DK, Li GS, Hurt RA, Tiedje JM, Zhou JZ. (2001). Development and evaluation of functional gene arrays for detection of selected genes in the environment.Appl Environ Microbiol67: 5780–5790. Wu Q, Sanford RA, Loffler FE. (2006b). Uranium(VI) reduction byAnaeromyxobacter dehalogenans strain 2CP-C.Appl Environ Microbiol72: 3608–3614. Wu WM, Carley J, Fienen M, Mehlhorn T, Lowe K,
Nyman Jet al.(2006c). Pilot-scalein situ bioremedia-tion of uranium in a highly contaminated aquifer. 1. Conditioning of a treatment zone.Environ Sci Technol
40: 3978–3985.
Wu WM, Carley J, Gentry T, Ginder-Vogel MA, Fienen M, Mehlhorn T et al. (2006d). Pilot-scale in situ bio-remediation of uranium in a highly contaminated aquifer. 2. Reduction of U(VI) and geochemical control of U(VI) bioavailability. Environ Sci Technol 40: 3986–3995.
Wu WM, Carley J, Luo J, Ginder-Vogel MA, Cardenas E, Leigh MBet al.(2007).In situbioreduction of uranium (VI) to submicromolar levels and reoxidation by dissolved oxygen.Environ Sci Technol41: 5716–5723. Zhou JZ. (2003). Microarrays for bacterial detection and microbial community analysis.Curr Opin Microbiol6: 288–294.
Zhou JZ, Bruns MA, Tiedje JM. (1996). DNA recovery from soils of diverse composition.Appl Environ Microbiol
62: 316–322.
Zhou JZ, Kang S, Schadt CW, Garten CT. (2008). Spatial scaling of functional gene diversity across various microbial taxa.Proc Natl Acad Sci USA105: 7768–7773.
Supplementary Information accompanies the paper on The ISME Journal website (http://www.nature.com/ismej)