University of Texas at Tyler University of Texas at Tyler
Scholar Works at UT Tyler
Scholar Works at UT Tyler
Civil Engineering Faculty Publications andPresentations Civil Engineering
4-1-2017
A Mechanistic-Empirical Impact Analysis of Different Truck
A Mechanistic-Empirical Impact Analysis of Different Truck
Configurations on a Jointed Plain Concrete Pavement (JPCP)
Configurations on a Jointed Plain Concrete Pavement (JPCP)
Lubinda F. Walubita Tito P. Nyamuhokya Stefan A. Romanoschi Xiaodi Hu Mena I. Souliman msouliman@uttyler.eduFollow this and additional works at: https://scholarworks.uttyler.edu/ce_fac Part of the Civil Engineering Commons
Recommended Citation Recommended Citation
Walubita, Lubinda F.; Nyamuhokya, Tito P.; Romanoschi, Stefan A.; Hu, Xiaodi; and Souliman, Mena I., "A Mechanistic-Empirical Impact Analysis of Different Truck Configurations on a Jointed Plain Concrete Pavement (JPCP)" (2017). Civil Engineering Faculty Publications and Presentations. Paper 3.
http://hdl.handle.net/10950/2341
This Article is brought to you for free and open access by the Civil Engineering at Scholar Works at UT Tyler. It has been accepted for inclusion in Civil Engineering Faculty Publications and Presentations by an authorized
Article no. 41 THE CIVIL ENGINEERING JOURNAL 4-2017
---
DOI 10.14311/CEJ.2017.04.0041 507
A MECHANISTIC-EMPIRICAL IMPACT ANALYSIS OF
DIFFERENT TRUCK CONFIGURATIONS ON A JOINTED PLAIN
CONCRETE PAVEMENT (JPCP)
Lubinda F. Walubita
1, Tito P. Nyamuhokya
2, Stefan A. Romanoschi
3, Xiaodi Hu4 andMena I. Souliman
51. The Texas A&M University System,College Station, TX 77843, USA; lfwalubita@tamu.edu
2. The Texas A&M University System,College Station, TX 77843, USA; t-nyamuhokya@tti.tamu.edu
3. University of Texas at Arlington, Department of Civil Engineering,Arlington, Texas 76019, USA; romanoschi@uta.edu
4. Wuhan Institute of Technology, Transportation Research Center (TRC), Wuhan, China. huxiaodi625@hotmail.com
5. University of Texas at Tyler, Department of Civil Engineering, Tyler, Texas 75799, USA ; msouliman@uttyler.edu
ABSTRACT
Until the last decade, the 1993 American Association of State Highway and Transportation Officials (AASHTO) design guide has been traditionally used for the design of flexible and rigid pavements in the USA and some parts of the world. However, because of its inability to meet the new traffic and material challenges, a Mechanistic Empirical Pavement Design Guide (MEPDG) was introduced based on an NCHRP 1-37 A study conducted in 2004. This study used the MEPDG software and associated models to determine, through comparative truck damage analysis, the effects of nine different truck configurations on a 12 inch-jointed plain concrete pavement (JPCP). The study recorded truck damages at the end of each analysis period (40 years) and comparatively analyzed the relative pavement damage in terms of fatigue cracking, faulting, and surface roughness. The results indicated that the most critical damage to the concrete pavement was caused by truck cases with high and uneven load distribution and relatively smaller size axles group (e.g. tandem). Other key findings included the following; (1) increase in damage when the truckloads were shifted between the same size axles, (2) decrease in truck damage when the truckloads were shifted from tandem axle to quad axles, and (3) no change in truck damage when the axle spacing was increased between wheels of a quad axle.
KEYWORDS
Jointed Plain Concrete Pavement (JPCP), Mechanistic Empirical (ME), Axle loading, Fatigue Cracking, Faulting, Surface roughness, Trucks configurations
INTRODUCTION
Jointed plain concrete pavement is one of the common types of concrete pavements used in the USA. Concrete pavements, which are also known as rigid pavements, typically consist of a Portland cement concrete (PCC) surface layer supported by a sub-base or subgrade. The concrete pavements are categorized based on the type of joints constructed and use of steel reinforcement
Article no. 41 THE CIVIL ENGINEERING JOURNAL 4-2017
---
DOI 10.14311/CEJ.2017.04.0041 508 [1]. Each of these pavement types has specific failure mechanisms, and each failure mechanism is caused by specific factors. Examples of such failure mechanisms include fatigue damage, faulting, and surface roughness of the concrete pavement. These failure mechanisms are usually caused by the following factors: heavy vehicle loading, climate, poor drainage, materials properties, and inadequate layer thicknesses [2]. Out of these factors, the impacts of heavy loaded vehicles constitute some of the major sources for concrete pavement damage [1].
The magnitude and configuration of vehicular loads together with the environment have a significant effect on the induced tensile stresses within the concrete pavement [3]. The impacts of heavy loaded vehicles subject the pavement to high stresses causing damage. However, not all trucks have the same damaging effects; their damage depends on vehicle speed, wheel loads, number and location of axles, load distribution, type of suspension, number of wheels, tire types, tire inflation pressure, etc. [1].
The proper estimation of truck damage is important for truck permit regulators since the fees and penalties applied to truck operators for using the roads are related to the distresses induced to the road network. Regulators must permit trucks and allocate costs to vehicle operators in accordance with the truck damage induced on the pavement. The proper evaluation of truck damage also helps the highway engineers to optimize pavement design and maintenance activities [4].
In the recent years, several studies have estimated the truck damage by computing the responses (stresses, strains, and deflections) of pavements under heavy vehicle loading using mechanistic approaches [5-11]. In this study, the Mechanistic Empirical Pavement Design Guide (MEPDG) was utilized to directly assess the cumulative damage to a concrete pavement. Among its many advantages, MEPDG can be used to analyze the pavement damage over a selected period (or design life) – an aspect that is very conducive for concrete pavement design and analysis [12].
OBJECTIVES
Given the above background, the primary objectives of this study are :(a) to use the MEPDG and its associated models to determine the failure magnitude of a Jointed Plain Concrete Pavement (JPCP) structure due to truck loading of various configurations and, (b) to compare the truck damage of each configuration based on the magnitude of the resulting damages. Specifically, the study aimed at evaluating the truck damage when:
Truck axles (i.e., tandems, quads, etc.) are loaded unequally,
Number of axles in a group of axles are increased or decreased (change of axle type),
Axle spacing varies, and
Individual axles of the same group (i.e., axles in a tandem group) share the load unequally.
METHODS
Concrete Pavements
Concrete pavements insignificantly deflect under loading because of the high stiffness that the PCC possess while constructing it to serve as a surface layer. The pavement structural layers are typically composed of a stiff PCC surface layer on top of a base or sub base layer (when used) as exemplified in Figure 1.
Article no. 41 THE CIVIL ENGINEERING JOURNAL 4-2017
---
DOI 10.14311/CEJ.2017.04.0041 509 Fig. 1 - Typical Concrete Pavement Sections [13].
Depending on the type of construction, concrete pavements are classified asJPCP, jointed reinforced concrete pavement (JRCP), or continuously reinforced concrete pavement (CRCP). These are briefly discussed as follows:
Jointed Plain Concrete Pavement (JPCP): JPCP is the most widely used type of concrete pavement [15]. Its construction costs are lower than those of the other two types of concrete pavements. Instead of using costly steel reinforcements or meshes, the JPCP is designed with short joint spacing to control the development of transverse cracks (Figure 2). The joints relieve stresses in the concrete pavement and control the development of transverse shrinkage cracks. In most cases, the joints are provided with dowel bars spaced at 12 inch intervals. The typical size of slabs for JPCP is 12 to 15 ft wide by 15 to 20 ft long [13].
Fig. 2 - Jointed Plain Concrete Pavement [14].
Jointed Reinforced Concrete Pavement (JRCP): JRCP is comprised of a concrete surface layer with steel reinforcements and transverse joints to control cracks (Figure 3). The steel reinforcement in JRCP is in the form of a welded wire fabric mesh or deformed bars and does not increase the strength of the pavement but allow the use of longer joint spacing [15]. The mesh enhances the usage of longer joints since it holds transverse cracks tightly together [12]. The typical JRCP joint spacing varies from 25 to 50 ft [13]. However, under long-term performance, the longer joint spacing causes relatively early slabs cracking as compared to the other two types of concrete pavements. Because of such long-term performance problems, most states in the USA rarely use JRCP for highway pavements [13].
Article no. 41 THE CIVIL ENGINEERING JOURNAL 4-2017
---
DOI 10.14311/CEJ.2017.04.0041 510 Fig. 3 - Jointed Reinforced Concrete Pavement [14].
Continuously Reinforced Concrete Pavement (CRCP): CRCP are constructed free of contraction/expansion joints (Figure 4). CRCP allows transverse cracks to occur but holds them tightly with steel reinforcements [12]. The transverse cracking behavior in CRCP depends on concrete properties (drying shrinkage, thermal properties, tensile strength, creep, and elastic modulus), reinforcing steel properties (bar diameter and coefficient of thermal expansion), and environmental conditions [16]. Typically, the reinforcement steels make up 0.6-0.7 percent of the concrete cross-sectional area [13]. Because of the joint-free design and reinforcements, the CRCP pavement thickness can be reduced. However, due to extensive use of reinforcements, its construction costs are higher than the other two types of concrete pavements.
Fig. 4 - Continuously Reinforced Concrete Pavement [13].
Distresses in Concrete Pavements
Distresses in pavements refers to damage that hinders pavement performance. The extent and severity of the distresses are mainly due to the variation of the subgrade soil strength, pavement materials characteristics, traffic loading, environmental effects, construction quality, and aging effects (oxidation). For concrete pavements, the common distresses include spalling, faulting, joint seal damage, longitudinal cracks, transverse fatigue cracks, D-cracking, popouts, pumping, settlement, etc. In this study, only damage due to transverse fatigue cracking and faulting were used to compare the relative pavement damage from truck loading.
Article no. 41 THE CIVIL ENGINEERING JOURNAL 4-2017
---
DOI 10.14311/CEJ.2017.04.0041 511
Transverse fatigue cracks
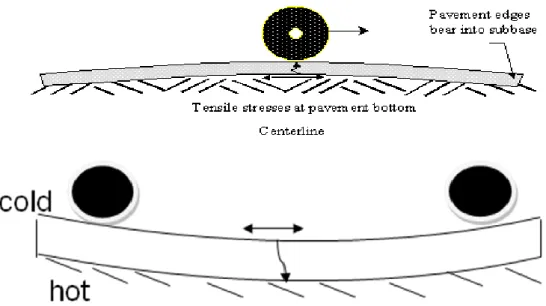
Transverse cracks develop on all concrete types, usually perpendicular to the pavement centerline. The width of the cracks developed may go up to 6mm [17]. The means by which the cracks develop differ from one type of concrete pavement to another. In JPCP, transverse cracks are caused by repeated traffic loading, drying shrinkage of the concrete, temperature variations, curling/warping, reflective cracking caused by existence of transverse cracking in the underlying layers and late, or inadequate transverse joint sawing. The transverse cracks may either start at the bottom or the top of the concrete slab depending upon the temperature and/or moisture gradients. When temperature and moisture gradients are negative (i.e., low temperature and less moisture at top of the concrete surface), the cracks initiates from top of the concrete slab, while bottom-up cracks develop when temperature and moisture gradients are positive (i.e., low temperature and less moisture at the bottom of the concrete slab) (Figure 5).
Fig. 5 - Transverse Cracks (a) Bottom Up Cracks, (b) Top Down Cracks.
Faulting
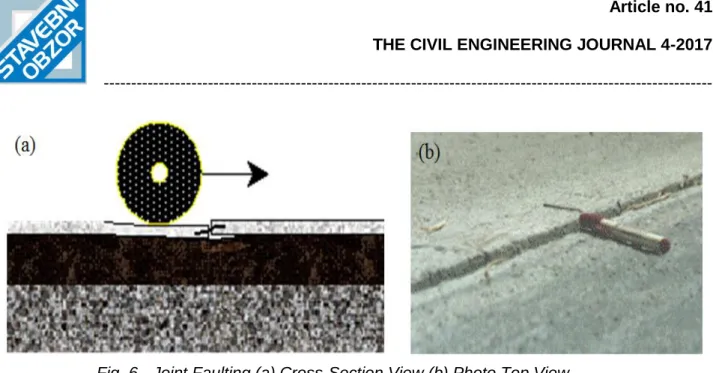
Faulting is recorded when a difference in elevation of concrete slab(s) across joints or cracks is observed (Figure 6). The major cause of faulting is heavy traffic loading and climatic variations. If dowels are used, dowel loosening and enlargement of dowel sockets also play a part in faulting. Pavements with poor drainage are more likely to develop faulting than those with good drainage. Also, erosion under joints due to poor subbase materials contributes to faulting. In fact, the progression of faulting is a function of subbase/base material; the poorer the subbase/base is the higher the faulting.
Article no. 41 THE CIVIL ENGINEERING JOURNAL 4-2017
---
DOI 10.14311/CEJ.2017.04.0041 512 Fig. 6 - Joint Faulting (a) Cross-Section View (b) Photo Top View
Truck Configuration
The USA Department of Transportation and Federal Highway Administration (FHWA) classify vehicles into 13 groups. Classes 1 to 3 are light vehicles with two axles, while Classes 4 and higher are heavy vehicles with more than two axles. According to the FHWA, only vehicles in Classes 4 to 13 cause significant damage to pavements [17].
The FHWA classification of the trucks is based on the number of axles and trailer units. The other characteristics of trucks such as axle group type, suspension system, tire types, distance between axles of a given axle group, distance between centers of dual tires, tire inflation pressure, and loading capacities vary based on the vehicle’s manufacturers [18]. This section will describe some characteristics of the trucks used in this study.
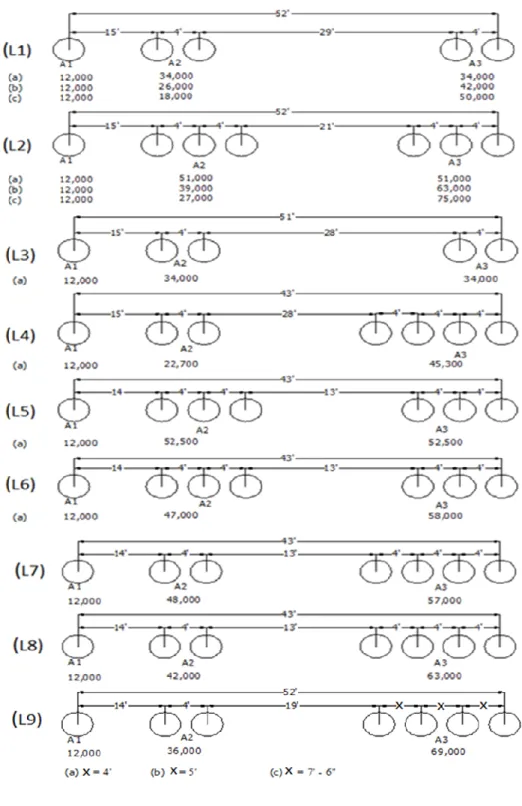
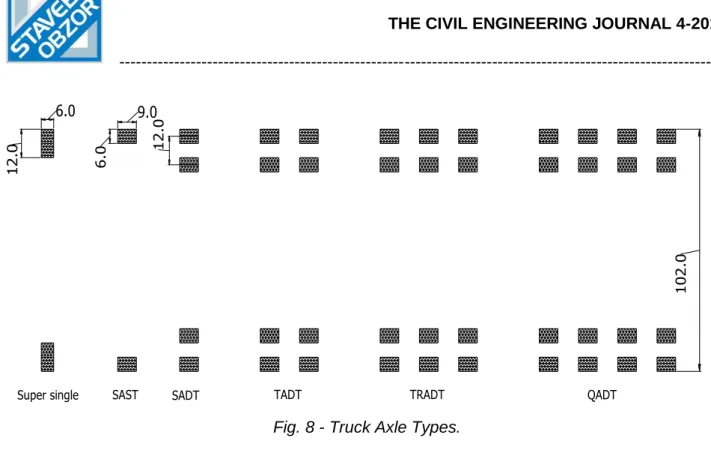
Truck cases: In order to easily identify the truck axle and load configurations used for the MEPDG analysis, this study classified the truck configuration into truck cases, namely L1, L2, L3, L4, L5, L6, L7, L8, and L9 as illustrated in Figure 7. Each of the truck cases is made up of one or more of the following axles: single axle single tire (SAST), single axle dual tire (SADT), tandem axle dual tire (TADT), tridem axle dual tire (TRADT), and quad axle dual tire (QADT); see the illustration inFigure 8 [18].
Article no. 41 THE CIVIL ENGINEERING JOURNAL 4-2017
---
DOI 10.14311/CEJ.2017.04.0041 513 Fig. 7 - Truck Cases Used in the MEPDG Truck Damage Analysis.
Article no. 41 THE CIVIL ENGINEERING JOURNAL 4-2017
--- DOI 10.14311/CEJ.2017.04.0041 514 6.0 9.0 6 .0 1 2 .0 1 0 2 .0
Super single SAST SADT TADT TRADT QADT
Fig. 8 - Truck Axle Types.
Distance between axles in a given axle group: This parameter also depends on the vehicle’s
manufacturer. All axles in truck cases L1 to L9 were spaced at a distance of 4 ft.
Axle width and space between centers of dual tires: Axle width refers to the distance from the center of dual tires of an axle to another center of dual tires of the same axle while the space between centers of dual tires mean the distance between centers of paired tires. Different researchers have been using different axle width and space between dual tires for their studies. While Kim et al. [19], for example, assumed these distances to be 75 inches and 13 inches, respectively. Hiller et al. [20] assumed them to be 74 inches and 13.5 inches, respectively. This study assumed the axle width and space between centers of the dual tires to be 84 inches and 12 inches, respectively [12].
Tire inflation pressure: The tire inflation pressure affects the contact area and stress when the tire is in contact with the pavement surface. According to Darestani et al. [21], the tire pressure of heavy trucks varies between 70 to 140 psi. However, the MEPDG software allows use of a tire inflation pressure of 120 psi only. Therefore, most designs and analyses are based on this value when using the MEPDG software.
Axle spacing: Different trucks may have different axle spacing. This parameter is inconsequential when analyzing bottom up crack damage of concrete pavements, but has significant effects when top down cracks are considered. Typically, the bottom part of pavements under reasonably spaced axles is under compressive stresses and thus, no bottom up cracks develop [22]. The axle spacing of the trucks used in this study is shown for the truck cases L1 to L9 in Figures 7 and 8.
Axle loads: This is the most important parameter required for pavement design and analysis. This study used the provided truck cases L1 to L9 loading in Figure 7.
Article no. 41 THE CIVIL ENGINEERING JOURNAL 4-2017
---
DOI 10.14311/CEJ.2017.04.0041 515
MEPDG Analysis and Design Inputs
The inputs into the MEPDG software define the conditions under which the pavement is expected to perform. The MEPDG inputs also depend on the level of accuracy needed. Better results are expected when more data and a high level of accuracy are used within the analysis. The following is the sequence of MEPDG software inputs as used in this study:
General data,
Traffic,
Climate, and
Pavement structure
General data inputs
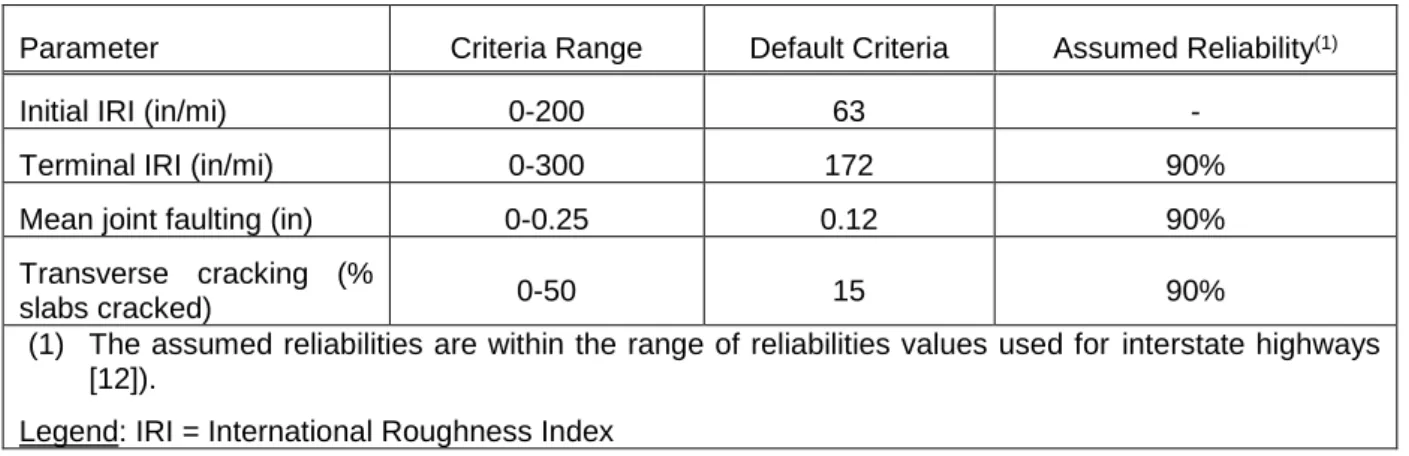
One of the required MEPDG general inputs is the design or expected life of the pavement. For JPCP, a design life of 40 years is typically adapted for high traffic volume pavements (i.e., > 15,000 Average Annual Daily Truck Traffic, AADTT) which was implemented during this study. Other general inputs used in this study are summarized in Table 1.
Tab. 1 - JPCP Performance Criteria.
Parameter Criteria Range Default Criteria Assumed Reliability(1)
Initial IRI (in/mi) 0-200 63 -
Terminal IRI (in/mi) 0-300 172 90%
Mean joint faulting (in) 0-0.25 0.12 90%
Transverse cracking (%
slabs cracked) 0-50 15 90%
(1) The assumed reliabilities are within the range of reliabilities values used for interstate highways [12]).
Legend: IRI = International Roughness Index Traffic inputs
Unlike the 1993 AASHTO Pavement Design Guide, which expresses traffic in terms of equivalent single axle loads (ESALs), the MEPDG requires a detailed estimate of all heavy vehicle axles that will travel on the pavement. Since the objective of this study was to assess and compare damages due to different truck configurations, each truck was analyzed separately, however the traffic volume was kept constant for all the cases studied. Traffic volume and the related parameters were arbitrarily selected from a range of default parameters in the MEPDG software. The MEPDG software allows an initial AADTT ranging from 100 to 25,000. This study used an AADTT of 24,000 on a two-lane pavement in the design direction to simulate high pavement damage. In addition, the study assigned the MEPDG recommended values of 55% and 90% as percentage of trucks in the design direction and design lane, respectively. Furthermore, the study used a minimum speed of 40 mph recommended for freeways. The speed was selected based on the theory that lower truck speed induces more damage to the pavement than relatively higher speeds.
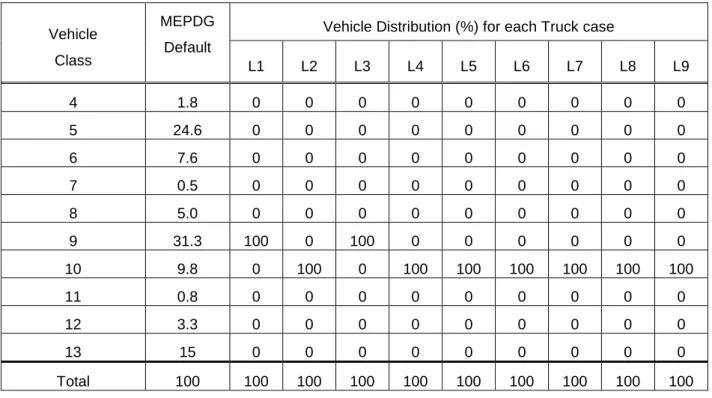
Another set of traffic inputs required for the analysis included traffic monthly adjustment and growth factors, vehicle class distribution, hourly truck distribution and axle load distribution. This study used the MEPDG default values of 1.0 and 4% for traffic monthly adjustment and growth factors, respectively. Table 2, 3, and 4 show the vehicle class distribution, hourly truck distribution, and axle load distribution used in the analysis.
Article no. 41 THE CIVIL ENGINEERING JOURNAL 4-2017
---
DOI 10.14311/CEJ.2017.04.0041 516 Tab. 2 - Vehicle Class Distributions.
Vehicle Class
MEPDG Default
Vehicle Distribution (%) for each Truck case
L1 L2 L3 L4 L5 L6 L7 L8 L9 4 1.8 0 0 0 0 0 0 0 0 0 5 24.6 0 0 0 0 0 0 0 0 0 6 7.6 0 0 0 0 0 0 0 0 0 7 0.5 0 0 0 0 0 0 0 0 0 8 5.0 0 0 0 0 0 0 0 0 0 9 31.3 100 0 100 0 0 0 0 0 0 10 9.8 0 100 0 100 100 100 100 100 100 11 0.8 0 0 0 0 0 0 0 0 0 12 3.3 0 0 0 0 0 0 0 0 0 13 15 0 0 0 0 0 0 0 0 0 Total 100 100 100 100 100 100 100 100 100 100
Tab.3 - Hourly Truck Traffic Distributions.
Time % Hourly Distribution Time % Hourly Distribution
Midnight 2.3 Noon 5.9 1.00 am 2.3 1.00 pm 5.9 2.00 am 2.3 2.00 pm 5.9 3.00 am 2.3 3.00 pm 5.9 4.00 am 2.3 4.00 pm 4.6 5.00 am 2.3 5.00 pm 4.6 6.00 am 5.0 6.00 pm 4.6 7.00 am 5.0 7.00 pm 4.6 8.00 am 5.0 8.00 pm 3.1 9.00 am 5.0 9.00 pm 3.1 10.00 am 5.9 10.00 pm 3.1 11.00 am 5.9 11.00 pm 3.1
Article no. 41 THE CIVIL ENGINEERING JOURNAL 4-2017
---
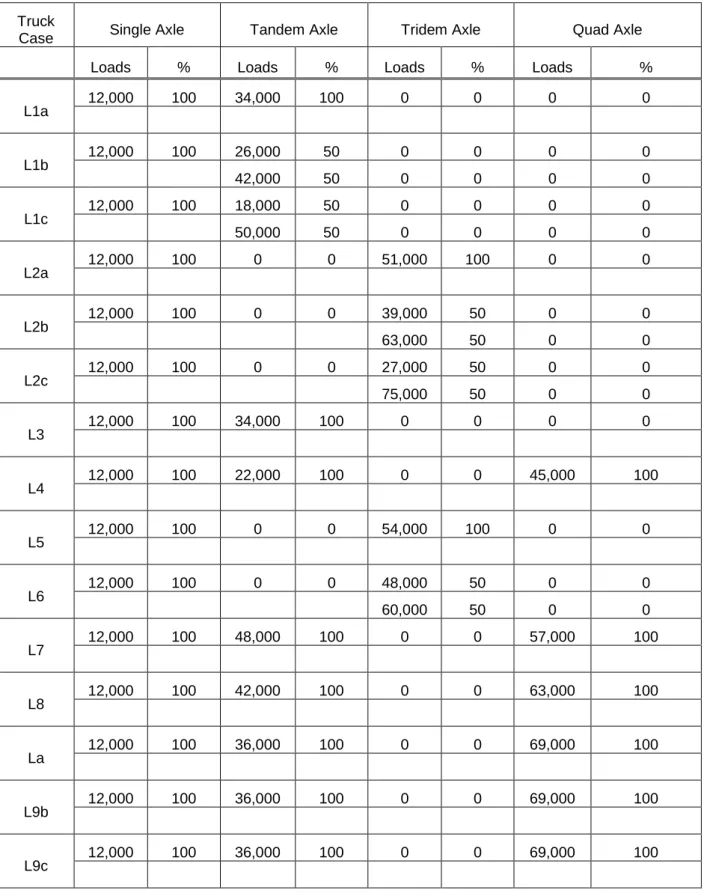
DOI 10.14311/CEJ.2017.04.0041 517 Tab. 4 - Monthly Axle Load Distribution Values for Truck Cases.
Truck
Case Single Axle Tandem Axle Tridem Axle Quad Axle
Loads % Loads % Loads % Loads %
L1a 12,000 100 34,000 100 0 0 0 0 L1b 12,000 100 26,000 50 0 0 0 0 42,000 50 0 0 0 0 L1c 12,000 100 18,000 50 0 0 0 0 50,000 50 0 0 0 0 L2a 12,000 100 0 0 51,000 100 0 0 L2b 12,000 100 0 0 39,000 50 0 0 63,000 50 0 0 L2c 12,000 100 0 0 27,000 50 0 0 75,000 50 0 0 L3 12,000 100 34,000 100 0 0 0 0 L4 12,000 100 22,000 100 0 0 45,000 100 L5 12,000 100 0 0 54,000 100 0 0 L6 12,000 100 0 0 48,000 50 0 0 60,000 50 0 0 L7 12,000 100 48,000 100 0 0 57,000 100 L8 12,000 100 42,000 100 0 0 63,000 100 La 12,000 100 36,000 100 0 0 69,000 100 L9b 12,000 100 36,000 100 0 0 69,000 100 L9c 12,000 100 36,000 100 0 0 69,000 100
Article no. 41 THE CIVIL ENGINEERING JOURNAL 4-2017
---
DOI 10.14311/CEJ.2017.04.0041 518 The development of the traffic inputs was completed by inserting parameters to define the axle load configuration and loading details used for calculating the responses and traffic volume. The traffic inputs used under this category were:
Mean wheel location: This is the distance between the external edge of the nearest truck wheel and the pavement edge marking. The value for mean wheel location may be derived from specific site data, statewide data, or the national average. This study used a default value of 18 inches.
Traffic wander standard deviation: This is the standard deviation of the lateral traffic wander. The input defines the average position of the axle from the point for predicting distresses and performance. The greater the wander value, the higher the fatigue life. The default wander standard deviation of 10 inches was used in this study.
Design lane width: This is the distance between two lane markings of the design lane. This distance may or may not be equal to the slab width. This study used a default value of 12 ft for the standard lane width.
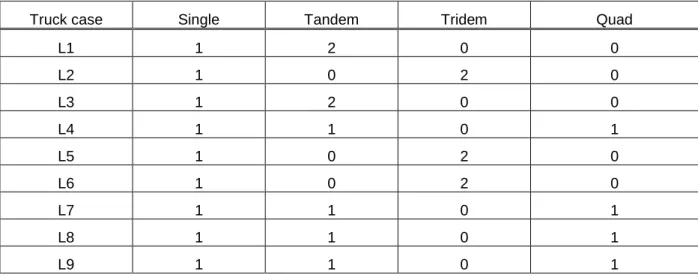
Number of axle types per truck class: This requires an insertion of the average number of axles for each truck class (Class 4 to 13) and each axle type (single, tandem, tridem, and quad). The values for truck cases L1 to L9, as obtained from Figure 7, are shown in Table 5.
Tab. 5 - Number of Axles per Truck Class
Truck case Single Tandem Tridem Quad
L1 1 2 0 0 L2 1 0 2 0 L3 1 2 0 0 L4 1 1 0 1 L5 1 0 2 0 L6 1 0 2 0 L7 1 1 0 1 L8 1 1 0 1 L9 1 1 0 1
Axle configuration: This is a section where decision values regarding axle configurations are inserted in order to aid in the pavement response computations. The inputs used included:
Average axle width: This is the width covering from one outside edge of an axle to the other side. The default value of 8.5ft was used for this study.
Dual tire spacing: This is the center to center distance between dual tires. The default value of 12 inches was used for this study.
Axle spacing: This is the average distance between two consecutive axles of an axle group (tandem, tridem, or quad). The schematic drawings of the truck configuration provided in Figures 7 and 8 specified the values used in this study.
Tire pressure: Tire pressure input is needed for estimation of the tire print area. The MEPDG has a fixed tire pressure of 120 psi. Therefore, the study had no other choice than using this value for the MEPDG analyses.
Article no. 41 THE CIVIL ENGINEERING JOURNAL 4-2017
---
DOI 10.14311/CEJ.2017.04.0041 519
Wheelbase: Wheelbase information is used in the process of determining top down fatigue cracking. The information defines how far the steering axle is located from the drive axle of the same truck, and to what percentage is the wheelbase characterized as either short, medium, or long. The input values are applicable for vehicle Class 8 and above. The values for wheelbase are in two categories, namely:
Average spacing: The MEPDG default axle spacing are 12, 15, and 18 ft for short, medium, and long axles, respectively. In this study, truck case L1 to L4 had an average axle spacing of 15 ft, while truck cases L5 to L9 had average axle spacing of 14 ft.
Percentage of truck axle spacing type: This percentage represents the proportion of trucks with short, medium, and long axle spacing in a vehicle class. The default values provided in the MEPDG are 33, 33, and 34% for short, medium, and long axles, respectively. This study used 100% medium spacing for each truck analyzed since each truck has only one wheelbase.
Climate
Climate is one the major components of the MEPDG design guide. Climatic conditions have significant effect on concrete pavement performance indices such as curling up and down. In the design and analysis of JPCP pavements, the temperature and moisture effects that matter most are:
A combination of permanent built-in curling during construction and permanent warping due to differential shrinkage.
Transient hourly negative and positive non-linear temperature differences caused by the heat of the sun.
Transient hourly negative humidity during each month of the year.
The MEPDG recommends the usage of an available database from nearly 800 weather stations in the USA. Some of these stations have about 100 months of climatic data. However, the MEPDG requires at least 24 months of actual weather station data for computational purposes. The software tracks any weather station data when its latitude (degrees), longitude (degrees), and elevation (ft) are manually inserted or imported from saved weather files. Albany, New York weather station was used in the analysis of this study. The station location is 42.45o latitude and -73.48o
longitude at an elevation of 281 ft above mean sea level.
Another important parameter is the groundwater table depth. This parameter plays a significant role in the overall accuracy of the pavement moisture content, and hence, equilibrium moduli values. The depth is measured from the pavement surface. The MEPDG allows the user to insert either an estimate of the annual average depth or seasonal average depth (i.e., depths for all four seasons of the year). This study estimated and used Albany, New York’s yearly average groundwater table depth of 10 ft [23].
Pavement structure
This aspect mainly defines the pavements layer design features and properties. As discussed subsequently, the JPCP design features required in the MEPDG software are slab thickness, permanent curl/warp effective temperature difference, joint design, edge support, slab-base interface, and base erodibility.
Slab thickness: The thickness of a concrete pavement slab may vary from 6 to 15 inches. However, slab thicknesses of 9 to 12 inches are commonly used in the USA. This study adapted a thickness of 12 inches for all the pavement and traffic damage analyses.
Article no. 41 THE CIVIL ENGINEERING JOURNAL 4-2017
---
DOI 10.14311/CEJ.2017.04.0041 520
Permanent curl/warp effective temperature difference: This represents the locked stresses in the concrete slab due to construction temperatures, shrinkage, creep, and the curing processes. This value is negative because the top surface is expected to be cooler than the bottom surface under the initial conditions. This study adapted a default “curl/warp temperature difference” of -10oF as
recommended in the MEPDG design guide [12].
Joint design: Concrete pavement joints refer to predetermined cracks designed to relieve the stresses in the concrete. As discussed in the subsequent text, the design inputs include type of sealant, joint spacing, and dowel sizing and spacing.
Sealant type – the sealant type is an input to predict spalling. In turn, spalling is used in the smoothness prediction model, but the MEPDG does not consider it as a direct effect on performance. The types of sealant available for MEPDG analysis are liquid, silicon, and preformed sealants. This study used the silicon type of sealant for all the analysis.
Joint spacing – joint spacing has effects on the stresses developed in the JPCP and its construction cost. The spacing increases the stresses but reduces the cost. Typical joint spacing is between 1520ft [13]. In this study, a joint spacing of 15 ft was used.
Dowel diameter and spacing – dowel diameter and spacing are critical inputs for predicting joint faulting. The larger the dowel diameter and the smaller the dowel spacing, the lower the concrete bearing stress and joint faulting. Respectively, the typical dowel diameters and spacing are 1 to 1.75 inches and 12 inches, respectively [12]. This study used a dowel spacing of 12 inches and dowel diameter of 1.5 inches.
Edge support: The edge support inputs required by the MEPDG are tied concrete shoulders or widened slab, and long-term load transfer efficiency (LTE). Tied shoulders can significantly improve JPCP performance by reducing critical deflections and stresses along the edge. In this study, tied concrete shoulders with a long-term LTE of 70%, which lies between the values recommended for monolithically constructed tied shoulders, was used.
Slab-base interface: The structural contribution of a stabilized base under a cement concrete slab is significant if the base is fully bonded to the slab. However, the effects of environmental and traffic loading tend to weaken the bond over time. This study used a non-stabilized crushed stone base; thus, unbonded conditions were assumed throughout the JPCP design life.
Base erodibility: This input has significant effects on the initiation and development of pavement distresses. The MEPDG classifies the base types according to their erodibility behavior as follows:
Class 1 – Extremely erosion resistant materials
Class 2 – Very erosion resistant materials
Class 3 – Erosion resistant materials
Class 4 – Fairly erodible materials
Class 5 – Very erodible materials
This study defined the used base materials as Class 3 – erosion resistant materials. This is the average class of erodibility property of material defined by the MEPDG guide.
Other essential parameters of structure inputs fall in the category of design layers and properties. The MEPDG software allows as many layers as practically possible to reflect and accommodate the actual various pavement structures in the field. The layer properties used in this study are shown in Table 6.
Article no. 41 THE CIVIL ENGINEERING JOURNAL 4-2017
---
DOI 10.14311/CEJ.2017.04.0041 521 Tab. 6 - Pavement Design Layers and Properties.
Layer and Mix Properties Layers Layer – 1 (12 in) Layer – 2 (12 in) Layer – 3 (60 in) Layer – 4 (Semi-infinite) Concrete slab surface Crushed stone base
CH-subgrade Weathered rock bed
Surface absorptive 0.85 N/A N/A N/A
Unit weight (pcf) 150 140 Poisson’s Ratio 0.15 0.35 0.4 0.15 Coefficient of lateral pressure (ko) 0.5 0.5 Coefficient of thermal expansion (per oF x 10-6)
5.5 N/A N/A N/A
Thermal conductivity
(BTU/hr-ft- oF) 1.25 N/A N/A N/A
Heat capacity
(BTU/lb- oF) 0.28 N/A N/A N/A
Cement type Type I N/A N/A N/A
Cementitious material content
(lb/yd3)
600 N/A N/A N/A
Water/cement ratio 0.4 N/A N/A N/A
Aggregate type Limestone N/A N/A N/A
Ultimate shrinkage at 40% R.H (microstrains)
50 N/A N/A N/A
Time to develop 50% ultimate shrinkage
(days)
35 N/A N/A N/A
Curing Method Compound
curing N/A N/A N/A
28 days modulus of
rupture (psi) 700 N/A N/A N/A
28 days elastic
modulus (psi) 4,000,000 N/A N/A N/A
Resilient modulus
(psi) 35,000 5,000 500,000
Article no. 41 THE CIVIL ENGINEERING JOURNAL 4-2017
---
DOI 10.14311/CEJ.2017.04.0041 522
RESULTS AND ANALYSIS
At first, the MEPDG analysis predicted the levels of both top-down and bottom-up fatigue cracking along with joint faulting. Then, the roughness of the pavement surface, expressed in terms of the International Roughness Index (IRI), was computed from the cracking and joint faulting data. Figures 9 to 11 show typical trends of the predicted damages from initial to the 40th year due to
cracking, faulting, and roughness, respectively. There are three plots in each figure representing the estimated damages at 100% and 90% reliability and limit damage criteria. As described in the input section, this study used 90% reliability level. Based on the failure criteria adapted in this study (MEPDG default values), the pavement analytically failed by faulting and roughness. However, in this study, the failure criteria are inconsequential (as opposed to a design problem) since the MEPDG software was intentionally preset to complete the runs and not necessarily to limit the damages.
Fig. 9 - Typical % Slab Cracking Development as a function of Time.
Predicted Cracking
0
10
20
30
40
50
60
70
80
90
100
0
2
4
6
8 10 12 14 16 18 20 22 24 26 28 30 32 34 36 38 40 42 44
Pavement age, years
Perc en t s la bs c ra ck ed , %
Article no. 41 THE CIVIL ENGINEERING JOURNAL 4-2017
---
DOI 10.14311/CEJ.2017.04.0041 523 Fig. 10 - Typical Faulting Development as a function of Time.
Fig. 11 - Typical IRI Development as a function of Time.
Predicted Faulting
0.00
0.05
0.10
0.15
0.20
0.25
0.30
0 2 4 6 8 10 12 14 16 18 20 22 24 26 28 30 32 34 36 38 40 42 44
Pavement age, years
Faul
tin
g,
in
Faulting
Faulting at specified reliability
Faulting Limit
Predicted IRI
0
50
100
150
200
250
300
350
400
450
500
0
2
4
6
8 10 12 14 16 18 20 22 24 26 28 30 32 34 36 38 40 42 44
Pavement age, years
IRI, i
n/mi
le
Article no. 41 THE CIVIL ENGINEERING JOURNAL 4-2017
---
DOI 10.14311/CEJ.2017.04.0041 524 In addition, the study determined relative damages by dividing each truck damage to the damage developed under truck case L1a (the selected base truck). L1 was one of the simplest truck configuration analyzed in this study and was arbitrarily utilized as the base truck. The relative damage simplified the comparison of the truck damages. A summary of the MEPDG damage output and average truck damages are shown in Table 10 and Figure 12, respectively. The results show that truck case L7 was more detrimental to the JCPC pavement than any other truck case presented in this paper. The truck case L7 is composed of steering single, tandem, and quad axle on the trailer. Moreover, on its tandem axle it carries the most loads per wheel than any axle group analyzed, which presumably contributed to its detrimental damaging effects. Figure 12 also shows that the variations in the truck configuration have relatively small effect on the rate of change of faulting and roughness. Similarly, relatively smaller damages were observed for truck cases L4, L5, and L6. A combination of greater number of wheels per truck (larger axle groups) and lesser load distribution per wheel contributed to the relatively smaller damages from these truck cases.
Tab. 10 - Summary of the MEPDG Performance Output.
Truck Case Bottom-Up Cracking Top Down Cracking Transverse Cracking (% Slab) Faulting IRI Dam at Year 40 Relative Damage Dam at Year 40 Relative Damage Dam at Year 40 Relative Damage Dam at Year 40 Relative Damage Dam at Year 40 Relative Damage L1a 0.0023 1 0.11 1 8.1 1.00 0.25 1.00 276 1.00 L1b 0.0073 3.17 0.14 1.23 9.2 1.14 0.25 1.00 275 1.00 L1c 0.0302 13.13 0.21 1.87 13.2 1.63 0.25 1.00 280 1.01 L2a 0.0026 1.13 0.21 1.87 12.1 1.49 0.25 1.00 279 1.01 L2b 0.0083 3.61 0.21 1.87 13 1.60 0.24 0.96 270 0.98 L2c 0.0339 14.74 0.21 1.87 12.5 1.54 0.25 1.00 280 1.01 L3 0.0023 1 0.11 1 8.5 1.05 0.24 0.96 275 1.00 L4 0.0001 0.04 0.02 0.18 5 0.62 0.22 0.88 260 0.94 L5 0.0043 1.87 0.02 0.21 5 0.62 0.26 1.04 278 1.01 L6 0.0062 2.7 0.02 0.21 5 0.62 0.26 1.04 282 1.02 L7 0.0218 9.48 0.21 1.88 25 3.09 0.28 1.12 305 1.11 L8 0.0072 3.13 0.26 2.36 15 1.85 0.28 1.12 299 1.08 L9a 0.0019 0.83 0.16 1.41 10 1.23 0.27 1.08 290 1.05 L9b 0.0019 0.83 0.16 1.41 10 1.23 0.27 1.08 295 1.07 L9c 0.0019 0.83 0.16 1.41 10 1.23 0.27 1.08 295 1.07 Dam = damage
Article no. 41 THE CIVIL ENGINEERING JOURNAL 4-2017
---
DOI 10.14311/CEJ.2017.04.0041 525 Fig. 12 - Transverse Cracking, Faulting, and IRI Damages for All Truck Cases.
Furthermore, the study analyzed the effects on JPCP due to load shifting and changes in the space between the axle groups. These aspects are discussed in the subsequent text.
Effects of load shifting (equal sized axles)
Figures 13 and 14 present the MEPDG damage analysis results for trucks L1 (tandem to tandem axles load shifting) and L2 (tridem to tridem axles load shifting), respectively. The results indicate that shifting of the loads increases damage for all the types of JPCP cracking that were assessed. By contrast, faulting and roughness were negligibly affected by shifting the load. Of all the damages under this category, bottom up cracking had the highest rate of increase of damage. In addition, the study observed slightly higher damages due to truck case L2 (tridem wheels) than truck case L1 (tandem wheels) even though each wheel of the truck cases carried the same weight. For example, truck cases L1a and L2a all have 17,000bs per wheel.
L1 a L1 b L1c L2 a L2 b L2c L3 L4 L5 L6 L7 L8 L9 a L9 b L9c Transverse cracking (% slab) 1,001,141,631,491,601,541,050,620,620,623,091,851,231,231,23 Faulting 1,001,001,001,000,961,000,960,881,041,041,121,121,081,081,08 IRI 1,001,001,011,010,981,011,000,941,011,021,111,081,051,071,07 0,00 0,50 1,00 1,50 2,00 2,50 3,00 3,50 R elat iv e D amag e
Article no. 41 THE CIVIL ENGINEERING JOURNAL 4-2017
---
DOI 10.14311/CEJ.2017.04.0041 526 Fig. 13 - Truck Case L1– Effect of Shifting Loads between Equal Axles.
Fig. 14 - Truck Case L2– Effect of Shifting Loads between Equal Axles.
Effects of load shifting (unequal sized axles)
Figure 15 shows the MEPDG damage analysis results for trucks case L7, L8, and L9a. The truck cases represent the effects of load shifting for unequal sized axles (i.e., from tandem to quad axle). Relative to truck case L7, the shifted loads were 6,000lbs and 12,000lbs for truck casesL8 and L9a, respectively. The figure illustrates a decrease in cracking damage whenever the loads are shifted from tandem to quad axle. Likewise, negligible change in faulting and IRI damages was observed. Bottom Up Cracking Top Down cracking Trans.
Cracking Faulting IRI L1a (load shift = 0lbs) 1 1 1,00 1,00 1,00 L1b (Load shift = 8,000lbs) 3,17 1,23 1,14 1,00 1,00 L1c (Load shift = 16,000lbs) 13,13 1,87 1,63 1,00 1,01 0 2 4 6 8 10 12 14 R elati v e D ama g e Bott. Up Cracking Top Down Cracking Trans.
Cracking Faulting IRI L2a (Loadd shift = 0lbs) 1,13 1,87 1,49 1,00 1,01 L2b(Loadd shift = 12,000lbs) 3,61 1,87 1,60 0,96 0,98 L2c(Loadd shift = 24,000lbs) 14,74 1,87 1,54 1,00 1,01 0 2 4 6 8 10 12 14 16 R elat iv e D amag e
Article no. 41 THE CIVIL ENGINEERING JOURNAL 4-2017
---
DOI 10.14311/CEJ.2017.04.0041 527
Fig. 15 - Effect of Load Shifting from Tandem to Quad.
Effects of increasing spaces between the axles of an axle group
Figure 16 shows relative damage to the JPCP pavement due to increase in the axle spacing of truck case L15. The wheel spacing for the axle group was 48”, 60”, and 90” for truck case L9a, L9b, and L9c, respectively. The MEPDG damage analysis results as shown in Figure 16, depict that JPCP is not sensitive to the spacing of the wheels in any axle group.
Fig. 16 - Effect of Changing Axle Spacing for Truck. Bottom Up Cracking Top Down Cracking Trans.
Cracking Faulting IRI L7 (Load shift = 0lbs) 9,48 1,88 3,09 1,12 1,11 L8 (Load shift = 6,000lbs) 3,13 2,36 1,85 1,12 1,08 L9a (Load shift = 12,000lbs) 0,83 1,41 1,23 1,08 1,05
0 1 2 3 4 5 6 7 8 9 10 R elat iv e D amag e Bottom. Up Cracking Top Down Cracking Trans.
Cracking Faulting IRI L9a (Quad wheel spacing =
48") 0,83 1,41 1,23 1,08 1,05
L9b (Quad wheel spacing =
60") 0,83 1,41 1,23 1,08 1,07
L9c (Quad wheel spacing =
90") 0,83 1,41 1,23 1,08 1,07 0 0,2 0,4 0,6 0,8 1 1,2 1,4 1,6 R elat iv e D amag e
Article no. 41 THE CIVIL ENGINEERING JOURNAL 4-2017
---
DOI 10.14311/CEJ.2017.04.0041 528
CONCLUSION
The aim of this study was to compare trucks in terms of major damages caused to concrete pavements. The study was successful not only at identifying the most damaging truck cases, but also at establishing the trends of truck damage when the axle loads were shifted, or when axle spacing in an axle’s group were changed. Based on these results, the following conclusions can be made:
When loads are shifted between the axles of the same size, on the same truck, the damage increases as the shifted load increases; the minimum damage occurs when the axles are loaded equally. Two sets of truck cases L1 (tandems) and L2 (tridem) were used to demonstrate this behavior.
The rate of increase of truck damage due to load shifting between equal axles of the same size was higher for truck L1 (tandem axles) than L2 (tridem axles).
As expected, at the same axle load, when a tandem axle is replaced by a tridem or quad axle, the damage to the pavement decreases. This was evidenced by a reduction in truck damage when truck case L7, having tandem axles, was replaced by truck cases L8 and L9a, which have tridem and quad axles, respectively.
Based on the MEPDG analysis, increasing spacing in an axle group (i.e., quad axle group) does not change the extent of fatigue cracking, faulting, or roughness of the JPCP.
As theoretically expected, trucks with excessive loads per wheel impacted more damage to the pavement as exemplified by truck case L7.
Overall, the study findings highlight the importance of evenly distributing the truck loading on the axles so as to minimize pavement damage. As was demonstrated in this paper, minimum damage occurred when the truck axles were loaded equally. However, the MEPDG damage analysis in this study was performed on a concrete pavement with a slab thickness of 12 inches that yielded relatively small damage levels. Therefore, future studies should consider thinner slabs where substantial damage from truck loading is theoretically expected.
ACKNOWLEDGEMENTS
This study is part of a research work conducted at the University of Texas-Arlington (UTA) based on truck configurations data provided by the New York State Department of Transportation (NYSDoT). The authors thank NYDoT for their support of this research work and all those who helped during the course of the study and documentation of this paper.
The contents of this paper reflect the views of the authors who are responsible for the facts and accuracy of the data presented herein and do not necessarily reflect the official views or policies of any agency or institute. This paper does not constitute a standard, specification, nor is it intended for design, construction, bidding, contracting, tendering, certification, or permit purposes. Trade names were used solely for information purposes and not for product endorsement, advertisement, or certification.
REFERENCES
[1] Gillespie T.D., Karamihas S.M., Cebon D., Sayers M.W., Nasim M.A., Hansen W., Ehsan N.,1993. Effects of Heavy Vehicle Characteristics on Pavement Response and Performance. National Cooperative Highway Research Program Report 353, Transportation Research Board, (National Research Council, Washington, DC).
Article no. 41 THE CIVIL ENGINEERING JOURNAL 4-2017
---
DOI 10.14311/CEJ.2017.04.0041 529
[2] Hudson W.R., Monismith C.L., Dougan C.E., Visser W., 2003. Use Performance Management System Data for Monitoring Performance: Example with SuperPave. Transportation Research Record 1853, TRB, Washington DC.
[3] Yu H. T., Khazanovich L., Darter M. I., Ardani, A., 1998. Analysis of Concrete Pavement Responses to Temperature and Wheel Loads measured from Instrumented Slabs. In Journal of Transportation Research Board No. 1639, TRB,( National Research Council, Washington, D.C.), 94–101 pp.
[4] Zaghloul S., White T.D.,1994 Guidelines for permitting overloads – Part 1:Effect of overloaded vehicles on the Indiana highway network. FHWA/IN/JHRP-93–5. Purdue University, West Lafayette, Ind.
[5] Chen H., Dere Y., Sotelino E., Archer G., 2002. Mid-Panel Cracking of Portland Cement Concrete Pavements in Indiana, FHWA/IN/JTRP-2001/14, Final Report
[6] Ceylan H., Kim S., Gopalakrishnan K., Schwartz C.W., Li R., 2013. Sensitivity quantification of jointed plain concrete pavement mechanistic-empirical performance predictions. Construction and Building Materials 43, 545-556.
[7] Vandenbossche J.M., Nassiri S., Ramirez L.C., Sherwood J.A.,2012. Evaluating the continuously reinforced concrete pavement performance models of the mechanistic-empirical pavement design guide. Road Materials and Pavement Design 13:2, 235-248.
[8] Vandenbossche J.M., Mu F., Burnham T.R.,2011. Comparison of measured vs. predicted performance of jointed plain concrete pavements using the Mechanistic–Empirical Pavement Design Guideline. International Journal of Pavement Engineering 12:3, 239-251.
[9] Wu C. P., Shen, P.A., 1996. Dynamic analysis of concrete pavements subjected to moving loads. J. Transp. Engrg., 122(5), 367–373.
[10] Huang Y. H., 1974. Finite element analysis of slabs on elastic solids. Transp. Engineering. J., ASCE, 100(2), 403–416.
[11] Chatti K., Monismith C. L., Mahoney J. P., 1995. Investigation of asphalt concrete pavement cracking from heavy vehicles, phase II, Tech. Rep. on Project. F89TL29, Inst. of Transp. Studies, University of California, Berkeley, Berkeley, CA.
[12] NCHRP, March 2004.Guide for Mechanistic-Empirical Design of New and Rehabilitated Pavement Structures. Final Report for Project 1-37A, Part 1, 2 & 3, Chapter 4. National Cooperative Highway Research Program, Transportation Research Board, National Research Council, Washington, D.C.
[13] WSDOT. WSDOT Pavement Guide, Washington State Department of Transportation, URL: http://training.ce.washington.edu/WSDOT/, Accessed May 2009.
[14] Huang Y.H., 2004. Pavement Analysis and Design. Prentice Hall, Inc., New Jersey. [15] American Concrete Pavement Association (ACPA).
http://metiebar.acpa.org/Concrete_Pavement/Technical/Fundamentals/Concrete_Types.asp, accessed January 2017.
[16] American Association of State Highways and Transportation Officials (AASHTO),1993. AASHTO Guide for Design of Pavement Structures, Washington, D.C.
[17] Federal Highway Administration, September,2005. Long-Term Plan for Concrete Pavement Research and Technology- The Concrete Pavement Road Map: Volume I, URL: http://www.fhwa.dot.gov/pavement/pccp/pubs/05052/index.cfm, Publication number: FHWA-HRT-05-0520, [18] Darestani M. Y., Nataatmadja A., Thambiratnam D.P., 2006. A Review of 2004: Austroads Rigid Pavement Design, 22nd ARRB Conference – Research into Practice, Canberra Australia..
[19] Kim S.M., Won M.C., Mccullough B.F., 2002. Dynamic Stress Response of Concrete Pavements to Moving Tandem-Axle Loads, Transp. Res. Record, No. 1809,. 32-41 pp.
[20] Hiller J.E., Roesler J.R., 2002. Transverse Joint Analysis for Use in Mechanistic-Empirical Design of Rigid Pavements, Transportation Research Record 1809, TRB, National Research Council, Washington, DC, 42-51 pp.
[21] Darestani M. Y., Thambiratnam P., Nataatmadja D.A., Baweja D., 2008. Influence of vehicular positions and thermal effects on structuralbehaviour of concrete pavement. Journal of Mechanics of Materials and Structures, 567-589 pp.
[22] https://www.fhwa.dot.gov/reports/tswstudy/Vol3-Chapter5.pdf.Accessed January 2017 [23] https://waterdata.usgs.gov/ny/nwis/current/?type=gw. Accessed January, 2017
![Fig. 2 - Jointed Plain Concrete Pavement [14].](https://thumb-us.123doks.com/thumbv2/123dok_us/1998369.2796739/4.892.201.694.674.889/fig-jointed-plain-concrete-pavement.webp)
![Fig. 3 - Jointed Reinforced Concrete Pavement [14].](https://thumb-us.123doks.com/thumbv2/123dok_us/1998369.2796739/5.892.203.684.203.425/fig-jointed-reinforced-concrete-pavement.webp)