ScienceDirect
Available online at www.sciencedirect.com
Procedia Computer Science 126 (2018) 576–585
1877-0509 © 2018 The Authors. Published by Elsevier Ltd.
This is an open access article under the CC BY-NC-ND license (https://creativecommons.org/licenses/by-nc-nd/4.0/) Selection and peer-review under responsibility of KES International.
10.1016/j.procs.2018.07.292
10.1016/j.procs.2018.07.292
© 2018 The Authors. Published by Elsevier Ltd.
This is an open access article under the CC BY-NC-ND license (https://creativecommons.org/licenses/by-nc-nd/4.0/) Selection and peer-review under responsibility of KES International.
1877-0509
Available online at www.sciencedirect.com
Procedia Computer Science 00 (2018) 000–000
www.elsevier.com/locate/procedia
22nd International Conference on Knowledge-Based and
Intelligent Information & Engineering Systems
Partially Lazy Classification of Cardiovascular Risk via Multi-way
Graph Cut Optimization
Karma M.Fathalla
a,b,, Anik´o Ek´art
b, Doina Gherghel
caComputer Engineering, Arab Academy for Science and Tehnology. Alexandria, Egypt bAston Lab for Intelligent Collective Engineering (ALICE), Aston University. Birmingham, UK
cVascular Research Laboratory, Aston University. Birmingham, UK.
Abstract
Cardiovascular disease (CVD) is considered a leading cause of human mortality with rising trends worldwide. Therefore, early identification of seemingly healthy subjects at risk is a priority. For this purpose, we propose a novel classification algorithm that provides a sound individual risk prediction, based on a non-invasive assessment of retinal vascular function. So-called lazy classifi-cation methods offer reduced time complexity by saving model construction time and better adapting to newly available instances, when compared to well-known eager methods. Lazy methods are widely used due to their simplicity and competitive performance. However, traditional lazy approaches are more vulnerable to noise and outliers, due to their full reliance on the instances’ local neighbourhood for classification. In this work, a learning method based on Graph Cut Optimization calledGCO mineis proposed, which considers both the local arrangements and the global structure of the data, resulting in improved performance relative to traditional lazy methods. We compareGCO minecoupled with genetic algorithms (hGCO mine) with established lazy and eager algorithms to predict cardiovascular risk based on Retinal Vessel Analysis (RVA) data. The highest accuracy of 99.52% is achieved byhGCO mine. The performance ofGCO mineis additionally demonstrated on 12 benchmark medical datasets from theUCI repository. In 8 out of 12 datasets,GCO mineoutperforms its counterparts.GCO mineis recommended for studies where new instances are expected to be acquired over time, as it saves model creation time and allows for better generalization compared to state of the art methods.
©2018 The Authors. Published by Elsevier Ltd.
This is an open access article under the CC BY-NC-ND license (https://creativecommons.org/licenses/by-nc-nd/4.0/)
Selection and peer-review under responsibility of KES International.
Keywords: Cardiovascular disease, Retinal Vessel Analysis, lazy classification, graph cut optimization, genetic algorithm.
1. Introduction
Cardiovascular disease (CVD) is usually manifested as a sudden life-threatening event [34], therefore early detec-tion of asymptomatic subjects at risk is vital [17,40]. Several risk scores have been established for identification of CardioVascular Risk (CVR), including Framingham Risk Score (FRisk) [12] and QRisk [23], which are appropriate
E-mail address:[email protected]*
1877-0509©2018 The Authors. Published by Elsevier Ltd.
This is an open access article under the CC BY-NC-ND license (https://creativecommons.org/licenses/by-nc-nd/4.0/) Selection and peer-review under responsibility of KES International.
Karma M.Fathalla et al/Procedia Computer Science 00 (2018) 000–000
for population based risk stratification [3,9,11,24]. Identifying novel early risk markers is a developing area expected to lead to more reliable individual risk estimation and consequently better disease control and higher survival rate.
Retinal Vessel Analysis (RVA) [37] is a noninvasive method for identifying vessels’ reactivity to stress. The associ-ation of variability in retinal vessel diameters’ changes with CVD has been recently studied and established [26,30]. We pioneered the use of RVA coupled with machine learning methods for early CVR prediction [18]. We applied es-tablished standard classification methods on a subset of features, including a combination of measures generated from RVA data and others known to contribute to the calculation of FRisk and QRisk scores. The highest achieved accuracy was 96.22% using Random Forest. Given the specifics of the problem, i.e., imbalanced data, with very limited number of patients in high risk category, expectation to recruit new patients, overlapping measurements ranges and high cost of misclassification, further improvement of accuracy is essential.
The main objective of this study is to propose a classification method that can correctly identify high cardiovascular risk subjects based solely on RVA data, while minimizing classification error overall. The novel classification algo-rithmGCO mineproduces reliable risk prediction and can handle the specifics of the data. RVA data have two main characteristics, namely (1) the boundaries between risk groups are not crisply defined and (2) the various interactions between the features are not clear. For our study, the data are continuously being collected, therefore a method that can adapt to newly arriving data is needed. Thus, instead of a global abstraction classification model using eager methods, an instance-based approach is proposed here. OurGCO minemethod is particularly suitable, because it respects the individual variation within one risk group and manages the overlapping pre-morbid and normal ranges of features.
Existing lazy learning solutions are outlined in the next section, together with examples of the use of graph cut op-timization (GCO) for classification. In section3, the proposed classification algorithm is described in detail, followed by the experimental evaluation in section4. Conclusions are drawn in section5.
2. Related Work
Here we focus on lazy learning methods specifically, as they can handle expanding datasets and overlapping ranges, which are essential for our dataset. The application of graph cut optimization for clustering and classification is discussed to illustrate its potential for tackling the limitation of pure locality in the existing lazy methods.
2.1. Lazy Learning
In lazy classification, local neighbourhood arrangements are constructed using similar training instances at testing time. This is done to induce a classification decision for unseen instances. A major drawback with lazy approaches is the construction of entirely local patterns, which disregard the overall structure of the data, leading to worse noise tolerance compared to eager methods.
The k-Nearest Neighbours algorithm (kNN) is an example of a well established lazy classifier. The k nearest neighbours of a test instance are first determined [2]. The nearest neighbours are located within the training set using Euclidean distance. Majority vote from thek-neighbours is used as the classification decision of the test instance. Extensions of kNN include introducing decision rules other than majority vote, using more efficient search strategies
for neighbour search, determining the best value ofkand investigating the distance function effect on performance.
Shang et al. combine fuzzy set theory with classical kNN [39]. The effect of the neighbouring samples is weighted
by their distance to the test instance. A fuzzy membership to every class is computed based on neighbours’ mem-bership weighted by their distance. The test sample receives the class label of the highest memmem-bership. Kaveh-Yazdy et al. propose another attempt for decision rule improvement [29]. The distance of the neighbours is weighted by the size and dispersion of their class, where neighbours belonging to larger and more dispersed classes are allocated larger weight. This is applied to determine the impact of the neighbours more accurately. They also address the issue of search space reduction using linear discriminant analysis. Wang and Li introduce an approach for efficient space
search using particle swarm intelligence to determinek-nearest neighbours and eliminate outliers quickly [41]. For determining the best value ofk, the most common strategy is cross validation (brute force) [42]. However, while Wang et al. determineklocally using statistical confidence [42], Hassanat et al. employ ensemble classification to reduce the influence of a singlekselection: weak kNN classifiers of differentkvalues are applied first and then a
Karma M. Fathalla et al. / Procedia Computer Science 126 (2018) 576–585 577
Procedia Computer Science 00 (2018) 000–000
www.elsevier.com/locate/procedia
22nd International Conference on Knowledge-Based and
Intelligent Information & Engineering Systems
Partially Lazy Classification of Cardiovascular Risk via Multi-way
Graph Cut Optimization
Karma M.Fathalla
a,b,, Anik´o Ek´art
b, Doina Gherghel
caComputer Engineering, Arab Academy for Science and Tehnology. Alexandria, Egypt bAston Lab for Intelligent Collective Engineering (ALICE), Aston University. Birmingham, UK
cVascular Research Laboratory, Aston University. Birmingham, UK.
Abstract
Cardiovascular disease (CVD) is considered a leading cause of human mortality with rising trends worldwide. Therefore, early identification of seemingly healthy subjects at risk is a priority. For this purpose, we propose a novel classification algorithm that provides a sound individual risk prediction, based on a non-invasive assessment of retinal vascular function. So-called lazy classifi-cation methods offer reduced time complexity by saving model construction time and better adapting to newly available instances, when compared to well-known eager methods. Lazy methods are widely used due to their simplicity and competitive performance. However, traditional lazy approaches are more vulnerable to noise and outliers, due to their full reliance on the instances’ local neighbourhood for classification. In this work, a learning method based on Graph Cut Optimization calledGCO mineis proposed, which considers both the local arrangements and the global structure of the data, resulting in improved performance relative to traditional lazy methods. We compareGCO minecoupled with genetic algorithms (hGCO mine) with established lazy and eager algorithms to predict cardiovascular risk based on Retinal Vessel Analysis (RVA) data. The highest accuracy of 99.52% is achieved byhGCO mine. The performance ofGCO mineis additionally demonstrated on 12 benchmark medical datasets from theUCI repository. In 8 out of 12 datasets,GCO mineoutperforms its counterparts.GCO mineis recommended for studies where new instances are expected to be acquired over time, as it saves model creation time and allows for better generalization compared to state of the art methods.
©2018 The Authors. Published by Elsevier Ltd.
This is an open access article under the CC BY-NC-ND license (https://creativecommons.org/licenses/by-nc-nd/4.0/)
Selection and peer-review under responsibility of KES International.
Keywords: Cardiovascular disease, Retinal Vessel Analysis, lazy classification, graph cut optimization, genetic algorithm.
1. Introduction
Cardiovascular disease (CVD) is usually manifested as a sudden life-threatening event [34], therefore early detec-tion of asymptomatic subjects at risk is vital [17,40]. Several risk scores have been established for identification of CardioVascular Risk (CVR), including Framingham Risk Score (FRisk) [12] and QRisk [23], which are appropriate
E-mail address:[email protected]*
1877-0509©2018 The Authors. Published by Elsevier Ltd.
This is an open access article under the CC BY-NC-ND license (https://creativecommons.org/licenses/by-nc-nd/4.0/) Selection and peer-review under responsibility of KES International.
Available online at www.sciencedirect.com
Procedia Computer Science 00 (2018) 000–000
www.elsevier.com/locate/procedia
22nd International Conference on Knowledge-Based and
Intelligent Information & Engineering Systems
Partially Lazy Classification of Cardiovascular Risk via Multi-way
Graph Cut Optimization
Karma M.Fathalla
a,b,, Anik´o Ek´art
b, Doina Gherghel
caComputer Engineering, Arab Academy for Science and Tehnology. Alexandria, Egypt bAston Lab for Intelligent Collective Engineering (ALICE), Aston University. Birmingham, UK
cVascular Research Laboratory, Aston University. Birmingham, UK.
Abstract
Cardiovascular disease (CVD) is considered a leading cause of human mortality with rising trends worldwide. Therefore, early identification of seemingly healthy subjects at risk is a priority. For this purpose, we propose a novel classification algorithm that provides a sound individual risk prediction, based on a non-invasive assessment of retinal vascular function. So-called lazy classifi-cation methods offer reduced time complexity by saving model construction time and better adapting to newly available instances, when compared to well-known eager methods. Lazy methods are widely used due to their simplicity and competitive performance. However, traditional lazy approaches are more vulnerable to noise and outliers, due to their full reliance on the instances’ local neighbourhood for classification. In this work, a learning method based on Graph Cut Optimization calledGCO mineis proposed, which considers both the local arrangements and the global structure of the data, resulting in improved performance relative to traditional lazy methods. We compareGCO minecoupled with genetic algorithms (hGCO mine) with established lazy and eager algorithms to predict cardiovascular risk based on Retinal Vessel Analysis (RVA) data. The highest accuracy of 99.52% is achieved byhGCO mine. The performance ofGCO mineis additionally demonstrated on 12 benchmark medical datasets from theUCI repository. In 8 out of 12 datasets,GCO mineoutperforms its counterparts.GCO mineis recommended for studies where new instances are expected to be acquired over time, as it saves model creation time and allows for better generalization compared to state of the art methods.
©2018 The Authors. Published by Elsevier Ltd.
This is an open access article under the CC BY-NC-ND license (https://creativecommons.org/licenses/by-nc-nd/4.0/)
Selection and peer-review under responsibility of KES International.
Keywords: Cardiovascular disease, Retinal Vessel Analysis, lazy classification, graph cut optimization, genetic algorithm.
1. Introduction
Cardiovascular disease (CVD) is usually manifested as a sudden life-threatening event [34], therefore early detec-tion of asymptomatic subjects at risk is vital [17,40]. Several risk scores have been established for identification of CardioVascular Risk (CVR), including Framingham Risk Score (FRisk) [12] and QRisk [23], which are appropriate
E-mail address:[email protected]*
1877-0509©2018 The Authors. Published by Elsevier Ltd.
This is an open access article under the CC BY-NC-ND license (https://creativecommons.org/licenses/by-nc-nd/4.0/) Selection and peer-review under responsibility of KES International.
Karma M.Fathalla et al/Procedia Computer Science 00 (2018) 000–000
for population based risk stratification [3,9,11,24]. Identifying novel early risk markers is a developing area expected to lead to more reliable individual risk estimation and consequently better disease control and higher survival rate.
Retinal Vessel Analysis (RVA) [37] is a noninvasive method for identifying vessels’ reactivity to stress. The associ-ation of variability in retinal vessel diameters’ changes with CVD has been recently studied and established [26,30]. We pioneered the use of RVA coupled with machine learning methods for early CVR prediction [18]. We applied es-tablished standard classification methods on a subset of features, including a combination of measures generated from RVA data and others known to contribute to the calculation of FRisk and QRisk scores. The highest achieved accuracy was 96.22% using Random Forest. Given the specifics of the problem, i.e., imbalanced data, with very limited number of patients in high risk category, expectation to recruit new patients, overlapping measurements ranges and high cost of misclassification, further improvement of accuracy is essential.
The main objective of this study is to propose a classification method that can correctly identify high cardiovascular risk subjects based solely on RVA data, while minimizing classification error overall. The novel classification algo-rithmGCO mineproduces reliable risk prediction and can handle the specifics of the data. RVA data have two main characteristics, namely (1) the boundaries between risk groups are not crisply defined and (2) the various interactions between the features are not clear. For our study, the data are continuously being collected, therefore a method that can adapt to newly arriving data is needed. Thus, instead of a global abstraction classification model using eager methods, an instance-based approach is proposed here. OurGCO minemethod is particularly suitable, because it respects the individual variation within one risk group and manages the overlapping pre-morbid and normal ranges of features.
Existing lazy learning solutions are outlined in the next section, together with examples of the use of graph cut op-timization (GCO) for classification. In section3, the proposed classification algorithm is described in detail, followed by the experimental evaluation in section4. Conclusions are drawn in section5.
2. Related Work
Here we focus on lazy learning methods specifically, as they can handle expanding datasets and overlapping ranges, which are essential for our dataset. The application of graph cut optimization for clustering and classification is discussed to illustrate its potential for tackling the limitation of pure locality in the existing lazy methods.
2.1. Lazy Learning
In lazy classification, local neighbourhood arrangements are constructed using similar training instances at testing time. This is done to induce a classification decision for unseen instances. A major drawback with lazy approaches is the construction of entirely local patterns, which disregard the overall structure of the data, leading to worse noise tolerance compared to eager methods.
The k-Nearest Neighbours algorithm (kNN) is an example of a well established lazy classifier. The k nearest neighbours of a test instance are first determined [2]. The nearest neighbours are located within the training set using Euclidean distance. Majority vote from thek-neighbours is used as the classification decision of the test instance. Extensions of kNN include introducing decision rules other than majority vote, using more efficient search strategies
for neighbour search, determining the best value ofkand investigating the distance function effect on performance.
Shang et al. combine fuzzy set theory with classical kNN [39]. The effect of the neighbouring samples is weighted
by their distance to the test instance. A fuzzy membership to every class is computed based on neighbours’ mem-bership weighted by their distance. The test sample receives the class label of the highest memmem-bership. Kaveh-Yazdy et al. propose another attempt for decision rule improvement [29]. The distance of the neighbours is weighted by the size and dispersion of their class, where neighbours belonging to larger and more dispersed classes are allocated larger weight. This is applied to determine the impact of the neighbours more accurately. They also address the issue of search space reduction using linear discriminant analysis. Wang and Li introduce an approach for efficient space
search using particle swarm intelligence to determinek-nearest neighbours and eliminate outliers quickly [41]. For determining the best value ofk, the most common strategy is cross validation (brute force) [42]. However, while Wang et al. determineklocally using statistical confidence [42], Hassanat et al. employ ensemble classification to reduce the influence of a singlekselection: weak kNN classifiers of differentkvalues are applied first and then a
578 Karma M. Fathalla et al. / Procedia Computer Science 126 (2018) 576–585
Karma M.Fathalla et al/Procedia Computer Science 00 (2018) 000–000
The effect of the distance function is studied by Hu et al., showing that the performance is dependent on the feature
data types of the dataset [25]. Moreover, Bao et al [5] combine several distance functions, such as heterogeneous Euclidean-Overlap metric and discretized value difference metric to determine differentk-nearest neighbours groups
first, then apply majority vote. The K∗ algorithm [10] uses the entropic transformation function to determine the samples similarity.K∗has been shown to handle categorical data better than kNN due to its similarity function.
Another line of study is merging the nearest neighbours decision with the Naive Bayes (NB) classifier, where a NB model is either constructed locally based on test samples k-nearest neighbours [19] or multiple NB models are locally constructed with differentkand then the most accurate model is selected to classify a test instance [43].
Despite the dedicated efforts to enhance the existing lazy learning methods, purely local approaches, which are
vulnerable to noise and outliers, remain the most prevalent and the global resultant structure is overlooked. 2.2. Graph Cut Optimization in Classification Problems
Graph cut optimization (GCO) has been used as a solution to clustering problems [28,16,15]. Dhillon et al. [15] employed kernelk-means to optimize weighted graph cuts and overcome the equal-sized cluster restriction of Karypis and Kumar [28]. Despite the success in clustering problems, its use for classification problems in the data mining domain remains limited. Extensive application ofGCOcan be found in image segmentation and object classifica-tion:GCOhas been widely used with hyperspectral images [4,13], retinal images, whereGCOproduces bi-labels (artery/vein) from segmented images [14,27,36] and flower segmentation from colour images [44]. Even though GCOhas been included within a broad set of learning models, not all the presented models useGCOas a stand alone classifier. The described approaches either utilize pre-classifiers (e.g. SVM and K-means) [4,13] or applyGCOon presegmented images [14,27,36] or apply significant image-specific preprocessing beforeGCO[44].
We consider that further development of GCO-based generic classification methods is a promising avenue as (1)GCOis expected to lead to high accuracy classification for a range of problems and (2) it is a low cost method with guaranteed optimality bounds. Also, utilizing its formulation to modify the typical instance-based learning approach would achieve better generalization of the learning decision.
We propose a partially lazy mining (classification) algorithm based on Graph Cut OptimizationGCO minethat aggregates local connectivities into a globally connected graph, on which a global classification decision is taken. In addition,GCO mineintroduces the concept of a sample’s direct membership (distance) to the given classes, which does not exist in traditional lazy approaches such as kNN. TheGCO mineapproach strikes a favourable balance between merely local instance-based lazy methods and eager techniques, which build global latent models of the training data in a separate phase.
3. Proposed Partially Lazy Classification Method
In this section, we introduceGCO mine, a partially lazy classification method that employs multi-label graph cut optimization (GCO).GCO mineformulates the classification model as a graph cut minimization problem.GCO mine reaches a solution by incorporating a smoothness prior, which employs similarity information from both training and test instances. The graph formulation introduces connectivity among the local neighbourhoods, thus allowing for the study of the global structure of the classes. We considerGCO minea partially lazy classifier as it includes caching intermediate results for parameter settings [1].
3.1. Graph Cut Formulation of GCO mine
Using graph cut optimization [8,31], we formulate our classification problem as an undirected graph. In an undi-rected graph, there exists a set of vertices vand edges ethat connect these vertices. Each edge ei is assigned a
non-negative costcidenoting the penalty of cutting the edgeeibetween two vertices. There is a special type of
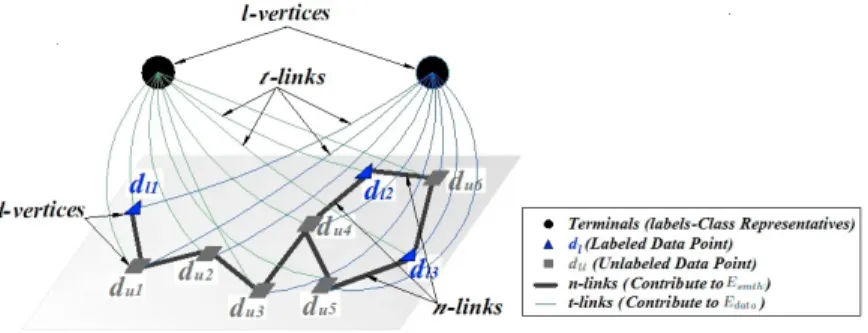
ver-tices called the terminals. Each terminal of the graph represents a label creatingl-vertices forlclass problems. The other vertices correspond to the data points (records). Given a dataset, its data points are represented byd-vertices. In our formulation, there existdl-vertices which belong to the set labeled data pointsDlanddu-vertices for unlabeled
data pointsDu. Eachd-vertex is connected to all the terminals (l-vertices) throught-links of different costs. Also, the
Karma M.Fathalla et al/Procedia Computer Science 00 (2018) 000–000
Fig. 1:Graph Formulation of Classification Problem
neighbouring data points have weighted links calledn-links. The described graph cut formulation structure is out-lined in Fig.1. The energy of a cut per iteration depends on the costs of the severedt-links andn-links in a single α-expansion move (see [8] for details). Only the expansion move is utilised for optimization due to its guaranteed, proven optimality properties [8]. The objective is to find the cut with minimum energyETotal, that partitions the data
pointsd-vertices such that eachd-vertex is associated with a single l-vertex corresponding to its label. When the designated cut is reached, a suboptimal labelingClasslabelsis realized.
3.2. Proposed Energy Function Definition for GCO mine
The energy of a cutETotalis defined as the sum of the costs of the edges it severs as it is formulated.ETotalis based
on the data energyEdataand smoothness energyEsmth:
ETotal=Edata+βEsmth (1)
where Edata measures the conformity of the data points with each label, βdetermines the contribution weight of Esmth, andEsmthquantifies the interaction penalty of the neighbouring data points with each other. For each candidate
cut, Edata andEsmth are computed corresponding to the costs of the t-links andn-links, respectively. Both energy
components are calculated using the standardized Euclidean distanceξbetween data points (equations3and7). A standardized distance metric is chosen to balance the contribution of each feature to the cost, as all features are converted to the same scale.
The data energyEdata(equation2) comprises two cost functions:CuandCl, whereCucomputes the cost of
assign-ing an unlabeled data pointdito a classli, wheredi ∈ Du(equation3) andClsets the cost of classifying a labeled
training data pointdito classli, wheredi ∈ T andT ⊂Dl(equation4). In order to reduce computational cost and
avoid the use of noise or outliers in the classification and energy calculations, only a subsetT of the labeled samples Dlis used for training.Edata,CuandClare defined as:
Edata= di∈Du Cu(li|di)+ di∈T Cl(li|di) (2) Cu(li|di)=ξ(di, η) (3) Cl(li|di)= 0∞,, ifotherwise.li=C (4) Cu is measured as the distance between di and the representativeη of class li.η is selected from the training
subsetT. For a labeled data pointdi, the costClis set to zero whenliis the ’ground truth’ target classCand to∞
(practically the largest integer) in all other cases, to direct the chosen cut and guide the classification process. This extremely large distance acts as a high penalty imposed for misclassification.
Esmth is calculated as the sum of the normalized costs of assigning two neighboursdi anddjto different classes
(cutting their n-link),ω(di,dj) (equation 5). This cost is calculated as the difference between the local maximum
Karma M.Fathalla et al/Procedia Computer Science 00 (2018) 000–000
The effect of the distance function is studied by Hu et al., showing that the performance is dependent on the feature
data types of the dataset [25]. Moreover, Bao et al [5] combine several distance functions, such as heterogeneous Euclidean-Overlap metric and discretized value difference metric to determine differentk-nearest neighbours groups
first, then apply majority vote. The K∗ algorithm [10] uses the entropic transformation function to determine the samples similarity.K∗has been shown to handle categorical data better than kNN due to its similarity function.
Another line of study is merging the nearest neighbours decision with the Naive Bayes (NB) classifier, where a NB model is either constructed locally based on test samples k-nearest neighbours [19] or multiple NB models are locally constructed with differentkand then the most accurate model is selected to classify a test instance [43].
Despite the dedicated efforts to enhance the existing lazy learning methods, purely local approaches, which are
vulnerable to noise and outliers, remain the most prevalent and the global resultant structure is overlooked. 2.2. Graph Cut Optimization in Classification Problems
Graph cut optimization (GCO) has been used as a solution to clustering problems [28,16,15]. Dhillon et al. [15] employed kernelk-means to optimize weighted graph cuts and overcome the equal-sized cluster restriction of Karypis and Kumar [28]. Despite the success in clustering problems, its use for classification problems in the data mining domain remains limited. Extensive application ofGCOcan be found in image segmentation and object classifica-tion:GCOhas been widely used with hyperspectral images [4,13], retinal images, whereGCOproduces bi-labels (artery/vein) from segmented images [14,27,36] and flower segmentation from colour images [44]. Even though GCOhas been included within a broad set of learning models, not all the presented models useGCOas a stand alone classifier. The described approaches either utilize pre-classifiers (e.g. SVM and K-means) [4,13] or applyGCOon presegmented images [14,27,36] or apply significant image-specific preprocessing beforeGCO[44].
We consider that further development of GCO-based generic classification methods is a promising avenue as (1)GCOis expected to lead to high accuracy classification for a range of problems and (2) it is a low cost method with guaranteed optimality bounds. Also, utilizing its formulation to modify the typical instance-based learning approach would achieve better generalization of the learning decision.
We propose a partially lazy mining (classification) algorithm based on Graph Cut OptimizationGCO minethat aggregates local connectivities into a globally connected graph, on which a global classification decision is taken. In addition,GCO mineintroduces the concept of a sample’s direct membership (distance) to the given classes, which does not exist in traditional lazy approaches such as kNN. TheGCO mineapproach strikes a favourable balance between merely local instance-based lazy methods and eager techniques, which build global latent models of the training data in a separate phase.
3. Proposed Partially Lazy Classification Method
In this section, we introduceGCO mine, a partially lazy classification method that employs multi-label graph cut optimization (GCO).GCO mineformulates the classification model as a graph cut minimization problem.GCO mine reaches a solution by incorporating a smoothness prior, which employs similarity information from both training and test instances. The graph formulation introduces connectivity among the local neighbourhoods, thus allowing for the study of the global structure of the classes. We considerGCO minea partially lazy classifier as it includes caching intermediate results for parameter settings [1].
3.1. Graph Cut Formulation of GCO mine
Using graph cut optimization [8,31], we formulate our classification problem as an undirected graph. In an undi-rected graph, there exists a set of vertices v and edgese that connect these vertices. Each edge ei is assigned a
non-negative costcidenoting the penalty of cutting the edgeeibetween two vertices. There is a special type of
ver-tices called the terminals. Each terminal of the graph represents a label creatingl-vertices forlclass problems. The other vertices correspond to the data points (records). Given a dataset, its data points are represented byd-vertices. In our formulation, there existdl-vertices which belong to the set labeled data pointsDlanddu-vertices for unlabeled
data pointsDu. Eachd-vertex is connected to all the terminals (l-vertices) throught-links of different costs. Also, the
Karma M.Fathalla et al/Procedia Computer Science 00 (2018) 000–000
Fig. 1:Graph Formulation of Classification Problem
neighbouring data points have weighted links calledn-links. The described graph cut formulation structure is out-lined in Fig.1. The energy of a cut per iteration depends on the costs of the severedt-links andn-links in a single α-expansion move (see [8] for details). Only the expansion move is utilised for optimization due to its guaranteed, proven optimality properties [8]. The objective is to find the cut with minimum energyETotal, that partitions the data
pointsd-vertices such that eachd-vertex is associated with a singlel-vertex corresponding to its label. When the designated cut is reached, a suboptimal labelingClasslabelsis realized.
3.2. Proposed Energy Function Definition for GCO mine
The energy of a cutETotalis defined as the sum of the costs of the edges it severs as it is formulated.ETotalis based
on the data energyEdataand smoothness energyEsmth:
ETotal=Edata+βEsmth (1)
whereEdata measures the conformity of the data points with each label, β determines the contribution weight of Esmth, andEsmthquantifies the interaction penalty of the neighbouring data points with each other. For each candidate
cut, Edata and Esmth are computed corresponding to the costs of the t-links and n-links, respectively. Both energy
components are calculated using the standardized Euclidean distanceξbetween data points (equations3and7). A standardized distance metric is chosen to balance the contribution of each feature to the cost, as all features are converted to the same scale.
The data energyEdata(equation2) comprises two cost functions:CuandCl, whereCucomputes the cost of
assign-ing an unlabeled data pointdi to a classli, wheredi ∈ Du (equation3) andClsets the cost of classifying a labeled
training data pointdito classli, wheredi ∈ T andT ⊂ Dl(equation4). In order to reduce computational cost and
avoid the use of noise or outliers in the classification and energy calculations, only a subsetT of the labeled samples Dlis used for training.Edata,CuandClare defined as:
Edata= di∈Du Cu(li|di)+ di∈T Cl(li|di) (2) Cu(li|di)=ξ(di, η) (3) Cl(li|di)= 0∞,, ifotherwise.li=C (4) Cu is measured as the distance between di and the representative η of class li.η is selected from the training
subsetT. For a labeled data pointdi, the costClis set to zero whenliis the ’ground truth’ target classCand to∞
(practically the largest integer) in all other cases, to direct the chosen cut and guide the classification process. This extremely large distance acts as a high penalty imposed for misclassification.
Esmthis calculated as the sum of the normalized costs of assigning two neighboursdianddjto different classes
(cutting their n-link), ω(di,dj) (equation 5). This cost is calculated as the difference between the local maximum
580 Karma M. Fathalla et al. / Procedia Computer Science 126 (2018) 576–585
Karma M.Fathalla et al/Procedia Computer Science 00 (2018) 000–000
distance maxp∈ℵ(ξ(di,dp)) is the largest pairwise distance among the calculated distances betweendiand a numberm
of its nearest neighboursℵ, whereℵ ⊂ {Du∪ T }. Traditional lazy learning methods include only training samples for
establishing neighbourhoods. Unlike these methods, inGCO mineboth labeled and unlabeled data can contribute to the classification decision of a pointdi, to achieve better structured classes.
Esmth= di dj∈ℵ V(li,lj|di,dj). ω(di,dj) (5) V(li,lj|di,dj)= 01,, ifotherwiseli=lj (6) ω(di,dj)= maxp∈ℵ(ξ(di,dp))−ξ(di,dj) maxp∈ℵ(ξ(di,dp)) (7)
Given these energy definitions, two aspects affect the classification process: the choice of the class representativeη and the selection of the training samples subsetT. Firstly, the choice of a class representative significantly influences theCucontributing toEdata, therefore it is important to investigate the impact of the representative choice. Two class
representatives are studied, namely:
• Centroid (Cent):ηis the data point with minimum overall (sum) distance to allCmembers
• Closest-point (Close):ηis a data point fromCwith minimum distance to pointdi.
Secondly, the selection method for the labeled subset (T) and the number of selected instances need to be considered. The commonly used selection strategies are random and guided. In random selection (r), the training samples are
drawn arbitrarily from the training set. This sampling process is simple and easy to apply, but may lead to the selection of clustered samples or outliers. A guided selection (g) method is proposed to address this issue. The aim of the
proposed guided method is to sample labeled data points of each class that are uniformly distributed in the feature space, while avoiding outliers. For this purpose, the centroid of each class is determined and the angle space around the centroid is partitioned intonsslices, wherensis the number of samples to be drawn. The angle between the class
training samples and the centroid is calculated to locate each training instance within an angle partition. Then for each angle partition, the training instance closest to the median is selected to ensure that it is an appropriate representative (i.e., not an outlier). The number of selected instancesnsdepends on a predefined sampling rateSrand the number of
training samples per classntcsuch thatns=Sr×ntc. Algorithm 1Non-Parametric Classification via GCO
1:procedureGCO mine(Dl,Du, β,m,Sr)
2: T=S ample Training(Dl,Sr)
3: Edata=Compute EData(Du,T) 4: Esmth=Compute ES mooth(Du,T,m)
5: Classlabels=GCO(Du,Edata,Esmth, β)
6:end procedure
The main steps of theGCO minemethod are outlined in Algorithm 1. The differences in subset selection of
the training samples and the class representative choices lead to variations in S ample Training(Dl,Sr) (line 2)
andCompute EData(Du,T) (line 3), respectively. Thus,
there are four variants of GCO mine: GCO miner,Cent, GCO mineg,Cent,GCO miner,closeandGCO mineg,close. 3.3. Parameter Setting for GCO mine variants
The performance ofGCO mineis controlled by hyper parametersβ,mandSr. The optimization of these parameters
can be done by search methods such as grid or heuristic search. Despite its simplicity, blind grid search becomes inefficient as the number of parameters increases and is not practical for searching continuous spaces. In contrast,
genetic algorithms (GA) scale well with the increase in parameter numbers. Since the parameter space ofGCO mine variants is limited, both blind search and genetic algorithms can be applied in conjunction with the proposed variants to reach a near optimal setting. We employ both search techniques and compare them. The performance with each setting is evaluated using cross validation. In blind search, the parameter space is uniformly partitioned and the accuracy of the variants ofGCO minewith each setting is considered. With GAs, each chromosome encodes a possible set of values forβ,mandSrand the fitness of the solution is defined as the overall accuracy.
Karma M.Fathalla et al/Procedia Computer Science 00 (2018) 000–000 Table 1:Medical Dataset Characteristics
Dataset #C S DB CH RVA data 3 0.15 5.30 21.81 Pima Diabetes 2 0.16 4.42 24.29 Ecoli 8 0.35 1.57 81.17 Parkinson 2 0.25 2.85 13.05 Wisc.Breast Diagnostic 2 0.61 0.72 633.63 Breast Tissue 6 -0.36 3.69 6.73 VertebColumn 2C 2 0.09 1.56 55.65 VertebColumn 3C 3 0.08 2.09 97.71 Colic#1 (Surg lesion) 2 -0.10 5.1 4.78 Colic#2 (Outcome) 3 0.04 2.94 26.13 Lymph 4 0.15 1.86 11.50 Dermatology 6 -0.13 5.82 2.07 HeartCleveland 2C 2 -0.05 6.30 2.77
4. Experimental Evaluation
We first introduce our experimental study and then discuss the results on both our RVA data andUCI Machine Learning Repositorydatasets.
4.1. Experimental Study
An extensive set of experiments are conducted to validate the effectiveness and suitability ofGCO mineon our RVA
dataset. Additionally, the general applicability of the proposed method is demonstrated using 12 benchmark datasets, where its performance is shown to be competitive with well established approaches. The experiments employ the Weka [20] and MATLAB environments.
Experimental data:The proposed algorithm is first applied on the RVA data. Asymptomatic volunteers were re-cruited and investigated similarly to [35,38]. Our study is based on 236 participants, eliminating subjects who had a positive diagnosis of severe cardio- or cerebro-vascular disease. Retinal vessel reactivity was measured using the Dy-namic Vessel Analyser (DVA); IMEDOS GmbH, Jena, Germany[35]. For each subject, both artery and vein responses were measured over a period of 350 seconds, including three cyclesF1,F2 andF3 of flicker light stimulation. Reti-nal vessel diameters were recorded at a frequency of 25 readings/sec. After applying polynomial regression on the
recorded response, for each vessel and each flicker cycle and also for the averaged flicker per vessel [35,38], a set of features are calculated per subject creating a total of 104 features [18].
For labeling the data, we adopt a scheme based on the Framingham Risk Score (FRisk) [12]. The FRisk provides a validated means of predicting cardiovascular risk in asymptomatic patients. It presents a 10-year risk score for each subject given physical examination findings and laboratory evaluations. The applied risk score thresholds are the de facto standard widely used in the literature [6]. Three groups are defined and the subjects are labeled accordingly:
• Low Risk (LR):Subjects with FRisk<10% (211 participants).
• Medium Risk (MR):Subjects with 10%≤FRisk<20% (15 participants).
• High Risk (HR):Subjects with FRisk≥20% and subjects with unknown FRS but have one or more risk factors (smoker, Family History of CVD, Diabetes Prone) (10 participants).
For successful cardiovascular risk prediction RVA data need to be oversampled [18]. ADAptive SYNthetic (ADASYN) oversampling [22] is applied on the data and the learning algorithms use the oversampled (real+synthesized) data for
prediction. The resultant POST-ADASYN dataset include 211 low risk, 211 medium risk and 208 high risk samples. The benchmark medical datasets are selected fromUCI Machine Learning Repository[32] to have similar char-acteristics to our RVA dataset in terms of size and/or number of target classes. Imbalanced datasets are selected to
determine the effectiveness of the proposed algorithm in case of skewed datasets. The datasets are outlined in Table1,
they depict various medical conditions and include numeric and categorical features. To indicate the cohesion and separation properties of the classes in each data set, three recognized evaluation measures are reported: Silhouette index (S), Davies Bouldin index (DB) and Calinski-Harabasz criterion (CH) [33]. Silhouette index measures the con-sistency within classes, whileDBandCHassess the scatter within the classes relative to the separation in between them.DBuses the ratio between the intra- and inter- class distances andCHcompares inter- to intra- class variances.
Karma M.Fathalla et al/Procedia Computer Science 00 (2018) 000–000
distance maxp∈ℵ(ξ(di,dp)) is the largest pairwise distance among the calculated distances betweendiand a numberm
of its nearest neighboursℵ, whereℵ ⊂ {Du∪ T }. Traditional lazy learning methods include only training samples for
establishing neighbourhoods. Unlike these methods, inGCO mineboth labeled and unlabeled data can contribute to the classification decision of a pointdi, to achieve better structured classes.
Esmth= di dj∈ℵ V(li,lj|di,dj). ω(di,dj) (5) V(li,lj|di,dj)= 01,, ifotherwiseli=lj (6) ω(di,dj)=maxp∈ℵ(ξ(di,dp))−ξ(di,dj) maxp∈ℵ(ξ(di,dp)) (7)
Given these energy definitions, two aspects affect the classification process: the choice of the class representativeη and the selection of the training samples subsetT. Firstly, the choice of a class representative significantly influences theCucontributing toEdata, therefore it is important to investigate the impact of the representative choice. Two class
representatives are studied, namely:
• Centroid (Cent):ηis the data point with minimum overall (sum) distance to allCmembers
• Closest-point (Close):ηis a data point fromCwith minimum distance to pointdi.
Secondly, the selection method for the labeled subset (T) and the number of selected instances need to be considered. The commonly used selection strategies are random and guided. In random selection (r), the training samples are
drawn arbitrarily from the training set. This sampling process is simple and easy to apply, but may lead to the selection of clustered samples or outliers. A guided selection (g) method is proposed to address this issue. The aim of the
proposed guided method is to sample labeled data points of each class that are uniformly distributed in the feature space, while avoiding outliers. For this purpose, the centroid of each class is determined and the angle space around the centroid is partitioned intonsslices, wherensis the number of samples to be drawn. The angle between the class
training samples and the centroid is calculated to locate each training instance within an angle partition. Then for each angle partition, the training instance closest to the median is selected to ensure that it is an appropriate representative (i.e., not an outlier). The number of selected instancesnsdepends on a predefined sampling rateSrand the number of
training samples per classntcsuch thatns=Sr×ntc. Algorithm 1Non-Parametric Classification via GCO
1: procedureGCO mine(Dl,Du, β,m,Sr)
2: T=S ample Training(Dl,Sr)
3: Edata=Compute EData(Du,T) 4: Esmth=Compute ES mooth(Du,T,m)
5: Classlabels=GCO(Du,Edata,Esmth, β)
6: end procedure
The main steps of theGCO minemethod are outlined in Algorithm 1. The differences in subset selection of
the training samples and the class representative choices lead to variations in S ample Training(Dl,Sr) (line 2)
andCompute EData(Du,T) (line 3), respectively. Thus,
there are four variants of GCO mine: GCO miner,Cent, GCO mineg,Cent,GCO miner,closeandGCO mineg,close. 3.3. Parameter Setting for GCO mine variants
The performance ofGCO mineis controlled by hyper parametersβ,mandSr. The optimization of these parameters
can be done by search methods such as grid or heuristic search. Despite its simplicity, blind grid search becomes inefficient as the number of parameters increases and is not practical for searching continuous spaces. In contrast,
genetic algorithms (GA) scale well with the increase in parameter numbers. Since the parameter space ofGCO mine variants is limited, both blind search and genetic algorithms can be applied in conjunction with the proposed variants to reach a near optimal setting. We employ both search techniques and compare them. The performance with each setting is evaluated using cross validation. In blind search, the parameter space is uniformly partitioned and the accuracy of the variants ofGCO minewith each setting is considered. With GAs, each chromosome encodes a possible set of values forβ,mandSrand the fitness of the solution is defined as the overall accuracy.
Karma M.Fathalla et al/Procedia Computer Science 00 (2018) 000–000 Table 1:Medical Dataset Characteristics
Dataset #C S DB CH RVA data 3 0.15 5.30 21.81 Pima Diabetes 2 0.16 4.42 24.29 Ecoli 8 0.35 1.57 81.17 Parkinson 2 0.25 2.85 13.05 Wisc.Breast Diagnostic 2 0.61 0.72 633.63 Breast Tissue 6 -0.36 3.69 6.73 VertebColumn 2C 2 0.09 1.56 55.65 VertebColumn 3C 3 0.08 2.09 97.71 Colic#1 (Surg lesion) 2 -0.10 5.1 4.78 Colic#2 (Outcome) 3 0.04 2.94 26.13 Lymph 4 0.15 1.86 11.50 Dermatology 6 -0.13 5.82 2.07 HeartCleveland 2C 2 -0.05 6.30 2.77
4. Experimental Evaluation
We first introduce our experimental study and then discuss the results on both our RVA data andUCI Machine Learning Repositorydatasets.
4.1. Experimental Study
An extensive set of experiments are conducted to validate the effectiveness and suitability ofGCO mineon our RVA
dataset. Additionally, the general applicability of the proposed method is demonstrated using 12 benchmark datasets, where its performance is shown to be competitive with well established approaches. The experiments employ the Weka [20] and MATLAB environments.
Experimental data:The proposed algorithm is first applied on the RVA data. Asymptomatic volunteers were re-cruited and investigated similarly to [35,38]. Our study is based on 236 participants, eliminating subjects who had a positive diagnosis of severe cardio- or cerebro-vascular disease. Retinal vessel reactivity was measured using the Dy-namic Vessel Analyser (DVA); IMEDOS GmbH, Jena, Germany[35]. For each subject, both artery and vein responses were measured over a period of 350 seconds, including three cyclesF1,F2 andF3 of flicker light stimulation. Reti-nal vessel diameters were recorded at a frequency of 25 readings/sec. After applying polynomial regression on the
recorded response, for each vessel and each flicker cycle and also for the averaged flicker per vessel [35,38], a set of features are calculated per subject creating a total of 104 features [18].
For labeling the data, we adopt a scheme based on the Framingham Risk Score (FRisk) [12]. The FRisk provides a validated means of predicting cardiovascular risk in asymptomatic patients. It presents a 10-year risk score for each subject given physical examination findings and laboratory evaluations. The applied risk score thresholds are the de facto standard widely used in the literature [6]. Three groups are defined and the subjects are labeled accordingly:
• Low Risk (LR):Subjects with FRisk<10% (211 participants).
• Medium Risk (MR):Subjects with 10%≤FRisk<20% (15 participants).
• High Risk (HR):Subjects with FRisk≥20% and subjects with unknown FRS but have one or more risk factors (smoker, Family History of CVD, Diabetes Prone) (10 participants).
For successful cardiovascular risk prediction RVA data need to be oversampled [18]. ADAptive SYNthetic (ADASYN) oversampling [22] is applied on the data and the learning algorithms use the oversampled (real+synthesized) data for
prediction. The resultant POST-ADASYN dataset include 211 low risk, 211 medium risk and 208 high risk samples. The benchmark medical datasets are selected fromUCI Machine Learning Repository[32] to have similar char-acteristics to our RVA dataset in terms of size and/or number of target classes. Imbalanced datasets are selected to
determine the effectiveness of the proposed algorithm in case of skewed datasets. The datasets are outlined in Table1,
they depict various medical conditions and include numeric and categorical features. To indicate the cohesion and separation properties of the classes in each data set, three recognized evaluation measures are reported: Silhouette index (S), Davies Bouldin index (DB) and Calinski-Harabasz criterion (CH) [33]. Silhouette index measures the con-sistency within classes, whileDBandCHassess the scatter within the classes relative to the separation in between them.DBuses the ratio between the intra- and inter- class distances andCHcompares inter- to intra- class variances.
582 Karma M. Fathalla et al. / Procedia Computer Science 126 (2018) 576–585
Karma M.Fathalla et al/Procedia Computer Science 00 (2018) 000–000 Table 2:GCO mineVariants Performance on RVA data
Blind Search (b) Genetic Algorithm (i) Variant OA tc[s] OA tc[s]
GCO miner,Cent 86.67 812.34 88.57 1020.26
GCO mineg,Cent 88.89 1895.04 88.89 1998.94
GCO miner,close 93.70 1367.36 98.89 1125.85
GCO mineg,close 98.89 2114.35 99.52 2056.42
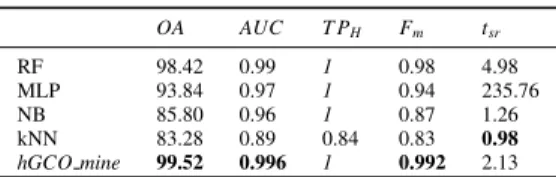
Table 3:Classifiers Performance on RVA data
OA AUC T PH Fm tsr RF 98.42 0.99 1 0.98 4.98 MLP 93.84 0.97 1 0.94 235.76 NB 85.80 0.96 1 0.87 1.26 kNN 83.28 0.89 0.84 0.83 0.98 hGCO mine 99.52 0.996 1 0.992 2.13
Methods Implementation and Settings:Variants ofGCO mineare implemented using MATLAB R2016b. They rely on the MATLAB implementation of GCO Toolbox v3.0 [8,7,31]. For setting the parameters ofGCO minevariants, the allowed ranges are: [0.1, 20] forβ,{1,2, . . . ,10}formand [0.1, 0.9] forSr. These ranges are selected to offer a
balance between performance and computation complexity.
Experimental Algorithms:We compare the results of the proposed algorithm with those of four well established classifiers: Random Forest (RF), Multilayer Perceptron (MLP), Naive Bayes (NB) and K-nearest neighbours (kNN). In our earlier study, we conducted a smaller set of experiments using a wide range of classifiers [18], where we found RF, MLP and NB performing the best. Hence, these were selected for the current experiments. Also, RF and MLP are known for their effectiveness and robustness, while NB offers low computation complexity. kNN is a popular lazy
classifier, to which the proposed method is similar, because it bases the classification decision on the neighbourhood of the instance. The default Weka implementation of RF, MLP, NB and kNN is utilised in the experiments.
Experimental Procedure: First, experiments are conducted to evaluate the success of the proposed variants on the RVA data. Then, the variant with the best accuracy is applied on the benchmark datasets and its performance is compared to the selected well-established classifiers. The reported results are the average of five 10-fold cross validation runs on the available datasets.
Evaluation metrics:The utilised performance indicators are Overall Accuracy (OA), Area Under the ROC Curve (AUC), F-measure (Fm), and True Positives for High risk group when the class is clearly marked as High risk (T PH).
WhileOAis a measure commonly used in the literature, AUCandFmare more suitable for imbalanced data.T PH
is reported in this study because a misclassification in the high risk group could be detrimental (i.e. not capturing the level of risk may lead to missing out on treatment and subsequently deteriorating health). For RVA data, the total computation time tcneeded for parameter space search and training subset selection andGCO minevariants
evaluation is recorded. Also, the execution times of a single runtsrfor all classifiers on RVA data are compared. 4.2. Results and Discussion
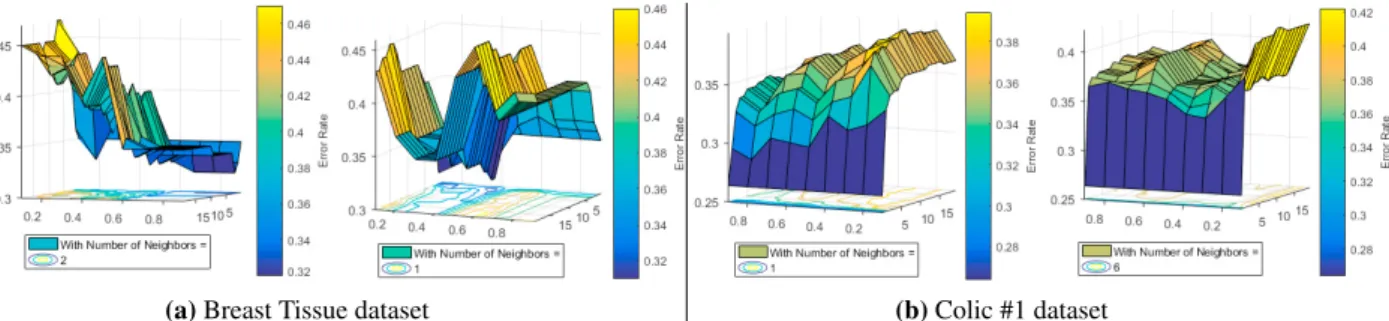
The performance ofGCO mineis evaluated on RVA data and other medical benchmark datasets using blind search and genetic algorithms for parameter setting.
4.2.1. RVA Data
TheGCO minevariants are applied on ADASYN oversampled RVA data [18]. The overall classification accuracy (OA) and computation time (tc) needed for parameter setting by each method are recorded in Table2. An accuracy
improvement (of at least 0.63%) is offered by genetic algorithms with three variants. In terms of computation timetc,
there is no clear winner, as blind search presents lowertcwithcentvariants and genetic algorithms show lowertcwith closevariants for RVA data. Consequently both search methods will be applied on the benchmark datasets.
From these results it can be observed that close variants outperformcent variants with an improvement ofOA of at least 4.81%. This can be explained by the fact thatcent fails to represent scattered and partially coinciding classes, characteristic to our RVA dataset due to the presence of subjects at the borderline between two risk groups. Also, guided sampling contributes to better classification accuracy, at the expense of computation time increase of almost 100%. Thus, the selection of the sampling method becomes a design decision between high accuracy (g) and
low computation time (r). For CVR prediction, high accuracy is essential to avoid consequences of misclassification,
which can be detrimental for missed high risk patients or costly for allocation of low risk patients onto unnecessary treatment plans. Therefore, the highest accuracyGCO mineg,close with GA parameter setting is chosen for further
investigation and comparison to RF, MLP, NB and kNN.
The results ofGCO mineg,closewith genetic algorithms (denoted ashGCO minein Table3) and the set of
estab-lished classifiers (RF, MLP, NB and kNN) are shown in Table3. The results portray the superiority ofGCO mineg,close
Karma M.Fathalla et al/Procedia Computer Science 00 (2018) 000–000 Table 4:Classifiers Performance on Continuous Datasets
OA AUC T PH Fm Pima RF 75.26 0.81 0.60 0.75 Diabetes MLP 75.13 0.79 0.61 0.75 NB 76.30 0.81 0.61 0.76 kNN 72.52 0.79 0.58 0.72 bGCO mine 76.32 0.80 0.59 0.76 hGCO mine 77.24 0.83 0.65 0.77 Ecoli RF 86.09 0.96 0.86 MLP 85.71 0.95 0.86 NB 85.41 0.96 0.86 kNN 86.90 0.95 0.86 bGCO mine 88.48 0.97 0.87 hGCO mine 89.39 0.98 0.89 Parkinson RF 91.28 0.96 0.75 0.91 MLP 91.28 0.96 0.83 0.91 NB 69.23 0.86 0.61 0.75 kNN 93.84 0.98 0.81 0.94 bGCO mine 93.16 0.98 0.77 0.93 hGCO mine 94.21 0.98 0.81 0.94 Wisconsin RF 95.78 0.99 0.98 0.96 Breast MLP 96.66 0.99 0.95 0.97 Diagnostic NB 92.97 0.98 0.94 0.93 kNN 95.95 0.95 0.97 0.96 bGCO mine 96.25 0.99 0.96 0.97 hGCO mine 96.79 0.99 0.98 0.97 Breast RF 71.69 0.93 0.72 Tissue MLP 64.15 0.88 0.65 NB 70.75 0.93 0.71 kNN 71.69 0.83 0.72 bGCO mine 69.00 0.83 0.70 hGCO mine 72.00 0.93 0.73 Verteb RF 84.19 0.93 0.76 0.84 Column MLP 84.51 0.93 0.70 0.85 2C NB 77.74 0.88 0.87 0.80 kNN 80.00 0.86 0.68 0.80 bGCO mine 87.00 0.93 0.78 0.86 hGCO mine 86.67 0.94 0.78 0.86 Verteb RF 83.54 0.96 0.84 Column MLP 85.48 0.96 0.86 3C NB 83.23 0.95 0.83 kNN 77.42 0.91 0.78 bGCO mine 86.33 0.98 0.86 hGCO mine 87.00 0.98 0.86
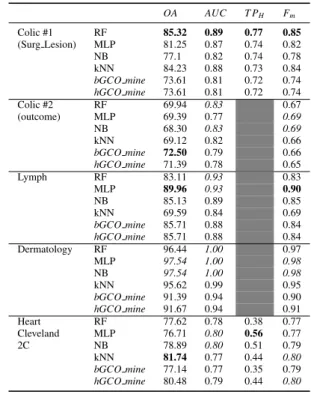
Table 5:Classifiers Performance on Categorical Datasets
OA AUC T PH Fm Colic #1 RF 85.32 0.89 0.77 0.85 (Surg Lesion) MLP 81.25 0.87 0.74 0.82 NB 77.1 0.82 0.74 0.78 kNN 84.23 0.88 0.73 0.84 bGCO mine 73.61 0.81 0.72 0.74 hGCO mine 73.61 0.81 0.72 0.74 Colic #2 RF 69.94 0.83 0.67 (outcome) MLP 69.39 0.77 0.69 NB 68.30 0.83 0.69 kNN 69.12 0.82 0.66 bGCO mine 72.50 0.79 0.66 hGCO mine 71.39 0.78 0.65 Lymph RF 83.11 0.93 0.83 MLP 89.96 0.93 0.90 NB 85.13 0.89 0.85 kNN 69.59 0.84 0.69 bGCO mine 85.71 0.88 0.84 hGCO mine 85.71 0.88 0.84 Dermatology RF 96.44 1.00 0.97 MLP 97.54 1.00 0.98 NB 97.54 1.00 0.98 kNN 95.62 0.99 0.95 bGCO mine 91.39 0.94 0.90 hGCO mine 91.67 0.94 0.91 Heart RF 77.62 0.78 0.38 0.77 Cleveland MLP 76.71 0.80 0.56 0.77 2C NB 78.89 0.80 0.51 0.79 kNN 81.74 0.77 0.44 0.80 bGCO mine 77.14 0.77 0.35 0.79 hGCO mine 80.48 0.79 0.44 0.80
over its counterparts considering theOA,AUCandFmevaluation metrics, while aT PHof 1 is achieved by all
algo-rithms except kNN. On the other hand, the least execution timetsris offered by kNN, whileGCO mineg,closepresents
an averageOAimprovement of 14% over the accuracies of the faster kNN and NB alternatives. Compared toRF, the second best alternative,GCO mineg,closeimprovesOA,AUC,Fmand reducestsrto 43%.
4.2.2. Benchmark Medical Data
GCO mineg,close, RF, MLP, NB and kNN are applied on the benchmark datasets previously outlined in Table 1.
Blind search and heuristic search using genetic algorithms denoted bybandhrespectively are employed for
param-eter setting withGCO mineg,close. Table4and Table5depict the performance evaluation results. Table4illustrates
the results of the datasets with features having real continuous values, while Table5 present results on the datasets that include categorical variables. As shown,GCO mineg,close is particularly effective on datasets of continuous real
features and it presents a competitive performance on categorical datasets. This can be attributed to the utilization of standardized Euclidean distance metric in data cost calculation, since this metric is designed for real valued samples. A similar improvement could be achieved for categorical data through the future adoption of a specially designed distance function.
Overall,GCO mineg,closehas higherOAon 8 out of 12 datasets with differences ranging from 0.13 % to 2.56 %
to the second highest accuracy value. In some cases,GCO mineg,closeshows a remarkable accuracy increase such as
when applied on the Parkinson dataset, a 25 % increase is recorded when compared to NB. In comparison to kNN (a nonparametric classifier of similar principle),GCO mineg,closeis superior in 9 out of 12 datasets; the improvement