Comparison of explicit vs. implicit measurements in predicting food purchases Elina Kytö, Harold Bult, Esther Aarts, Joost Wegman, Rianne MAJ Ruijschop, Sari Mustonen
PII: S0950-3293(19)30218-6
DOI: https://doi.org/10.1016/j.foodqual.2019.103733 Article Number: 103733
Reference: FQAP 103733
To appear in: Food Quality and Preference
Received Date: 22 March 2019 Revised Date: 21 June 2019 Accepted Date: 27 June 2019
Please cite this article as: Kytö, E., Bult, H., Aarts, E., Wegman, J., Ruijschop, R.M., Mustonen, S., Comparison of explicit vs. implicit measurements in predicting food purchases, Food Quality and Preference (2019), doi: https:// doi.org/10.1016/j.foodqual.2019.103733
This is a PDF file of an unedited manuscript that has been accepted for publication. As a service to our customers we are providing this early version of the manuscript. The manuscript will undergo copyediting, typesetting, and review of the resulting proof before it is published in its final form. Please note that during the production process errors may be discovered which could affect the content, and all legal disclaimers that apply to the journal pertain.
Manuscript for: Food Quality and Preference
Comparison of explicit vs. implicit measurements in predicting food purchases
Elina Kytöab*, Harold Bult cd**, Esther Aartse, Joost Wegmane, Rianne MAJ Ruijschopc and Sari
Mustonenf
aDepartment of Economics and Management
P. O. Box 27, FI – 00014 University of Helsinki (Finland)
bValio
P. O. Box 10, FI – 00039 Valio (Finland)
cNIZO
P.O. Box 20, 6710 BA Ede (The Netherlands)
dApplegg, Amersfoort, The Netherlands
eDonders Institute for Brain, Cognition and Behaviour, Centre for Cognitive Neuroimaging,
Radboud University, Nijmegen, The Netherlands
fSOK Media
Fleminginkatu 34 – 00510 Helsinki (Finland)
*Contact information: [email protected]
Abstract
In this study, we aimed to investigate the relation between consumer purchases of three branded blueberry flavored quarks and respective responses of the same consumers to these products using 1) traditional explicit consumer surveys measuring verbalized impressions, 2) novel explicit pictorial emoji scores and 3) implicit behavioral responses produced during an approach-avoidance task (AAT). Explicit measures (n=134) were collected before product tasting (expectation condition) during an online survey, and after product tasting (perception condition) during a Central Location Test (CLT). Implicit measures were collected with a subset of 56 randomly selected subjects during the CLT. These included electroencephalographic (EEG) measures, joystick response speed and pupil size responses. During one month following the CLT, respondents registered their purchases via an online diary. Bivariate correlations indicated that explicit scores correlate better with product purchase amounts in the perception condition than in the expectation condition. Furthermore, verbalized ratings correlated better with product purchase amounts than pictorial emoji scores. Of the implicit responses, EEG responses produced the strongest correlations with purchase behavior, similar to those observed for verbalized explicit ratings in the expectation condition. Multiple linear regression modelling indicated that the best-fitting model consisted of an emoji score, purchase intention score, pleasantness score, brand relationship score, and implicit joystick response speed. Overall, purchase behavior was associated stronger with explicit responses than with implicit responses. Yet, the prominent role of implicit joystick response speed in the multivariate regression model suggests its unique contribution to the understanding of purchase behavior.
Keywords Purchase behavior Prediction Consumer Explicit measurements Implicit measurements Dairy
1. Introduction
For the average consumer that is confronted with a multitude of choices in the grocery store, the decision of which food to choose is rarely a result of consciously weighing pros and cons. To the contrary, food choice is often a sub-consciously generated impulse defined by convenience, habit, prior exposure, labelling and the person’s metabolic or emotional need state. This is reflected in retrospect motivations that consumers give for choosing a food (Renner, Sproesser, Strohbach, & Schupp, 2012). In their work on The Eating Motivation Survey, Renner et al. (2012) identified choice-driving factors from food choice motivation scores. Few of these reflect conscious decisions: ‘health’4, ‘natural concerns’8, ‘price’10, ‘weight control’12, ‘social image’15 and
‘social norms’14 (sub-script numbers index the factor importance). Of the remaining factors,
several are of an affective nature, i.e. ‘liking’1, ‘pleasure’6, ‘visual appeal’11 and ‘affect
regulation’13 . Yet, drivers that contributed most to the choice behavior do not require any
conscious consideration: ‘habit’2, ‘need & hunger’3, ‘convenience’5, ‘tradition’7, and ‘sociability’9.
In addition, Renner et al. (2012) showed that the importance of each driver varies largely over consumers. At the present, most consumer studies employ explicit ratings of ‘liking’ or ‘pleasure’ to predict the market potential of new foods or food concepts. These ratings merely tap a subset of the factors that drive food choice. Would food choice be predicted better if a more comprehensive set of explicit measures were used? Alternatively, would food choice be predicted better by tapping directly into the primary neural processes that control choice behavior?
In addition to the regular explicit measures ‘liking’ and ‘preference’, self-estimates of purchase intention and purchase probability have commonly been used to predict purchase behavior (e.g. fast-moving consumer goods, Brennan, & Esslemont, 1994; services, Newberry, Klemz, & Boshoff, 2003; durables, Armstrong et al., 2000). Still, the purchase intention might not be the best possible predictor of the purchase behavior. Kytö, Järveläinen and Mustonen (2018) evaluated how well combinations of different predictors predict purchase behavior but found the purchase intention to be the best possible predictor out of all used predictors (e.g. pleasantness and emotional responses presented both verbally and visually).
Food consumption is strongly associated with the experience of emotions. On the one hand, emotional state is known to affect food choice, food intake and food liking (Gardner, Wansink, Kim, & Park, 2014; Oliver, Wardle, & Gibson, 2000). On the other hand, food consumption can
influence consumers’ mood and emotions (Canetti, Bachar, & Berry, 2002; Macht, 2008). An increasing number of methods exist for the explicit quantification of emotional state in relation to product consumption. Rather than verbalizing these emotions, consumers tend to resort to using pictorial representations of emotions. Vidal et al. (2015) investigated Twitter data and found that emotions were rarely mentioned in tweets but emoticons were used more often. Consequently, emoji or emoticon surveys have gained popularity as emotion measures in relation to food evaluations. Jaeger et al. used emojis to measure emotional associations to the names of foods and beverages (2017b) and to tasted samples (2017a). The present study also implements pictorial emoji surveys for evaluations of foods before and after tasting.
Since the 1950s, animal studies have revealed dedicated neural networks that regulate stimulus approach and stimulus avoidance behavior in mammals (Delgado, Roberts, & Miller, 1954; Gastaut, Naquet, Vigouroux, & Corriol, 1952; Olds & Olds, 1963). Subsequent investigations on human subjects identified analogous neural structures guiding comparable stimulus approach and avoidance behavior. The ventral striatum, and in particular the nucleus accumbens therein, is identified as a structure that governs motivational responses towards a wide variety of stimuli, including food cues (Lawrence et al., 2012; Katner & Weiss, 1999), and rewarding non-food stimuli (Aharon et al., 2001; Cloutier, Heatherton, Whalen, & Kelley, 2008; Knutson et al., 2001; Knutson et al., 2007; David et al., 2005). As motivational responses occur for stimuli that predict a reward, the related ventral striatal response is generally referred to as the anticipated reward response (Carlson, Foti, Mujica-Parodi, Harmon-Jones, & Hajcak, 2011; Knutson, Adams, et al., 2001; Knutson, Fong, Adams, Varner, & Hommer, 2001; O'Doherty, Deichmann, Critchley, & Dolan, 2002; Rothemund et al., 2007).
Quantifiable behavioral correlates for motivational stimulus responses like approach and avoidance tendencies can be obtained by behavioral tasks that provoke involuntary responses to stimuli, such as the Approach-Avoidance Task (AAT). Since its conception (Solarz, 1960), the AAT has developed into a computerized reaction time task in which subjects are instructed to use a joystick to move a manikin that represents itself towards or away from a visual representation of the stimulus in the screen. Whereas the images presented are the stimuli of interest, the task instruction (“move the manikin as fast as possible into the instructed direction”) does not appear to require focused stimulus evaluation. Nonetheless, task instructions that conflict with a subject’s approach tendency towards the stimulus produce delays in the execution of responses.
Correspondingly, the completion of an approach response to a desired stimulus would require less time than producing the same response to an undesired stimulus. This effect is observed, regardless of whether subjects are children responding to pleasant insects (butterflies) vs. unpleasant (spiders) (Klein, Becker, & Rinck, 2011), heavy drinkers responding to alcohol-related images vs. neutral images (Field, Caren, Fernie, & de Houwer, 2011), young adults responding to images showing fearful vs. pleasant scenes (Ernst, 2013), or male students responding to happy faces vs. angry faces (Radke, Roelofs, & de Bruijn, 2013). For food being such an essential commodity, it may not come as a surprise that the AAT also proved to be a sensitive method to distinguish between wanted and unwanted foods (Field et al., 2011; Kemps et al., 2013; Piqueras-Fiszman et al., 2014; Wegman et al. 2018).
In addition to behavioral measures, electroencephalographic (EEG) measures were identified as correlates of neural approach and avoidance responses. Ernst et al. (2013) investigated the effect of approach-avoidance conflict for responses to positive stimuli on EEG. Using the AAT, they observed that negative going event-related EEG potentials (ERPs) at frontal electrode locations 200-300ms after stimulus onset (N200) reflect the eventual behavioral approach tendency. Cerebral sources inferred from these ERPs did not include the ventral striatum, however. Carlson et al. (2011) also studied N200 in response to signals of a negative reward outcome. The response maximized at central scalp locations over the frontal cortex and source localization indicated the ventral striatum as its most probable source. In the same experiment, fMRI BOLD responses in that region were consistent with ERP findings. These ERP-fMRI correlations were confirmed at our laboratory when studying anticipated reward responses in the ventral striatum for similar foods within a single food category that received different subjective preferences (Wegman et al., 2015).
When subjects perform a cognitive task in which visual stimuli are to be processed, the level of task engagement is reflected in (positive-going) pupil size responses (Laeng, Sirois, & Gredebäck, 2012; Murphy, Robertson, Balsters, & O'Connell, 2011). Fewer reports suggest that stimulus reward anticipation also contributes to the event-related pupil size response (Satterthwaite et al., 2007). Since the AAT follows a strict monotonous protocol, regardless of stimulus differences, task engagement is not expected to differ over stimuli. Hence, if at all, stimulus-specific pupil size responses during AAT are expected to depend on reward anticipation only. Therefore, pupil size responses to visual stimuli are also evaluated as an implicit measure of reward anticipation.
Traditional consumer research methods aim at predicting purchase behavior on basis of product evaluations. Instead, the implicit responses to food images used in this study are evoked in the absence of real products and are therefore expected to reflect ‘wanting’ rather than ‘liking’. The aim of this study was to compare explicit verbal consumer measures, explicit pictorial emoji scores and implicit (electro-) physiological measures on their contribution to the prediction of purchases of three different blueberry flavored quarks, a fermented dairy product. The three different quark brands studied were available in supermarkets during the study. By collecting explicit ratings before product evaluations in an online survey and after product evaluation in a central location test, predictors pertain to anticipated and actual perception of the three quarks, while implicit neurophysiological measures collected one day after consumption pertain to anticipated reward responses.
2. Materials and Methods 2.1 Overview
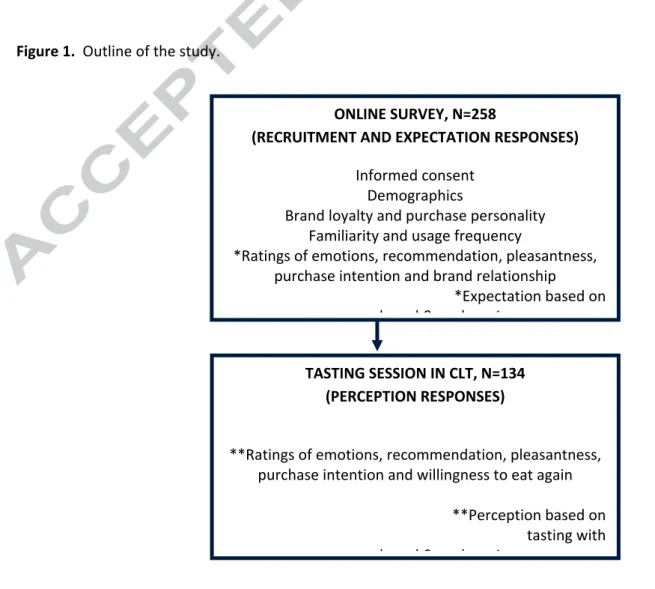
Data collection entailed the registration of consumer responses to blueberry flavored quarks. This comprised four phases: i) an online survey, ii) sensory product evaluations (tasting session) at a central location, iii) measurement of implicit responses at a central location, and iv) the registration of products purchased during one month in any preferred grocery store using an online diary (Figure 1). Central location tests (CLTs) were performed in Helsinki, Finland.
2.2 Samples
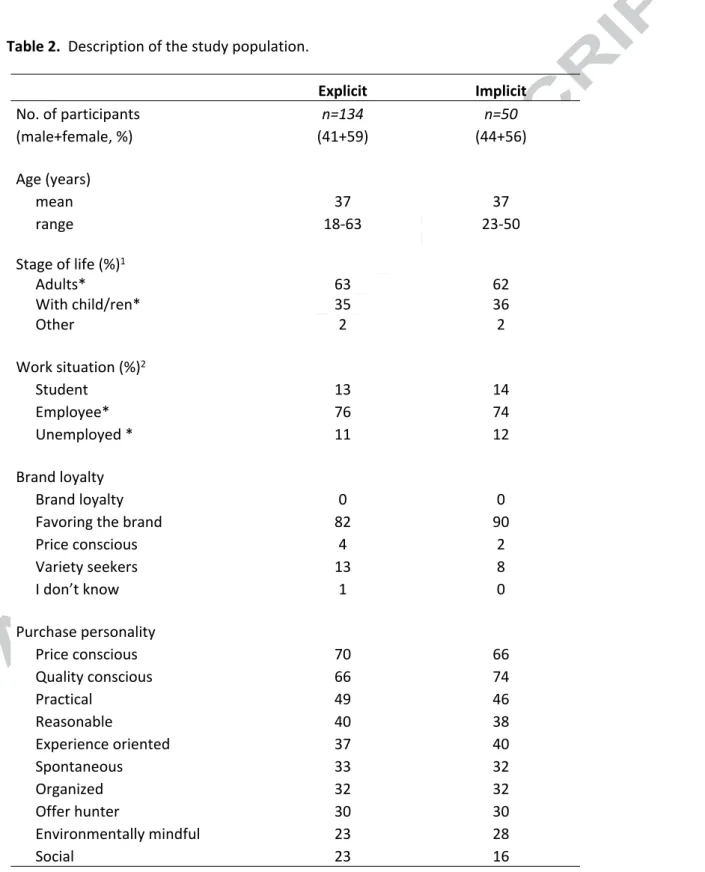
The three commercially available blueberry flavored quarks used were produced by three different manufacturers. Quark is a spoonable fermented fresh dairy product. The quarks were marketed in equally-sized plastic containers, each contained approximately 10% of protein. Although the quarks were similar in many ways, they did not taste identically, and their brands were also clearly different (Table 1). When represented by images, products were depicted from the same viewing angle as it is commonly observed in the grocery store cooler. View angle, luminosity, and text density (brand name and references to protein contents) in these images were kept uniform.
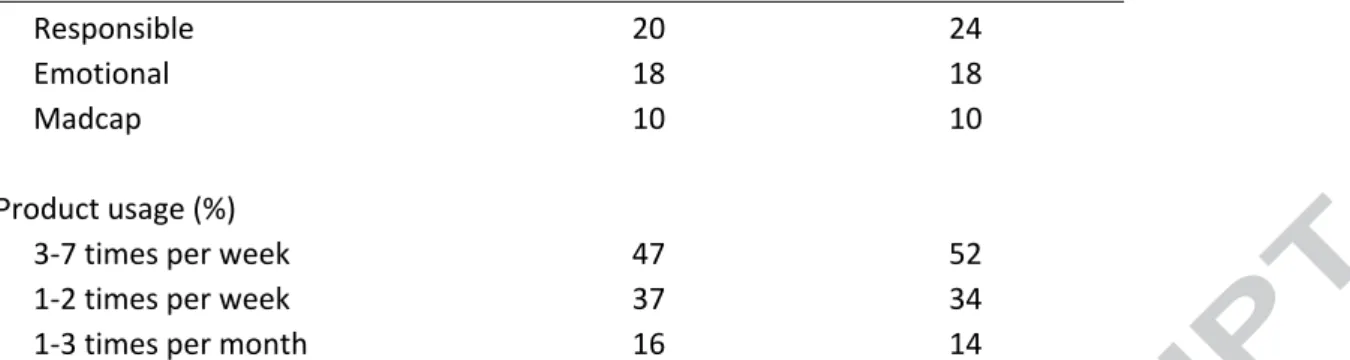
A total of 258 consumers were recruited through an online recruiting platform by a nation-wide marketing research agency (Norstat, Helsinki). Of these, 134 completed the online survey, a session in which the products were evaluated and the diary purchase data collection (Table 2). Of these 134 respondents, 56 were randomly selected from the subset of right-handed respondents that had reported that they could read computer screens without support of glasses for the implicit measurements. In the recruitment phase, the respondents gave informed consent to participate in the study. The procedure followed the ethical principles of the University of Helsinki sensory evaluation laboratory. The principles were approved by the Ethical Committee of the University of Helsinki. Respondents were rewarded with gift cards after completing the study.
2.4 Procedure 2.4.1 Survey (online)
In the online survey, respondents reported their gender, age by year of birth, stage of life/family status, and work situation. Additionally, brand loyalty related to quarks was asked by choosing one of the following options: 1) “I always purchase the same brand. If it’s not available, I won’t buy anything else instead” (later classified as ´brand loyal´), 2) “I prefer a certain brand but if it’s not available, I may buy something else” (later classified as ´favoring the brand´), 3) “I prefer a certain brand but sometimes I choose something else for the sake of variety” (later classified as ´variety seekers´), 4) “I usually buy a certain brand but if there is an offer or cheaper price I will choose the cheaper option” (later classified as ´price conscious´), 5) “I always tend to choose the cheapest option available” (later classified as ´price conscious´), 6) “I buy different brands without thinking it” (later classified as ´variety seekers´), 7) “I don’t know” (excluded from the analysis because of low number of responses), and purchase personality by selecting a maximum of five personality attributes from the list ‘experience-oriented’, ‘spontaneous’, ‘social’, ‘emotional’, ‘price conscious’, ‘quality conscious’, ‘practical’, ’madcap‘, ‘organized’, ‘environmentally mindful’, ‘reasonable’, ‘responsible’ and ‘offer hunter’. Respondents rated their familiarity with a product or their product use experience using an 8-point structured scale modified from Tuorila, Lähteenmäki, Pohjalainen, and Lotti (2001) (1=I do not recognize this product, 2=I recognize the product, but have not tasted it, 3=I have tasted this product, 4=I eat
this product less than once a month, 5=I eat this product 1–3 times per month, 6=I eat this product 1–2 times per week, 7=I eat this product 3–5 times per week, 8=I eat this product daily). In addition, respondents produced several product-related consumer scores, reflecting their product expectations upon presentation of the visual product stimuli (including brand information). These scores included:
Emotion scores using emojis modified from Jaeger, Xia, Lee, Hunter, Beresford, and Ares (2018). Emojis used represented (1) positive emotions (smiling face with smiling eyes, grinning face, smiling face with smiling eyes and open mouth, smiling face with heart shaped eyes, smiling face, relieved face, smiling face with sunglasses, face with stuck out tongue and open eyes, face throwing kiss), (2) neutral emotions (neutral face, expressionless face, sleeping face), (3) negative emotions (flushed face, face with stuck out tongue and tightly closed eyes, face screaming in fear, confused face, confounded face, tired face, persevering face, weary face, disappointed face, angry face, face with cold sweat, crying face, and face crying out loud).
Willingness to recommend products (on a labelled 0-10 scale) using Promoter Score (PS). Pleasantness scores, using a 7-point labelled scale (1=I do not like at all, 7 = I do like a lot). Purchase intention score using a 5-point structured scale (1 = I certainly would not buy, 2 = I hardly would buy, 3 = I am not sure would I buy or not, 4 = I almost certainly would buy, 5 = I certainly would buy). Purchase intention referred to the intended purchases during the next month.
Brand relationship scores (0-100 scale). To rate this, respondents were asked to employ a distance task: “if you were the person sitting on the bench: how near or far would you place the product next to you on the bench? The closer you place them to you, the more you prefer that product.”
2.4.2 Tasting session (CLT)
Respondents got to taste 50 g of each quark. The presentation order of the samples was individually randomized. Samples were tasted with the brand and package image shown on a computer screen. Again, emotions, PS, pleasantness and purchase intention were rated using previously mentioned scales. In addition, respondents rated their willingness to eat the products
again by using a 4-point structured scale (1 = I certainly would not eat again, 2 = I hardly would not eat again, 3 = I might eat again, 4 = I certainly would eat again).
2.4.3 Implicit measurements
Implicit measures consisted of Electroencephalographic (EEG) responses registered on the scalp, approach tendency scores obtained from joystick responses during the approach-avoidance task (AAT) and pupil size modulations. All responses were event-related with respect to the onset time of the product image. Only images were used as stimuli. Prior to- and during the implicit measurements, no quarks were eaten.
EEG. EEG responses were measured with 19 electrodes at a subset of 10/20 scalp locations (FP1, FP2, F3, Fz, F4, FCz, C3, Cz, C4, P7, P3, Pz, P4, P8, O1, Oz, O2, TP9, and TP10). Besides the midline, these locations covered sensitive correlate locations for striatal anticipated reward responses, i.e. Ernst et al. (2013) and Carlson et al (2011). An additional EEG channel was used to register analogue trigger voltages that timed the presentations of visual product cues. Water-based electrodes (Volosyak, Valbuena, Malechka, Peuscher, & Gräser, 2010) were used to minimize measurement invasiveness, while assuring sufficient electrode conductivity. EEG voltages were sampled at 2048 Hz with a TMSi-Porti, 32-channel amplifier (TMSi, Oldenzaal, The Netherlands) and registered by TMSi Polybench software (Version 1.29, TMSi, Oldenzaal, The Netherlands) on a Lenovo ThinkPad W520 laptop with an Intel i7-2760QM processor and 8.0 GB of RAM installed. AAT. To invoke behavioral and electrophysiological responses indicative of motivational product responses, a joystick version of the classical approach-avoidance task was developed (Solarz, 1960). Stimulus image presentation and joystick response registration and evaluated was automated by a NeuroBS Presentation® script (Version 18.1, Neurobehavioral Systems, Inc., Berkeley, CA). Joystick responses were registered with a Logitech Extreme 3D Pro mouse and defined as the latencies (in milliseconds) between onset of the product image in the screen and the moment that the joystick had moved either to the left or the right from the neutral position in the middle for 25% of the full displacement range. Depending on task instructions, required joystick responses to the left and the right constituted approach responses in 50% of the trials and avoid responses in the remaining 50% of trials. An AAT trial consists of 4 steps: 1) Presentation of a fixation cross centered in the screen during an interval of variable length to
prevent stimulus anticipation responses, 2) Presentation of one of three quark images centered in the screen for 800 ms in the absence of task instructions. This suffices to evoke ERP P-300 responses to the product image alone, 3) Presentation of the manikin to the left or right of the quarks in combination with a visual cue indicating whether the subject should move the manikin towards or away from the central image, 4) written feedback indicating whether joystick responses were ‘Correct’, ‘Incorrect’, or ‘Too late’. This AAT was described in more detail by Wegman et al (2018).
Differences in response times due to approach or avoidance tendencies are best observed when respondents respond as fast as possible. This was stimulated by awarding movie tickets to the subject that produced the highest number of correct responses before response deadline, and by imposing an adaptive response deadline. Respondents started with a 700 ms response deadline for each stimulus, which was shortened with 15ms after each correct response for the respective stimulus. Deadlines were prolonged with 25ms after late responses, to prevent respondents from getting frustrated.
Pupillometry. Pupil sizes were obtained for both eyes by two infra-red Smart Eye Pro eye tracker cameras (Noldus BV, Wageningen, The Netherlands) placed alongside the stimulus presentation display and aimed at the subject. Camera lenses were positioned outside the stimulus presentation display, on its horizontal midline, 2 cm to the left and the right side of the display. Smart Eye Pro software was used to sample pupil diameters (left and right eye) at a 60 Hz sampling rate. The eye tracker data were collected on a HP-Spectre laptop with an Intel i7 processor and 4 GB of RAM installed, running under MS Windows 7. The eye tracker software sampled an additional trigger signal that timed the presentations of product image cues, produced by the Presentation® script. For this, customized hardware and software was developed in collaboration with Noldus BV. The eye tracker software also produces the eye gaze position in the screen. This information was not used for data analysis but was used during data acquisition to monitor task compliance and the quality of data acquired.
2.4.4 Diary (online)
Respondents kept track of their daily quark purchases in paper diaries. Starting the day after the CLT/implicit measurements, they kept that diary for one month. As a reference to book the
products that they had bought, respondents used a quark catalog provided by the test leader. This catalog listed nearly all quarks available in the market (21 unflavored quarks and 25 flavored quarks). On average twice per month, respondents transferred written purchase reports to online purchase reports.
2.5 Data analysis
Only results of respondents that completed the purchase diaries were considered for data analyses. This amounts to a total of 134 complete explicit measures data sets and 56 complete implicit measures data sets. Consequently, explicit ratings for the three products include 3 x 134 = 402 observations per measure and implicit measures include 3 x 56 = 168 observations per measure. All observations were assigned to one of three subgroups: ‘non-buyers’, ‘light buyers’ and ‘heavy buyers’. Respondent-product scores were categorized as ‘non-buyers’ when, during the diary keeping period, respondents never reported that they had purchased the evaluated product. Scores were categorized as ‘light buyers’ when respondents reported 1-3 purchases of the product. ‘Heavy buyers’ were those respondent-product combinations for which more than three purchases were reported during the diary keeping period. When pooling product responses according to product-buyer categories, scores (such as pleasantness and purchase intention) were assigned per respondent-product combination. Thus, respondent X could be a light buyer for product 1 and non-buyer for product 2, etc. 13 % of the respondent did not purchase any of the studied products, 54 % of the respondents purchased just one of the studied products and 33 % of the respondents purchased either two or three of the studied products during the diary keeping period.
2.5.1 Explicit measurements
Frequencies of each checked emojis were calculated for all buyer groups. Additionally, frequency of at least one positive, neutral or negative emojis checked were calculated for all these groups in both conditions (expectation and perception). Frequencies of detractors, passives and promoters were calculated from PS scores so that the scores 0-6 were for detractors, 7-8 for passives and 9-10 for promoters. Frequencies of dislikers, mediocres and likers were calculated from pleasantness scores so that the scores 1-2 were for dislikers, 3-5 for mediocres and 6-7 for likers. Frequencies of non-intenders, hesitants and intenders were calculated from purchase
intention scores so that the scores 1-2 were for non-intenders, 3 for hesitants and 4-5 for intenders.
A two-way ANOVA was used to compare the recommendation, pleasantness and the purchase intention ratings of the purchase frequency groups in both conditions, as well as for brand relationship ratings in expectation and willingness to eat again ratings in perception phase. Proportions of different emotion, recommendation, pleasantness and purchase intention ratings of purchase frequency groups were computed in both conditions (expectation and perception), and differences between these proportions were compared with Z-test. Differences were significant when the p value was less than 0.05. Data analysis of explicit measurements was performed using IBM SPSS Statistics for Windows Version 23 (SPSS Inc. Chicago, 2007).
2.5.2 Implicit measurements
Of the 56 subjects that participated in implicit measure tests, four were excluded from data analyses because pupil responses or EEG responses contained excessive artefacts.
EEG response results were analysed using the EEGLab toolbox version 14.1.1 (Delorme, Makeig, et al., 2004) running under Matlab (v2014a, The MathWorks, Inc., Natick, MA). EEG data was resampled to 256 Hz, filtered (low cut-off frequency = 2.0 Hz, high cut-off frequency = 40 Hz), and epoched (-200 ms to 800 ms) with respect to product cue onsets. After baselining with respect to the average responses in the -200 ms to 0 ms window, channels in which absolute values exceeded 30 μVolts were excluded epoch-wise from analysis. Per respondent-product combination, event related potentials (ERPs) were then calculated by averaging over Product replicates. Late N200 voltages (250-300ms) were averaged per scalp location and then multiplied with the “product-approach bias” contrast identified previously to obtain motivational approach bias estimates per respondent*product combinations. These ERP-based motivational approach bias estimates (single scalar values), were subjected to statistical analyses.
AAT response data. For correct joystick response directions (both in-time and too-late), response initiation latencies were calculated using a Matlab script for approach instructions and avoid instructions separately. For each of the three products, individual product-approach tendencies were calculated as the difference between the average avoidance latency and the average approach latency.
Pupil response data. Continuous pupil diameter (in mm) of both eyes were epoched (-1000ms : 4000ms) relative to the onset of the product cue, using a Matlab script. After baselining against pupil sizes during the -1000ms: 0ms time window, epoched pupil sizes were averaged over epoch replicates per Product.
Effects of buyer category on ERP-related motivational approach bias estimates, product-approach tendency and pupil responses in the 1000-2000 ms window were evaluated by repeated measures ANOVA with product as a within-subject factor and respondent as between-subject factor (Statistica 10, StatSoft inc, Tulsa, OK). In case of significant ANOVA effects, post-hoc evaluations of the statistical significance of ERP-based motivational approach bias estimates, approach tendencies and pupil responses due to pairwise buyer category differences were Tukey-corrected for repeated comparisons (Statistica 10, StatSoft inc, Tulsa, OK).
2.5.3 Explicit and implicit responses in relation to purchase frequencies
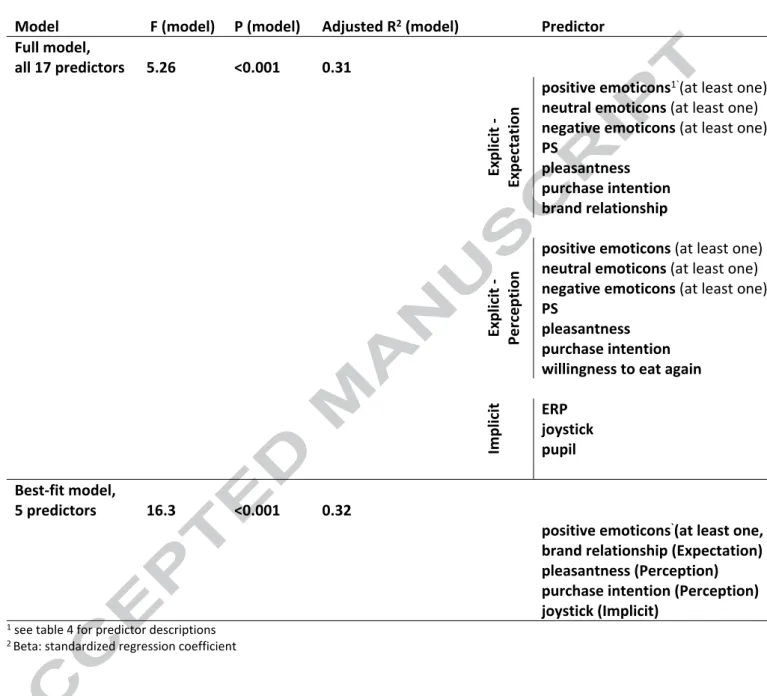
Correlations between explicit, implicit and purchase frequency groups were calculated by Pearson’s r correlation coefficient for respondents who completed both explicit and implicit measurements (N=50). In addition, multivariate linear regression models of purchase frequency group scores were calculated for the implicit and explicit predictor variables. Model fits were analyzed by ANOVA and normalized predictor fits were calculated for the full 17-predictor model and the best fitting model obtained by backward one-by-one elimination of least fitting predictors. Data analysis was performed using IBM SPSS Statistics for Windows Version 23 (SPSS Inc. Chicago, 2007).
3. Results
3.1 Explicit measurements of buyers and non-buyers Emotions by emojis
Before tasting the product, expectation-based emoji scores on the negative-emotion emojis did not differ (5-7%) between different buyer groups (Table 3). Expectation scores on positive emojis were higher for both buyer groups (light buyers: 89%, heavy buyers: 91%) than for non-buyers (82%).
After sensory evaluation, perception-based emoji scores differed between buyer groups. Non-buyers had selected negative emojis (30%) more often than Non-buyers (8-11%). Moreover, non-buyers had selected neutral emojis (67%) more often than non-buyers (27-40%). Positive emojis were selected more often by buyers (82-95%) than by non-buyers (60%).
Recommendation by Promoter Scores
Promoter Scores were strongly related to purchase frequency (Table 3). The ratings of buyers increased from expectation to perception while for non-buyers it was vice versa [interaction of purchase frequency groups x evaluation condition: F(2,399)=22.19; p<0.001]. Buyers were more willing to recommend the purchased products than non-buyers [main effect of purchase frequency groups F(2,399)=69.32; p<0.001].
Consistent with expectations there were more promoters in light buyers (31%) than in buyers (17%) but less than in heavy buyers (46%). In addition, there were more detractors in non-buyers (47%) than non-buyers (27%).
Again, based on the perception, the differences between purchase frequencies were clearer. There were more promoters in light buyers (41%) than in non-buyers (8%) but less than in heavy buyers (51%), and more detractors in non-buyers (70%) than in buyers (9-31%).
Pleasantness
Pleasantness was also strongly related to purchase frequency (Table 3). The ratings of buyers increased from expectation to perception while for non-buyers it was vice versa [interaction of
purchase frequency groups x evaluation condition: F(2,399)=20.46; p<0.001]. Buyers had higher pleasantness ratings than non-buyers [main effect of purchase frequency groups F(2,399)=72.12; p<0.001].
Based on the expectation, the more the person liked the product the more likely she/he purchased the product more. There were more likers in heavy buyers (66%) than less frequently buyers (34%) and non-buyers (27%).
Based on the perception, the differences between the groups were clearer. Again, the more the person liked the product the more likely she/he purchased the product more. There were more likers in light buyers (53%) than in non-buyers (15%) but less than in heavy buyers (76%). There were more dislikers in non-buyers (19%) than in buyers (1-4%).
Purchase intention
Purchase intention was also strongly related to purchase frequency (Table 3). The ratings of buyers remained the same in both conditions while for non-buyers the ratings decreased significantly from expectation to perception [interaction of purchase frequency groups x evaluation condition: F(2,399)=25.46; p<0.001]. Buyers had higher purchase intention than non-buyers [main effect of purchase frequency groups F(2,399)=72.92; p<0.001]. Purchase intention was generally higher in expectation than perception [main effect of purchase frequency groups F(1,399)=19.81; p<0.001].
Based on the expectation, the proportion of intenders was higher in buyers (78-84%) than in non-buyers (63%). Furthermore, non-non-buyers had more hesitants (29%) than non-buyers (12-13%) but there was no difference in non-intenders (4-8%).
Based on the perception, light buyers had more intenders (70%) than non-buyers (29%) but less than heavy buyers (86%). Non-buyers had more non-intenders (43%) than buyers (4-10%). Brand relationship and willingness to eat again
Figure 2 shows there was significant difference between purchase frequency groups in brand relationship; the higher the brand relationship score is the more likely the person purchases the product more frequently [main effect of purchase frequency groups F(2,399)=9.89; p<0.001]. Figure 3 shows there was significant difference between purchase frequency groups in willingness to eat again; the more the person was willingness to eat the product again the more likely she/he purchased the product more frequently.
3.2 Implicit measurements of buyers and non-buyers
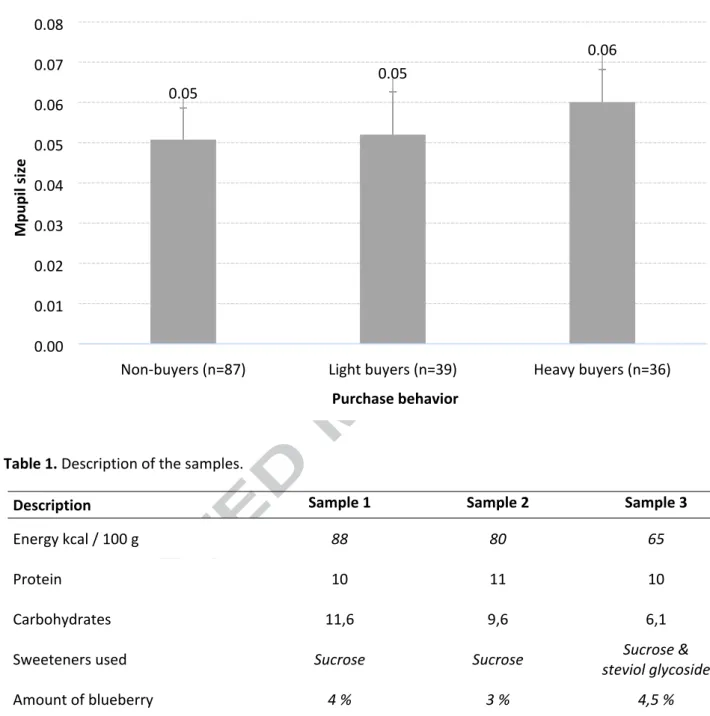
Significantly higher ERP-based product approach bias scores (scalar composite scores derived from the full electrode array used) (Figure 4 a) were observed for those who purchased the product most [main effect of purchase frequency groups F(2,159)=3.84; p=0.023]. The same trend was observed in approach-avoidance response time differences and in pupil size responses, but not significantly ([F(2,159) = 2.16; p=0.118], [F(2,159) = 0.26, p=0.768], respectively).
3.3 Prediction of purchases with explicit and implicit measurements
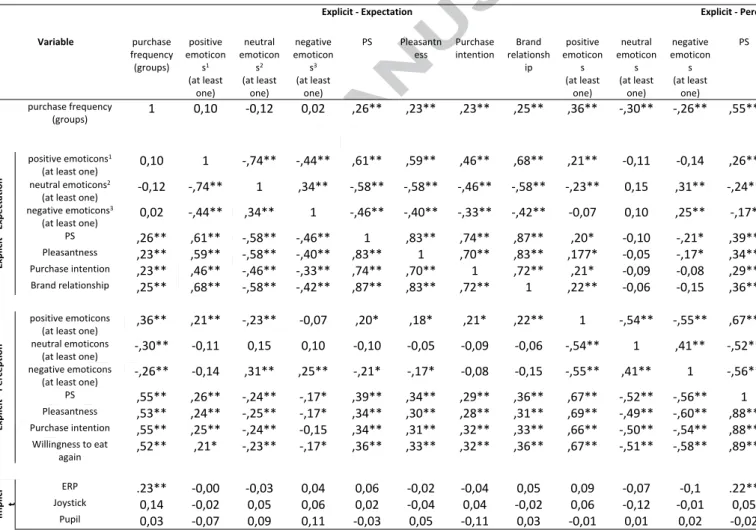
Correlations between purchase frequency and explicit and implicit measurements are presented in Table 4. From explicit measurements PS, purchase intention and pleasantness in perception evaluation condition correlate the strongest with purchase frequency (r = 0.53 - 0.55, mean r = 0.54). However, all these three measurements correlate strongly with each other (r = 0.86 - 0.88, mean r = 0.87). From implicit measurements ERP-based product approach bias correlates the strongest with purchase frequency (r=0.23). Therefore, the highest correlation within all measurements with purchase frequency is in PS in perception evaluation condition (r = 0.55). Results of the multivariate linear regression analyses (Table 5) confirm the importance of pleasantness and purchase intention in the perception condition for the prediction of purchase frequencies. In addition, brand relationship scores and positive emoji scores in the expectation condition are included in the best-fitting 5-predictor model. Surprisingly, implicit joystick scores
contribute significantly to the best-fitting multiple regression model and play an important role in the 17-predictor model in spite of their modest bivariate correlation with purchase frequency.
4. Discussion
The main findings of the study were that:
1. Explicit measurements distinguished the purchase frequency groups better after perception than after expectation
2. PS, purchase intention and pleasantness correlated the strongest with purchase frequency but also correlated strongly with each other in bivariate comparisons
3. Of the implicit measurements, ERP-based product approach bias has the strongest relationship with purchase frequency in bivariate comparisons
4. Explicit measurements turned out to be more accurate predictors of purchase frequencies than implicit measurements in bivariate comparisons
5. Multiple regression models largely confirm these observations, with the exception of the relevance of implicit joystick scores: these contribute prominently to the prediction of purchase frequencies in the best fitting 5-predictor model but do not stand out in bivariate comparisons
4.1 Role of sensory perception in purchase frequency prediction
Results of this study show that explicit consumer scores for the three quarks were accurate predictors of subsequent purchases. Furthermore, predictions made after respondents had tasted the product were most reliable, although mere visual exposure to product packages was sufficient for lower, yet significantly positive correlations between predictors and purchase behavior. This appears to suggest that a holistic product experience, i.e. visual exposure to the packages and oral-sensory exposure to the products, adds value to the prediction of purchase frequency. This finding is slightly surprising, considering that these commercially available products were evaluated by regular users of the product category. It shows that even for familiar products expectations based on brand and package were adjusted after consumption, and actual purchase behavior was most in line with these adjusted expectations. It should be noted that these results still leave the possibility open that purchase behavior had been predicted better by explicit scores in the expectation phase, had respondents never tasted the products. Tasting the products may simply have convinced respondents to reconsider their expectations, in spite of their familiarity with the product category. That the probability of product purchase by regular product consumers is affected by tasting was confirmed earlier by Kytö, Virtanen & Mustonen
(2019) who showed the importance of tasting experience in the accuracy of predicting future purchases. In addition, people appear to be unable to predict how repeated consumption of products may alter their product preferences. When asked to make such predictions for ice creams and yoghurts, panelists were in the blind regarding the directions their preferences would go (Kahneman & Snell, 1992). Although sensory perception significantly improves the prediction accuracy, it alone is not enough, as shown by Kytö, Järveläinen & Mustonen (2018) in their study on the role of blind tasting in the prediction of future purchases. Especially the emojis measuring emotional responses improved as a purchase predictor due to product tasting. Jaeger et al. (2017b) have shown that food names can elicit different emotional profiles rated using emojis. This study, however, showed that the tasting experience changed the emotions that were evoked by the brand and package of the product. These findings suggest the emotional experiences after getting the actual sensory perception are more accurate than those awaken by only the image of the sensory quality of the food product.
4.2 Mutual comparison of the explicit measurements in purchase frequency prediction
The present study shows that for the three quarks tested, consumers are very capable of forecasting their own purchase behavior by means of various explicit measures. Their product purchase frequencies correlated positively with the Promoter Score (PS) ratings they generated after mere visual product evaluations (expectation condition), and even higher with PS scores generated after products had been tasted (perception condition). This finding is in line with Reichheld (2003), who proved that high NPS (Net Promoter Score) usually coincides with high sales and company growth. Furthermore, PS correlated strongly with brand relationship, which confirms the suggestion by Reichheld (2003) that NPS predominantly measures loyalty towards a certain brand and/or company. Furthermore, as expected on basis of previous work, future purchase frequency correlated highly with “purchase intention” (Kytö et al, 2019; Warshaw, 1980; and Wells, 1961) and “preference scores” (Mustonen, Hissa, Miettinen & Tuorila, 2007). The latter underscores the strong link between future food choice and hedonic ratings. In line with these positive correlations between explicit measures and purchase frequencies, group averages of amounts of products purchased increased significantly with purchase intention scores.
PS, preference and purchase intention do not tend to change much in the course of a single evaluation session. Instead, willingness-to-eat-again scores are expected to be shorter-lived because of the direct dependency on metabolic satiation for the food eaten. Nonetheless, short-lived willingness-to-eat-again scores produced similar high correlations with purchase frequencies as observed for other explicit scores, both before and after tasting the products. This appears to suggest that short-lived willingness-to-eat-again scores reflect long-lived product impressions. Nevertheless, others (Mela, 2001; Ratner, Kahn & Kahneman, 1999) have suggested that long-lived liking scores and short-lived wanting scores reflect distinct dimensions in the context of food choice. For instance, Ratner, Kahn & Kahneman (1999) and Mustonen et al. (2007) showed that people do not always want to choose the most preferred product. For the sake of variety, they choose also less-preferred options. These choices are more related to motivational approach bias in that specific moment than generic product liking. Although momentary willingness-to-eat-again ratings and longitudinal preference ratings constitute different drivers of product choice, this study showed that liking and motivational approach bias were equally linked to future purchase frequency.
This study showed that neutral and negative emotions correlated negatively with purchase frequency suggesting that, for a product to be purchased, it has to evoke at least some positive emotions: emotionally neutral responses are bad for sales.
4.3 Implicit measures as predictors of purchase frequency
Group-averaged implicit measures - i.e. approach tendency scores based on EEG, joystick reaction times and pupil dilations - were lowest for products not bought and highest for products bought most (3 times or more). Of these, only EEG-based implicit scores differed significantly between purchase-frequency categories. Correlations between implicit measures and product purchase frequencies confirm this: positive correlations were significant and highest for the EEG measures and not significant for joystick responses and pupil dilation responses. Although all three implicit measures show the same positive incremental relation with purchase frequencies, observed correlations are weaker than those observed for explicit measures.
Response latencies in approach-avoidance tasks have been used to assess approach tendencies toward a number of items wanted, liked or feared: alcohol (Klein, Becker, & Rinck, 2011) , food (Field et al., 2011; Kemps et al., 2013; Piqueras-Fiszman et al., 2014; Wegman et al., 2018) ,
spiders (Klein, Becker, & Rinck, 2011), faces (Radke, Roelofs, & de Bruijn, 2013) and social settings (Ernst, 2013). As a method, it has shown its use as an accessible method for the quantification of automated approach tendencies. In the present study, its predictive power was exceeded by EEG approach bias scores when considering bivariate correlations with purchase frequencies. Although the collection of ERP measures is technologically and analytically challenging compared to joystick response times, its more reliable prediction of purchase behavior can still be understood when dissecting the stimulus-response chains for both measures. After visual exposure to each product, EEG measures reflect the earliest neural responses indicative of approach tendency that occur 200-350ms after stimulus presentation. In contrast, joystick responses occur more than a second later, following a response cue shown after the product image. In addition, the joystick response is collected as a result of the successful execution of a motor response by the hand, which is not the case for EEG. All of these intermediate information processing steps are expected to introduce additional random variation to the response of interest: product-specific modulations of response latencies. In this light, the prominent role of implicit joystick responses in the prediction of purchase frequencies by multiple linear regression modelling is remarkable. This suggests that, although the overall contribution of joystick response data to purchase frequency variation is moderate, its predictive contribution is unique and relevant.
Pupil size is known to reflect the amount of task-related information processing (Laeng, Sirois, & Gredebäck, 2012; Murphy, Robertson, Balsters, & O'Connell, 2011). Clear positive going pupil size deflections observed one second after stimulus presentation are in line with this. However, no stimulus specific pupil size effect was observed. Then again, pupil size is more a measure of valence-unspecific arousal than of positive valenced concepts, such as appetitive motivation or pleasure. Although pupil response differences were similar to approach tendencies for the three products, these were far from significant.
4.4 Explicit vs. implicit measurements in predicting purchase frequency
In the present study, both explicit and implicit measures predicted future purchase behavior well. As such, the EEG measure stood out as implicit predictor of product choice in bivariate comparison with purchase frequencies. In addition, joystick responses that only mildly correlate with product choice results are one of three significant predictors in the best-fitting 5-predictor
multivariate regression model. For the present comparison between dairy snack alternatives, explicit measures predict purchase behavior well, but implicit measures add a moderate, yet unique understanding of the variation in purchase behavior.
There were no reasons to expect that explicit measures would be biased. Since products compared in this study were similar in nearly all respects (availability, composition, familiarity, health promoting claims), there was no apparent factor that could have biased subjects towards withholding their true product impressions in favor of more socially desirable response alternatives. It is known, however, that consumer responses become less reliable estimators of purchase behavior once sub-sets of response alternatives become more socially desirable (Fischer, 1993; King & Bruner, 2000). In those cases, implicit measures are expected to gain predictive reliability compared to the more biased explicit measures. A dedicated investigation is needed to assess the relation between the social desirability of response alternatives and the merits of implicit measures over explicit measures. Furthermore, if the products would have been totally novel and unfamiliar to the respondents, the results may have been different.
4.5 Method limitations and opportunities for future research
Conducting a long-lasting experiment is challenging. Also, in the present study, the requirement to participate in many study phases caused data loss due to drop-outs. Additionally, not all participants could participate in implicit measurements because of strict exclusion criteria for electrophysiological tests and the requirement to test subjects one-by-one. Therefore, of the 134 respondents that completed explicit tests and kept purchase diaries, only 50 also fully completed the implicit measurements. To assure that comparisons between explicit and implicit measurements are made within-subject, correlation analyses were performed on those 50 respondents only, with the risk of reducing reliability of explicit measurements. Nonetheless, results of an additional analysis of explicit measurements for all 134 subjects were nearly identical to the results for the subset of 50 subjects. Also, demographically, those 50 respondents represented the complete respondents’ group well.
Purchase behavior of the respondents may have been influenced by study design, because asking for purchase intentions alone may affect purchase behavior (Morwitz & Fitzsimons, 2004). Respondents were exposed to the studied products multiple times, especially those who also participated in implicit measurements. Although the studied products had all been commercially
available for a long period of time, the possibility cannot be excluded that exposure to the products may have affected consumer attitudes towards these products and their evaluations as well as purchase behavior. However, in the follow-up (diary) phase, the respondents kept diary for all of their quark purchases during that one month, not only those that were in the focus in this study. To support that, the very large and comprehensive list/catalog was given to make the diary keeping easier to the respondents. Therefore, the exposure to the studied products might have dispelled a bit.
Many of the explicit measurements correlated very strongly with each other. This might be caused by respondents’ willingness to be consistent with their hedonic responses. This suggests that more investigation is needed to measure merely one hedonic explicit measurement at a time to see which one of the measurements is the most accurate predictor.
In this study, emotions were measured using only visual stimuli, emojis. Dalenberg et al. (2014) showed that non-verbal emotion meter (PrEmo®) predict product choice more accurately than only verbally described emotion meter. In addition, Vidal et al. (2016) showed how consumers are using emoticon and emojis in tweets when expressing food-related emotions. However, using emoticons is still explicit way to measure emotion and might be the reason why these measurements did not bring any added value to the prediction of purchase behavior.
In this study, purchase behavior was measured with a one-month diary. Since the resulting purchase frequencies equaled zero for a substantial amount of product x subject combinations, purchase data does not represent a very solid reference for purchase occasions. Purchase data could have profited from a longer purchase monitoring period. Unfortunately, this was not possible.
5. Conclusion
Overall, the study demonstrated that explicit measurements, especially PS, purchase intention and pleasantness measured after branded tasting, are accurate measures to predict purchase behavior. However, these three measurements were correlating strongly with each other so based on this study none of these are better than the other. Implicit measures, especially the approach tendency measure derived from EEG, predicted future purchase behavior accurately, albeit less reliably than some explicit measures. Approach tendencies obtained by joystick response latencies predict aspects of purchase behavior not explained by other predictors. In the absence of social desirability of product choices, implicit consumer measures are not better alternative than regular explicit measures at least when the products studied were commercially available, familiar products, but they add unique understanding of purchase behavior of these types of products. It is expected that implicit consumer measures will predict purchase behavior even better in studies of products with variable social acceptance scores.
Acknowledgements
This study was funded by a Finnish dairy company Valio Ltd. J.H.F.B., R.R., J.W. and E.A. were supported by the European Regional Development Fund and the Dutch Provinces Gelderland and Overijssel (Grant 2011-017004). J.W. was also supported by a Food, Cognition and Behavior grant of the Netherlands Organization for Scientific Research (NWO, grant 057-14-001). E.A. was supported by a VENI grant of NWO (016.135.023).
References
Aharon, I., Etcoff, N., Ariely, D., Chabris, C. F., O'Connor, E., & Breitner, H. C. (2001). Beautiful faces have variable reward value: fMRI and behavioural evidence. Neuron, 32(3), 537-551. Armstrong, J. S., Morwitz, V. G., & Kumar, V. (2000). Sales forecasts for existing consumer products and services: Do purchase intentions contribute to accuracy? International Journal of Forecasting, 16, 383–397.
Bender, G., Veldhuizen, M. G., Meltzer, J. A., Gitelman, D. R., & Small, D. M. (2009). Neural correlates of evaluative compared with passive tasting. European Journal of Neuroscience, 30(2), 327-338.
Brennan, M., & Esslemont, D. (1994). The Accuracy of the Juster Scale for Predicting Purchase Rates of Branded, Fast-Moving Consumer Goods. Marketing Bulletin, 5, 47–52, Research Note 1 Canetti, L., Bachar, E., & Berry, E. M. (2002). Food and emotion. Behavioural Processes, 60, 157– 164.
Carlson, J. M., Foti, D., Mujica-Parodi, L. R., Harmon-Jones, E., & Hajcak, G. (2011). Ventral striatal and medial prefrontal BOLD activation is correlated with reward-related electrocortical activity: a combined ERP and fMRI study. Neuroimage, 57, 1608-1616.
Cloutier, J., Heatherton, T. F., Whalen, P. J., & Kelley, W. M. (2008). Are attractive people rewarding? Sex differences in the neural substrates of facial attractiveness. Journal of Cognitive Neuroscience, 20(6), 942-951.
David, S. P., Munafò, M. R., Johansen-Berg, H., Smith, S. M., Rogers, R. D., Matthews, P. M., & Walton, R. T. (2005). Ventral striatum/nucleus accumbens activation to smoking-related pictorial cues in smokers and nonsmokers: a functional magnetic resonance imaging study. Biological Psychiatry, 58(6), 488-494.
Delgado, J. M. R., Roberts, W. W., & Miller, N. E. (1954). Learning motivated by electrical stimulation of the brain. American Journal of Physiology - Legacy Content, 179(3), 587-593. Delorme, A. Makeig, S (2004). EEGLAB: an open source toolbox for analysis of single-trial EEG dynamics including independent component analysis. Journal of Neuroscience Methods, 134, 9-21.
Demattè, M. L., Sanabria, D., & Spence, C. (2007). Olfactory–tactile compatibility effects demonstrated using a variation of the Implicit Association Test. Acta Psychologica, 124(3), 332-343.
Ernst, L. H. (2013). Approaching the Negative is not Avoiding the Positive: FNIRS, ERP and fMRI Studies on the Approach-Avoidance Task. (PhD), Eberhard Karls Universität Tübingen, Tübingen. Field, M., Caren, R., Fernie, G., & de Houwer, J. (2011). Alcohol approach tendencies in heavy drinkers: Comparison of effects in a relevant stimulus-response compatibility task and an approach/avoidance Simon task. Psychology of Addictive Behaviors, 25(4), 697-701.
Fischer, R. J. (1993). Social desirability bias and the validity of indirect questioning. Journal of Consumer Research, 20(2), 303-315.
Gardner, M. P., Wansink, B., Kim, J., & Park, S.-B. (2014). Better moods for better eating?: How mood influences food choice. Journal of Consumer Psychology, 24(3), 320-335.
Gastaut, H. R., Naquet, R., Vigouroux, R., & Corriol, J. (1952). Provocation de comportements emotionnels divers par stimulation rhinencephalique chez le chat avec electrodes a demeure. Revue Neurologique, 86, 319-327.
Grabenhorst, F., Schulte, F. P., Maderwald, S., & Brand, M. (2013). Food labels promote healthy choices by a decision bias in the amygdala. Neuroimage, 74, 152-163.
Heuer, K., Rinck, M., & Becker, E. S. (2007). Avoidance of emotional facial expressions in social anxiety: The Approach-Avoidance Task. Behaviour Research and Therapy, 45, 2990-3001.
Hofmann, W., & Friese, M. (2008). Impulses got the better of me: alcohol moderates the influence of implicit attitudes toward food cues on eating behavior. Journal of Abnormal Psychology, 117(2), 420.
Jaeger, S. R., Lee, S. M., Kim, K.-O., Chheang, S. L., Jin, D., & Ares, G. (2017a). Measurements of product emotions using emoji surveys: Case studies with tasted foods and beverages. Food Quality and Preference, 62, 46–59.
Jaeger, S. R., Vidal, L., Kam, K., & Ares, G. (2017b). Can emoji be used as a direct method to measure emotional associations to food names? Preliminary investigations with consumers in USA and China. Food Quality and Preference, 56, 38–48.
Jaeger, S. R., Xia, Y., Lee, P.-Y., Hunter, D. C., Beresford, M. K., & Ares, G. (2018). Emoji questionnaires can be used with a range of population segments: Findings relating to age, gender and frequency of emoji/emoticon use. Food Quality and Preference, 68, 397–410.
Kahneman, D. & Snell, J. (1992). Predicting a changing taste: Do people know what they will like? Journal of Behavioral Decision Making, 5, 187-200.
Katner, S. N., & Weiss, F. (1999). Ethanol-associated olfactory stimuli reinstate ethanol-seeking behavior after extinction and modify extracellular dopamine levels in the nucleus accumbens. Alcoholism, Clinical and Experimental Research, 23(11), 1751-1760.
Kemps, E., Tiggemann, M., Martin, R., & Elliott, M. (2013). Implicit approach-avoidance associations for craved food cues. Journal of Experimental Psychology: Applied, 19(1), 30-38.
King, M. F., & Bruner, G. C. (2000). Social desirability bias: A neglected aspect of validity testing. Psychology & Marketing, 17(2), 79-103.
Klein, A. M., Becker, E. S., & Rinck, M. (2011). Approach and avoidance tendencies in spider fearful children: The approach-avoidance task. Journal of Child and Family Studies, 20(2), 224-231.
Knutson, B., Adams, C. M., Fong, G. W., & Hommer, D. (2001). Anticipation of increasing monetary reward selectively recruits nucleus accumbens. The Journal of Neuroscience, 21, 1-5. Knutson, B., Fong, G. W., Adams, C. M., Varner, J. L., & Hommer, D. (2001). Dissociation of reward anticipation and outcome with event-related fMRI. Neuroreport, 12(17), 3683-3687.
Knutson, B., Rick, S., Wimmer, G. E., Prelec, D., & Loewenstein, G. (2007). Neural predictors of purchases. Neuron, 53, 147-156.
Kytö, E., Virtanen, M., & Mustonen, S. (2019). From intention to action: predicting purchase behavior with consumers’ product expectations and perceptions, and their individual properties. Food Quality and Preference, 75, 1–9.
Kytö, E., Järveläinen, A., & Mustonen, S. (2018). Hedonic and emotional responses after blind tasting are poor predictors of purchase behavior. Food Quality and Preference, 70, 49–56. Lawrence, N. S., Hinton, E. C., Parkinson, J. A., & Lawrence, A. D. (2012). Nucleus accumbens response to food cues predicts subsequent snack consumption in women and increased body mass index in those with reduced self-control. Neuroimage, 63(1), 415-422.
Laeng, B., Sirois, S., & Gredebäck, G. (2012). Pupillometry: a window to the preconscious? Perspectives on Psychological Science, 7(1), 18-27.
Mela, D. J. (2001). Determinants of food choice: Relationships with obesity and weight control. Obesity Research, 9, 249S–255S.
Murphy, P. R., Robertson, I. H., Balsters, J. H., & O'Connell, R. G. (2011). Pupillometry and P3 index the locus coeruleus–noradrenergic arousal function in humans. Psychophysiology, 1-12. doi:10.1111/j.1469-8986.2011.01226.x
Mustonen, S., Hissa, I., Miettinen, S-M. & Tuorila, H. (2007). Hedonic responses as predictors of food choice: flexibility and self-prediction. Appetit,e 49, 159-168.
Newberry, C. R., Klemz, B. R., & Boshoff, C. (2003). Managerial implications of predicting purchase behavior from purchase intentions: a retail patronage case study. Journal of Services Marketing, 17, 609–20.
O'Doherty, J. P., Deichmann, R., Critchley, H. D., & Dolan, R. J. (2002). Neural responses during anticipation of a primary taste reward. Neuron, 33, 815-826.
Olds, M. E., & Olds, J. (1963). Approach-avoidance analysis of rat diencephalon. Journal of Comparative Neurology, 120(2).
Oliver, G., Wardle, J., & Gibson, E. L. (2000). Stress and food choice: a laboratory study. Psychosomatic Medicine, 62(6), 853-865.
Otis, N., & Pelletier, L. G. (2008). Women’s regulation styles for eating behaviors and outcomes: The mediating role of approach and avoidance food planning. Motivation and Emotion, 32(1), 55-67.
Piqueras-Fiszman, B., Kraus, A. A., & Spence, C. (2014). "Yummy" versus "Yucky"! Explicit and implicit aproach-avoidance motivations towards appealing and disgusting foods. Appetite, 78, 193-202.
Radke, S., Roelofs, K., & de Bruijn, E. R. A. (2013). Acting on anger: social anxiety modulates approach-avoidance tendencies after oxytocin administration. Psychological Science, 24(8), 1573-1578.
Ratner, R., Kahn, B. & Kahneman, D. (1999). Choosing less-preferred experiences for the sake of variety. Journal of Consumer Research, 26(1), 1-15.
Reichheld, F.F. (2003). The one number you need to grow. Harvard Business Review, 81(12), 46-55.
Renner, B., Sproesser, G., Strohbach, S., & Schupp, H. T. (2012). Why we eat what we eat. The Eating Motivation Survey (TEMS). Appetite, 59, 117-128.
Rothemund, Y., Preuschhof, C., Bohner, G., Bauknecht, H.-C., Klingebiel, R., Flor, H., & Klapp, B. F. (2007). Differential activation of the dorsal striatum by high-calorie visual food stimuli in obese individuals. Neuroimage, 37, 410-421.
Satterthwaite, T. D., Green, L., Myerson, J., Parker, J., Ramaratnam, M., & Buckner, R. L. (2007). Dissociable but inter-related systems of cognitive control and reward during decision making: Evidence from pupillometry and event-related fMRI. Neuroimage, 37, 1017-1031.
Seibt, B., Häfner, M., & Deutsch, R. (2007). Prepared to eat: How immediate affective and motivational responses to food cues are influenced by food deprivation. European Journal of Social Psychology, 37(2), 359-379.
Solarz, A. K. (1960). Latency of instrumental responses as a function of compatibility with the meaning of eliciting verbal signs. Journal of Experimental Psychology, 59(4), 239-245.
Tuorila, H., Lähteenmäki, L., Pohjalainen, L., & Lotti, L. (2001). Food neophobia among the Finns and related responses to familiar and unfamiliar foods. Food Quality and Preference, 12, 29–37.
Vidal, L., Ares, G., & Jaeger, S. R. (2016). Use of emoticon and emoji in tweets for food-related emotional expression. Food Quality and Preference, 49, 119–128.
Warshaw, P. R. (1980). Predicting purchase and other behaviors from general and contextually specific intentions. Journal of Marketing Research, 17, 26−33.
Wegman, J., Ketel, E., van Loon, I., van Bochove, M. E., Schutter, D., Smeets, P. A. M., . . . Aarts, E. (2015). Neural responses to subjective and objective properties of food during a reward motivation task. Paper presented at the Society for Neuroscience, annual meeting, Chicago, IL. Wegman, J., van Loon, I., Smeets, P.A.M., Cools, R., Aarts, E. (2018). Top-down expectation effects of food labels on motivation. NeuroImage, 173, 13-24.
33
Figure legends
Figure 1. Outline of the study.
Figure 2. Mean (+SEM) brand relationship between non-buyers (0 purchases), light buyers (1-3 purchases) and heavy buyers (>3 purchases). Significant difference (p < 0.05) in the mean values between the buyer groups were tested with a two-way ANOVA and marked with different letters (a, b).
Figure 3. Distribution of willingness to eat again ratings of non-buyers (0 purchases), light buyers (1-3 purchases) and heavy buyers (>3 purchases).
Figure 4. Mean (+SEM) implicit measurements (a) ERP, b) joystick, c) pupil sizes) between non-buyers (0 purchases), light non-buyers (1-3 purchases) and heavy non-buyers (>3 purchases). Significant difference (p < 0.05) in the mean values between the buyer groups were tested with repeated measures ANOVA and marked with different letters (a, b).
Figure 1. Outline of the study.
ONLINE SURVEY, N=258
(RECRUITMENT AND EXPECTATION RESPONSES)
Informed consent Demographics
Brand loyalty and purchase personality Familiarity and usage frequency
*Ratings of emotions, recommendation, pleasantness, purchase intention and brand relationship
*Expectation based on brand & package image on screen
TASTING SESSION IN CLT, N=134 (PERCEPTION RESPONSES)
**Ratings of emotions, recommendation, pleasantness, purchase intention and willingness to eat again
*** products bought were chosen from a comprehensive list
Figure 2. Mean (+SEM) brand relationship between non-buyers (0 purchases), light buyers (1-3 purchases) and heavy buyers (>3 purchases). Significant difference (p < 0.05) in the mean values between the buyer groups were tested with a two-way ANOVA and marked with different letters (a, b).
DIARY, N=134 (ONLINE)
Self-reported purchasing behavior***
IMPLICIT MEASUREMENTS, N=56
EEG AAT Pupil response
56.0 b
64.2 a 69.0 a
Non-buyers (n=226) Light buyers (n=83) Heavy buyers (n=93) 0 20 40 60 80 100 Purchase behavior Bran d re lati onsh ip (1 -1 00)
Figure 3. Distribution of willingness to eat again ratings of non-buyers (0 purchases), light buyers (1-3 purchases) and heavy buyers (>3 purchases).
10 1 1 39 10 2 37 42 24 14 47 73 0 0 0 1 1 1 Non-buyers (n=226) Light buyers (n=83) Heavy buyers (n=93)
I definitely would not eat again I hardly eat again
I could eat again I definitely would eat again
Figure 4. Mean (+SEM) implicit measurements (a) ERP, b) joystick, c) pupil sizes) between non-buyers (0 purchases), light buyers (1-3 purchases) and heavy buyers (>3 purchases). Significant difference
(p < 0.05) in the mean values between the buyer groups were tested with repeated measures ANOVA and marked with different letters (a, b).
0.24b
0.33ab
0.40a
Non-buyers (n=87) Light buyers (n=39) Heavy buyers (n=36)
0.00 0.10 0.20 0.30 0.40 0.50 Purchase behavior Mer p
b)
25.4 26.6
35.7
Non-buyers (n=87) Light buyers (n=39) Heavy buyers (n=36)
0.0 5.0 10.0 15.0 20.0 25.0 30.0 35.0 40.0 45.0 Purchase behavior Mjoyst ick
c)
0.05 0.05
0.06
Non-buyers (n=87) Light buyers (n=39) Heavy buyers (n=36) 0.00 0.01 0.02 0.03 0.04 0.05 0.06 0.07 0.08 Purchase behavior Mpu pi l size
Table 1. Description of the samples.
Description Sample 1 Sample 2 Sample 3
Energy kcal / 100 g 88 80 65
Protein 10 11 10
Carbohydrates 11,6 9,6 6,1
Sweeteners used Sucrose Sucrose steviol glycosideSucrose &
Amount of blueberry 4 % 3 % 4,5 %
Sensory quality1
Light color 13% 52% 52%
Lot of berries / berry bites 62% 0% 0%
Mild blueberry flavor 28% 58% 48%
Mildly sour 43% 50% 37%
Thick 29% 66% 75%
Soft 72% 56% 44%
1 Check-all-that-apply (CATA) evaluation by the explicit measurement respondent (N=134)
Table 2. Description of the study population.
Explicit Implicit No. of participants n=134 n=50 (male+female, %) (41+59) (44+56) Age (years) mean 37 37 range 18-63 23-50 Stage of life (%)1 Adults* 63 62 With child/ren* 35 36 Other 2 2 Work situation (%)2 Student 13 14 Employee* 76 74 Unemployed * 11 12 Brand loyalty Brand loyalty 0 0
Favoring the brand 82 90
Price conscious 4 2 Variety seekers 13 8 I don’t know 1 0 Purchase personality Price conscious 70 66 Quality conscious 66 74 Practical 49 46 Reasonable 40 38 Experience oriented 37 40 Spontaneous 33 32 Organized 32 32 Offer hunter 30 30 Environmentally mindful 23 28 Social 23 16