Using Pattern-of-Life as Contextual Information
for Anomaly-Based Intrusion Detection Systems
FRANCISCO J. APARICIO-NAVARRO 1,
KONSTANTINOS G. KYRIAKOPOULOS2,3, (Member, IEEE),
YU GONG2, (Member, IEEE), DAVID J. PARISH2, (Member, IEEE),
AND JONATHON A. CHAMBERS1, (Fellow, IEEE)
1School of Electrical and Electronic Engineering, Newcastle University, Newcastle upon Tyne NE1 7RU, U.K.
2Wolfson School of Mechanical, Electrical and Manufacturing Engineering, Loughborough University, Loughborough LE11 3TU, U.K. 3Institute for Digital Technologies, Loughborough University London, London E20 3BS, U.K.
Corresponding author: Francisco J. Aparicio-Navarro ([email protected])
This work was supported in part by the Engineering and Physical Sciences Research Council under Grant EP/K014307/2 and in part by the MOD University Defence Research Collaboration in Signal Processing.
ABSTRACT As the complexity of cyber-attacks keeps increasing, new robust detection mechanisms need
to be developed. The next generation of Intrusion Detection Systems (IDSs) should be able to adapt their detection characteristics based not only on the measureable network traffic, but also on the available high-level information related to the protected network. To this end, we make use of the Pattern-of-Life (PoL) of a computer network as the main source of high-level information. We propose two novel approaches that make use of a Fuzzy Cognitive Map (FCM) to incorporate the PoL into the detection process. There are four main aims of the work. First, to evaluate the efficiency of the proposed approaches in identifying the presence of attacks. Second, to identify which of the proposed approaches to integrate an FCM into the IDS framework produces the best results. Third, to identify which of the metrics used in the design of the FCM produces the best detection results. Fourth, to evidence the improved detection performance that contextual information can offer in IDSs. The results that we present verify that the proposed approaches improve the effectiveness of our IDS by reducing the total number of false alarms; providing almost perfect detection rate (i.e., 99.76%) and only 6.33% false positive rate, depending on the particular metric combination.
INDEX TERMS Basic probability assignment, contextual information, Dempster-Shafer theory, Fuzzy
cognitive maps, intrusion detection systems, network security, pattern-of-life, port scanning attack. I. INTRODUCTION
Cyber-security has increasing importance to Internet users. Providing strong and reliable security mechanisms has become vital in all areas of society. The implementation of Intrusion Detection Systems (IDSs) is fundamental in secu-rity infrastructures in order to provide extra level of assur-ance, identifying evidence of attacks or intrusion attempts. As the complexity of these attacks keeps increasing, new and more robust detection mechanisms need to be developed.
As we previously discussed in [1] and [2], the next genera-tion of IDSs should be designed to include reasoning engines supported by modules that could assess the quality of the analysed datasets [3], manage contextual and non-contextual information about the network, handle uncertainty or deal with incongruent decisions between different IDSs. In order to accommodate all these functionalities, the architecture
of advanced IDSs would be noticeably different from the design of more conventional IDSs. The design of the domain anomaly detection system presented in [4] can be considered as a reference model.
Current IDSs use measurable network traffic informa-tion from the protected system or signatures of already known cyber-attacks during the intrusion detection process. However, these systems do not generally take into account available high-level information (i.e. above the network operation) regarding the protected system [5]. Ideally, the available high-level information (i.e. contextual informa-tion, situational awareness and cognitive informainforma-tion, per-taining to the experts’ judgment on the network behaviour) should be incorporated within the intrusion detection process. IDSs should be able to adapt their detection character-istics based not only on the measureable network traffic
information, but also on the context in which these systems operate, and the information provided by the network users or administrators.
In the experiments that we previously presented in [2], we made use of the Pattern-of-Life (PoL) of the network usage as the main source of high-level information. In particular, we correlated the number of network users with the time of the day and the usage of the network resources to characterise the PoL of the network usage and to generate useful contextual information. The results that we presented in [2] evidenced that this available high-level information can be used to improve efficiency of an IDS. In order to incorporate the PoL into the detection process, a Fuzzy Cognitive Map (FCM) [6] can be used in conjunction with an anomaly-based IDS. The FCM is used to fine-tune the techniques used by the anomaly-based IDS to assign evidence of attack. The use of contextual information enhances the generation of a reference of normal network traffic behaviour, making the detection of malicious data more accurate, thereby improving the detection results.
Nonetheless, the work in [2] left a number of areas open for research, which are addressed in this paper. One of these open areas is to identify and evaluate how and at which stage of the data fusion process, augmenting the contextual information is most beneficial. Another open area is the selection of the metric used to represent the PoL of the network usage in the design of the FCM. In our prior work, we made use of the throughput in the construction of the FCM design [2]. However, we did not explore the use of alternative metrics in the design of the FCM, or assess how the use of these metrics may affect the detection accuracy. Therefore, in this work, we extend the analysis of our previously proposed approach for using FCMs to augment the detection process by adding contextual information.
Our contribution can be summarised as follows:
First, we propose two novel approaches that employ an FCM to incorporate the contextual information from the PoL into the detection process. These two approaches exploit the alternative stages at which this information can be added to the detection process. The first approach is based on the use of the output of the FCM to construct an additional metric to be fused by Dempster-Shafer (D-S) Theory of Evidence [7], and the second approach is based on the adjustment of the values resulting from the D-S data fusion process. The performance of these two approaches is evaluated and compared against the framework previously proposed in [2], which is based on the adjustment of certain values involved in the data fusion process, as well as the performance of the D-S based IDS without the use of the FCM. Additional description of the proposed approaches is presented in Section IV.
Second, we have designed three different FCMs by using three different metrics that characterise the PoL of the network traffic. These metrics are Throughput (THR), the number of transmitted bytes per second; Communication Rate (COM), the number of frames transmitted per second; and Destination Port Distribution (DPD), the number of unique destination ports per second. The metric Source Port
Distribution (SPD), the number of unique source ports per second, was also extracted from the analysed dataset and used by the IDS during the detection process. However, since the metrics DPD and SPD have very similar profiles, the FCM construction based on SPD is not presented in this work. Further details about these metrics will be presented in Section VII.C.
Third, we have significantly extended the results initially presented in prior work [2]. We have evaluated and compared the performance of our proposed approaches using the differ-ent FCM designs. These results provide substantial insight about the behaviour of the IDS when the contextual infor-mation is taken into account. Similarly, we have presented extensive analysis of the presented results.
Finally, the method implemented to construct the FCM extracts high-level information from the network users, with a process that is completely transparent to them. In detail, we have correlated the number of researchers present in the monitored offices with the time of the day and the usage of the network resources. Additionally, the network administrator may also contribute to the FCM design by providing prior knowledge about the expected usage of the network resources. This knowledge is provided in the form of different thresholds for each of the metrics, which represent the expected usage of the network resources at a particular time of the day.
The main aims of the experiments that we present in this work are summarised as follows:
• To demonstrate the improved detection performance of our IDS using an FCM to include contextual information from the PoL of the network usage into the detection process.
• To identify which of the proposed approaches to inte-grate the FCM into the D-S based IDS framework pro-duces the best results.
• To indicate which of the network metrics used to design the different FCMs produce the best detection results. • To evaluate the efficiency of the proposed IDS in
identi-fying the presence of probing attacks, and reducing the number of false alarms.
The remainder of the paper is organised as follows. In Section II, the most relevant previous work is reviewed. An explanation of the detection methodology used by our IDS is presented in Section III. The proposed use of an FCM within an IDS is introduced in Section IV. In Section V, a description of the FCM is provided. The process of charac-terising and designing the PoL with an FCM is presented in Section VI. The network testbed, the implemented attacks, and the evaluated dataset are described in Section VII. Section VIII describes the results and provides an analy-sis of the different findings. Finally, conclusions are given in Section IX.
II. RELATED WORK
With the increasing complexity of cyber-attacks, the next generation of IDSs need to detect network attacks, not only by using measurable information from the network, but also
by integrating human cognition and contextual information into the detection process to improve their effectiveness.
According to [8], contextual information could be defined as any information that surrounds a situation of interest, which helps to understand and to characterise the situation. Snidaro et al. [8] present an extensive and very detailed survey about current research on context-based information fusion systems. This work explains that data fusion systems that use contextual information to improve the quality of the fused output have gained importance in the last few years. It also emphasises that contextual information should be an important asset at any level of modern fusion systems.
In [9], the authors proposed an IDS that relies on contextual information to classify the alerts as relevant or irrelevant. The alerts generated by the IDS are processed along with high-level information about hosts present in the network and known vulnerabilities to generate a relevance score about the alerts. Then, a threshold is used to classify alerts as relevant or irrelevant according to the relevance score. Their results demonstrate the effectiveness of using contextual information in the detection process to increase the efficiency of the IDSs. Xuet al.[10] present a context-sensitive detection system based on the use of Hidden Markov Models (HMMs). The host-based system models the system call sequences of a program to detect anomalous patterns. This work uses the caller function of each library or system call as context. The HMM technique can compute the likelihood of occurrences of the observed call sequences. However, this is achieved after a training process using only normal program traces.
An ontology is another technique used to provide con-textual information to intelligent systems. Ontologies have proven to be powerful tools to specify and structure knowl-edge, or to provide formal specification of different enti-ties in a system and their relationships. For instance, Sadighianet al.[5] propose a security approach based on the use of ontologies to add context information into a process that fuses the outcome of heterogeneous distributed IDSs. By using this high-level information, the authors reduce the false positive alerts.
A technique that also provides the capability of integrating contextual information from the network user to the detection process is the FCM. FCMs have been previously described and used in [6], [11], and [12] to model human knowledge. Stylios and Groumpos [6] provide a detailed description of the FCM and its mathematical foundation. Although the work presented in [12] does not focus on network security, it com-prehensively describes the FCM concept with clear exam-ples. Similarly, Ndousse and Okuda [11] provide a detailed description of an FCM and examples that use an FCM to model fault propagation in interconnected systems.
The work presented in [13] focuses on developing an actionable model of situation awareness for army infantry platoon leaders that could replicate human cognition using FCMs. Their FCM design is based on a goals submap, a tree-like diagram that structures the goals and subgoals of the platoon, and the relationships between these goals.
One of the characteristics of the FCM presented in [13] is that the people responsible for designing the FCM do not provide weight values to the concepts, but rank the importance of each modelled concept. A similar approach is presented in [14], in which situation awareness is represented using an FCM. Also, the authors of [14] use ontologies to replicate situations.
In [15], the authors compare the roles of an FCM and another graphical knowledge representation technique, namely a Bayesian belief network, from the perspective of knowledge engineering and representation. This work also describes a knowledge acquisition system that systematically acquires design knowledge from multiple experts from which the FCM is constructed. The authors of [16] highlight the time consuming issues related to the manual construction of large FCMs. In order to solve these issues, the authors present a framework to semi-automate the construction of FCMs, extracting information from a database and other sources of information.
In [17], the authors use an FCM to model causal knowledge within network data. Based on this knowledge, their system calculates the severity/relevance of the modelled network data to attacks. This approach would allow their IDS to discard irrelevant events and focus only on important ones. However, in contrast to the approach that we propose, this research does not use an FCM to modify parameters in the detection process, but as an events filtering process prior to the actual detection.
III. INTRUSION DETECTION METHODOLOGY
The methodology that we present in this work builds upon the design of an unsupervised anomaly-based IDS that we previ-ously presented in [18]. This IDS is based on the combined use of multiple metrics from multiple layers of the network stack to carry out the detection. It uses D-S [7] as a data fusion technique, and is able to detect different types of cyber-attacks in real-time. The goal is to create an overall belief on whether there is an attack in the network traffic.
As many researchers have previously shown [19], [20], the combined use of multiple metrics from the same or dif-ferent network stack layers may result in higher Detection Rate (DR) with lower numbers of false alarms for an IDS. Each metric provides different levels of evidence about the real nature of the network traffic. Hence, the higher the number of metrics used, the greater the chances to identify the presence of attack.
A. DEMPSTER-SHAFER THEORY OF EVIDENCE
D-S is a data fusion technique that combines evidence of information from multiple and heterogeneous events in order to calculate the belief of occurrence of another event. D-S theory starts by defining a frame of discernment 2 = {θ1, θ2, . . . , θn}, which is the finite set of all possible mutually exclusive outcomes of a particular problem domain. With regards to this work, we want to identify whether the analysed network traffic is malicious or non-malicious. Therefore, the frame of discernment is comprised of
A=AttackandN =Normal. Assuming2has two outcomes {A, N}, the possible hypotheses are {A, N,{A|N}, Ø},22. In the case of {A|N}, this subset corresponds toUncertainty (eitherAorN). In addition, Ø is the empty set. Each hypoth-esis is assigned a belief value within the range [0, 1], also known as a Basic Probability Assignment (BPA), through the mass probability function m, which expresses the evidence attributed directly to the hypothesis. This is:
m:22→[0,1] if m(∅)=0 m(H)≥0, ∀H⊆2 X H⊆2 m(H)=1 (1)
Then, D-S uses Dempster’s rule of combination to calcu-late the orthogonal summation of the belief values from two different sensors or observers, and fuses this information into a single belief. This rule is defined in (2), wherem1(H) and
m2(H) are the beliefs in the hypothesis H, from observers
1 and 2, respectively. Similarly, X ∩Y = H refers to all combinations of evidence which yieldH; whereasX∩Y =Ø refers to the mutually exclusive subsets of the hypothesisH, thus their intersection is the empty set.
m(H)= P X∩Y=Hm1(X)∗m2(Y) 1−P X∩Y=∅m1(X)∗m2(Y) ∀H 6=Ø (2) Dempster’s rule allows the combination of evidence from two observers at a time. In order to combine evidence from more observers, Dempster’s rule can be used in consecutive iterations. The output of the initial combination process is used as input evidence in the next iteration, along with the evidence of information from a third observer. Dempster’s rule satisfices the associative property, thus the order in which the belief values are fused does not affect the final combined belief values. To better understand how Dempster’s rule of combination is implemented, the reader is referred to the practical example presented in our previous work [18].
B. AUTOMATIC BPA METHODOLOGY
There exist multiple ways of assigning BPA values to each of the hypotheses in D-S theory, ranging from data mining techniques to empirical approaches. However, few of them could be used without a prior thorough training or a fine tuning period. In [18], we proposed a novel BPA methodology able to automatically adapt the assignment of its evidence to the current characteristics of the network traffic, without intervention from an IDS administrator.
The proposed BPA methodology exploits a Sliding Window (SW) scheme to compute statistical parameters from the data, used to generate the different BPA values. Our system has one SW for each metric used in the detection process. Although each SW is independent from each other, each metric is extracted from a common piece of information (i.e. the same network frame). All the statistical parameters are computed from the content of the whole SW. However, only the last metric measurement to enter the SW is analysed
at a time. The SW slides one slot at a time only if the final decision indicates that the analysed data are normal. Otherwise, the SW does not slide and the data identified as malicious are discarded.
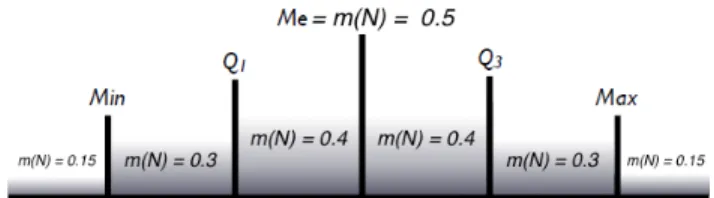
The main benefit of using this scheme is that the SW pro-vides a countermeasure against attackers trying to skew the statistical parameters within the SW. However, the efficiency of this methodology requires a period of non-malicious traffic when the initial SW is filled. Only if the majority of the data within the initial SW are non-malicious can the effective operation of the IDS be expected. This scheme also cre-ates situations in which the computed statistical parameters change substantially as different metrics are fused when the variability of the analysed data is high. In addition, the length of the SW will generally affect the final detection results. The analysis of the optimum SW length has been previously inves-tigated in [21] and it is beyond the scope of this work. In the experiments conducted for this work, the SW length has been empirically set to 50 slots, based on previous experience. This SW length has previously been found to be an appropriate length for our IDS to provide accurate detection results [21]. The BPA methodology that we proposed in [18] uses three independent statistical approaches to provide the BPA values for each analysed metric. The approach that assigns BPA values to the hypothesis Normaluses the distribution of the network traffic within the SW. The BPA in Normal indicates how strong the belief is that the current analysed data are non-malicious. The content of the SW is divided in sections using the median (Me) and the first and third quartiles (Q1and Q3). Then, the parametersMaxandMinare
computed using Inter Quartile Range (IQR):
IQR=Q3−Q1 (3)
Min=Q1−1.5×IQR (4)
Max =Q3+1.5×IQR (5)
A particular BPA value is empirically assigned to each of the portions of the SW as is represented in Fig. 1. The more distributed the data are within each of the portions of the SW, the wider the portion. The analysed data receive the BPA assigned to the portion that it falls in.
FIGURE 1. BPA Scale for Belief inNormalBased on the Distribution of Data.
The approach that assigns BPA values to the hypothesis Attackuses the Euclidean distance from a defined reference of normality (i.e. the mean of information within the SW). The BPA inAttackindicates how strong the belief is that the current analysed data are malicious. The Euclidean distance
from the mean to the most distant value in the SW is defined as the Maximum Distance (Dmax), which defines the upper
limit for the BPA value. Next, the distance from the mean to the currently analysed data (D) is also calculated. This is represented in Fig. 2. Finally, the BPA inAttackis assigned according to equation (6).
m(A)= |D| ∗0.5
|Dmax| (6)
FIGURE 2. BPA scale for belief inAttackbased on the distance.
Lastly, the BPA in the hypothesisUncertaintyis assigned based on the belief values assigned inNormalandAttackin the current SW, as described in (7).
m(N|A)= min(m(N) ,m(A))
max(m(N) ,m(A)) (7) The BPA inUncertaintyindicates how doubtful the system is regarding whether the current analysed data are malicious or non-malicious. The numerator is the smallest of the two hypotheses, whereas the denominator is the largest one.
C. FINAL DECISION ASSESSMENT
Once the BPA values have been assigned, it is required that all the three conditions in (1) are assured. However, it is unlikely that the summation of the belief values assigned by the three previously described approaches add to 1. In order to guarantee that the third condition in (1) is assured, we compute an adjustment factorϕ, as described in (8), that will be subtracted from each of the three BPA values, where Z is the number of different hypotheses initially considered within 22.
ϕ =
PZ
x=1m(x)−1
Z (8)
Then, the BPA values assigned by all the observers are adjusted and fused. The outcome of the D-S theory is a com-plete set of BPA values (i.e. one for each hypothesis initially considered). The analysed information is classified according to the hypothesis with the highest BPA, which is considered to be the correct decision. There may be cases in which both m(N) andm(A) receive the same final BPA values, or in which the belief inUncertaintyis larger than the other hypotheses. In the former case, the hypothesisNormalis considered to be the correct decision, whereas in the latter case, the hypothesis with the highest BPA betweenNormalandAttackis selected.
IV. PROPOSED USE OF AN FCM WITHIN AN IDS
This section describes the approaches that we propose by which an FCM could be integrated within our unsupervised
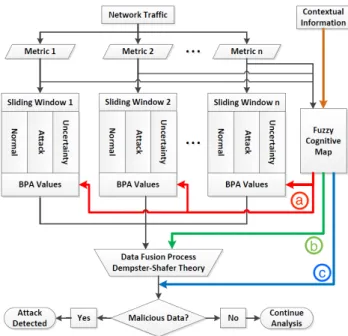
anomaly-based IDS. These approaches are all based on the generation or modification of the BPA values used in a D-S formulation as described in Section III, by using the out-come of the FCM. Fig. 3 shows the schematic representation of the structure of the IDS, including the extraction of the different metrics, the automatic generation of the BPA values and the data fusion process. Additionally, the figure also indicates the different stages in the IDS detection process at which each of the proposed approaches adds the contribution of the FCM.
A. BPA ADJUSTMENT USING THE FCM PRIOR TO DATA FUSION
The first approach represented by the channel (a) in Fig. 3 to incorporate contextual information was initially proposed and evaluated in [2]. It is based on the adjustment of the BPA values assigned prior to the data fusion process, by using the outcome of the FCM. Once the BPA values have been computed as explained in Section III.B, the outcome of the FCM is used to adjust these accordingly. This is done by adding the outcome of the FCM tom(N) andm(A). Then,m(U) is calculated using the newly computed values of m(N) andm(A). Finally, the BPAs are adjusted as described in (8).
FIGURE 3. Schematic structure of the IDS, including the extraction of the metrics, the generation of the BPAs, the data fusion process and the addition of contextual information into the detection process by using an FCM.
After all the BPA values have been adjusted, the data fusion process is carried out using Dempster’s rule defined in (2) and the final decision is taken as described in Section III.C. It is worth noting that, although the same weight values are used to adjust all of the considered metrics, it is unlikely for these metrics to have the same BPA value. Therefore, the adjustments would impact each of the metrics differently.
B. USING THE FCM AS ADDITIONAL BPA VALUES
The first of the two novel approaches that we propose to incorporate contextual information into the detection process is based on the use of the output of an FCM to construct an additional metric to be fused by D-S. This is represented by the green channel (b) in Fig. 3. We propose to use the outcome of the FCM to assign belief values to the hypotheses NormalandAbnormal, to yield an extra set of BPAs to be fused. These values are then used to infer the BPA in the hypothesisUncertainty. Once these three values have been computed, the newly generated BPAs are merged with D-S, along with the rest of the considered network traffic metrics, using Dempster’s rule defined in (2). For clarification, the BPA values computed from the network traffic, as described in Section III, remain unchanged.
It is worth noting that for this approach, in contrast to the one that adjusts the BPAs prior to the fusion process, the contextual information might have less influence over the final IDS decision, as its contribution is reduced to one set of BPAs to be fused. In Section VIII, we will discuss in further detail the contribution of each of the approaches to the final results.
C. BPA ADJUSTMENT AFTER DATA FUSION PROCESS
The second approach that we propose is also based on the adjustment of the BPA values. This is represented by the blue channel (c) in Fig. 3. However, in contrast to the approach in the red channel (a) that adjusts the BPA values prior to the fusion process, the outcome of the FCM will be used to adjust the resulting BPAs, after the D-S data fusion process.
The IDS carries out the detection process using solely the measurable information as described in Section III. The dif-ferent metrics are extracted from the network traffic and the diverse BPA values are computed. Then, all the BPA values are fused using Dempster’s rule defined in (2). Only after the data fusion process has ended, the contextual information is used to adjust the resulting BPA values, by adding the outcome of the FCM. The adjustment is implemented over the final outcome of the IDS, hence the addition of the outcome of the FCM is prone to dominate the entire detection decision.
V. FUZZY COGNITIVE MAP
An FCM is a technique used for prediction and decision mak-ing, which can be applied to model human knowledge, and to represent the behaviour of a system as perceived by human experts. The main goal of modelling a decision problem using an FCM is to predict the outcome of the evaluated problem by letting the relevant events interact, and to calculate the actual degree of influence that one event may have upon the system [6].
A. MOTIVATION
An FCM is an efficient soft computing tool that sup-ports adaptive behaviour in complex and dynamic systems, and provides significant support for decision-makers [22].
We have made use of an FCM to model the PoL because this technique provides a number of advantages when compared against several probabilistic algorithms, (e.g. dealing with contradictory or conflicting pieces of information [22]).
An FCM provides a useful framework to calculate the degree of influence that one event or action may have upon the whole system or upon parts of the system. Also, an FCM is able to represent dynamic systems that evolve over time, supporting dynamic timeline structures [22], and to model new and unseen behaviours of particular scenarios.
Another characteristic is that an FCM provides the poten-tial to make changes easily and intuitively, and allows addi-tional pieces of information to be combined at a later time instance. Moreover, it supports memberships of more than one set of events and allows the overlapping of different FCM models [23]. Another important characteristic of this technique is that the fuzzy degrees of influence in an FCM are initially assigned using qualitative linguistic variables instead of hard numerical values. This makes an FCM an excel-lent solution for agile Command and Control (CC) and/or Human-Machine Interaction (HMI).
One of the most important characteristics of the FCM is its capability to combine multiple, incomplete, contradictory or conflicting pieces of information. An FCM handles con-flicting or competing information better than probabilistic systems, which are regulated by the additivity rule. Prob-abilistic systems have difficulties managing situations that occur when competing statements are both true [22]. Also, according to [22], this type of system does not often handle all forms of uncertainty well, especially when information is conflicting. As part of the design of an FCM, it is not necessary that all human experts involved in the process agree on which events should compose the FCM or what weight value should be given to each link.
The use of an FCM in this work is motivated by all the advantages that this technique provides. Nonetheless, an FCM is not exempt from drawbacks. The design of an FCM relies not only upon the human’s understanding of the work domain and knowledge, but also their ignorance, prejudice, or bias [22]. Also, the design of an FCM is very context-specific, and may not be easily generalised. In order for the model to be applied to other situations, a new FCM design should be constructed. Additionally, as will be briefly described next in Section V.B, the convergence of the fixed-point attractor is an open issue in the research community [24].
B. FCM DESIGN DESCRIPTION
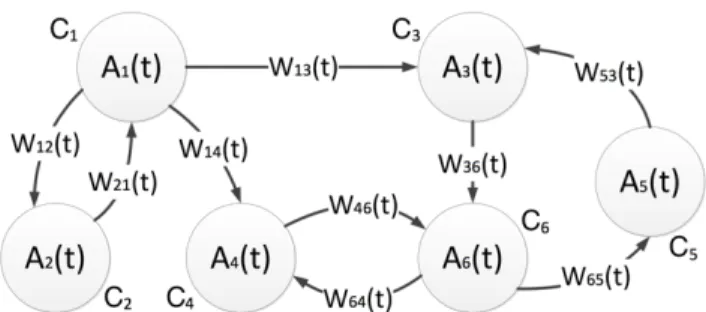
The graphical design of FCMs is characterised by a set of nodes interconnected by causal connections. An example of an FCM model is presented in Fig. 4. The nodes in the FCM represent causal and time-varying concepts, events, actions or goals that describe the behaviour of the system. The definition of the main concepts relevant to the sys-tem is the initial step in the process of creating the FCM. In our experiments, the nodes have been defined based on the
FIGURE 4. Simple FCM model in which nodes represent changes in the modelled system and connections denote relationships between concepts.
events that characterise the PoL of the network and concepts that represent prior knowledge of the network administrator. A very detailed description of the design of FCM models can be found in [6].
Each node C carries a weight A(t) in the fuzzy range [0, 1], which indicates the quantitative measure of the importance that each concept has in the system, at time t. The connections between nodes represent the causal relationship between the defined concepts. Each link is assigned a weight value wij(t) in the fuzzy interval [−1, 1], which indicates the
relationship and degree of influence from the nodes Cito Cj.
There are three possible relationships between concepts: 1) Positive relationship wij > 0, indicates that
Aj(t) increases as Ai(t) also increases.
2) Negative relationship wij < 0, indicates that
Aj(t) increases as Ai(t) decreases.
3) No relationship wij = 0, indicates that there is no
correlation between Aj(t) and Ai(t).
The fuzzy degrees of influence wij(t) are initially assigned
using qualitative linguistic variables by the network users or administrator, as described in [12], but then transformed into numerical values. In our experiments, the fuzzy degrees are assigned by the network administrator. We consider five linguistic variables, {very low,low,medium,high, andvery high}. In order to transform the variables to numerical degree of influence values, the five linguistic variables are sorted in an ascendant order of importance and represented by {µvl, µl, µm, µh, µvh}. These variables are transformed to the numerical values wij(t) associated with each link using (9),
as explained in [15], wherenis the total number of variables, andpis the ordinal number that represents the position of the respective linguistic variable in the list. In our experiments, in whichn=5, the weights assigned to the variables {µvl,µl, µm,µh,µvh} would be {0.1, 0.3, 0.5, 0.7, 0.9}, respectively.
µp=p
n − 1
2n (9)
An FCM can be represented by an [m×m] matrix M, where [M(t)]ij= |wij(t)|which is also known as an adjacency
matrix, andmis the number of nodes in the modelled FCM. The matrix M describes the relationship between the nodes and the weight values wij(t) associated with each link.
An FCM allows different adjacency matrices to be combined in an adjacency matrix M as follows:
[M]ij= 1 k k X m=1 wij(t) m ∀i,j (10) wherek is the number of adjacency matrices to be merged (i.e. number of network users in the monitored network) and mis the number of nodes (i.e. concepts) in the modelled FCM. As an example, Fig. 5 comprises the [6×6] adjacency matrix of the FCM in Fig. 4.
FIGURE 5. Simple [6×6] adjacency matrix of the FCM represented in Fig. 4.
The initial weight value A(t) of all the nodes in a model at time t=0 can be represented by the initial vector state A, where A(0)=(A1(0), A2(0), . . . , Am(0)). Ai(0) is the weight
value of node i at time t=0. Then, the FCMs evolve via an iterative process in which, at each future time step, the weight value of each concept A(t) is computed by aggregating the influence of the interconnected concepts, using an activation functionf. The value of Ai(t) changes at each iteration as
described in (11): Ai(t+1)=f (K)=f Ai(t)+ m X j=1j6=i wji(t)∗Aj(t) (11) where Ai(t+1) is the weight value of node Ci at time t+1,
Aj(t) is the weight value of node Cjat time t, and wji(t) is the
degree of influence of node Cjon node Ci.
Bueno and Salmeron [25] describe four activation func-tions f; these are the sigmoid, hyperbolic tangent, linear threshold, and step functions. Among the four, the hyperbolic tangent activation function, described in (12), is the one used in our experiments. This is because the hyperbolic tangent activation function produces weight values Ai(t) normalised
in the range [−1, 1]. Hence, this activation function complies to one of the requirements of the D-S theory, which requires that the BPA values assigned to each hypothesis could be any value up to 1.
f (K)= e
K−e−K
eK+e−K (12) This process continues for a number of iterations until the FCM reaches one final fixed model, known as a hid-den pattern or fixed-point attractor. This is when the weight
values A(t) in all the nodes do not change in successive iterations. It is also possible that an FCM keeps cycling between several fixed models, known as a limit cycle, or it may continue generating different models indefinitely. Nápoleset al.[24] indicate that in non-stable FCMs, a stop-ping criterion can be set to overcome the convergence prob-lem of these last two situations. In our experiments, we have empirically set the stopping criterion at t=60. However, the authors also highlight that this approach may be unreliable due to the lack of convergence.
The problem of the fixed model convergence in non-stable FCMs has been previously investigated by other researchers [24], [26]. Nápoleset al.[24] describe that non-stable FCMs are mostly related with antisymmetric adjacency matrices, which lead the system to a periodic behaviour. Another factor is the used activation functionf. Continuous functions such as sigmoid and hyperbolic tangent can result in chaotic behaviours since the FCM could produce infinite different states [24], [26]. Also, according to [26], a small change in the initial vector state A can drastically change the fixed model convergence. Hence, it is clear that the develop-ment of more efficient strategies to improve the fixed model convergence of FCM is still required [24], but this is beyond the scope of this work.
VI. FUZZY COGNITIVE MAP CONSTRUCTION
A. CHARACTERISING THE PATTEN-OF-LIFE
In this work, we have made use of the PoL of the net-work usage as the main source of contextual information. Moreover, the network administrator has also contributed to the design of the FCM by providing its knowledge in the form of expected network usage levels. The concept of PoL refers to the information generated by observing repeated behaviours over an extended period of time. Accord-ing to Craddock et al.[27], PoL analysis typically involves the surveillance of a group of people over a period of time to characterise their behaviours and habits, and determine if their behaviour is suspicious.
Generally, the PoL of the network usage is directly asso-ciated with the number of users accessing the Internet. In order to characterise the PoL of the network usage and to generate useful contextual information, we have correlated the number of researchers present in the mon-itored offices in the Wolfson School at Loughborough University, UK, with the time of the day and the usage of the network resources. These are the three parameters used to characterise the PoL of the network usage and to extract the contextual information.
Additionally, the design process of the FCM for this work is also based on three predefined assumptions, which help to represent the PoL in the design of the FCM:
• An increase in the network usage is expected to be seen during common office hours (i.e. from 9am to 5pm, weekdays) when most of the network users are expected to use the network, and a decrease outside this timeframe.
• Legitimate high network usage outside common office hours is also feasible because University staff have unrestricted access to their labs at any time of the day.
• Lastly, it is expected to see an illegitimate increase in the network usage during the implementation of the evaluated attack/threat, which could occur at any time of the day.
B. DESIGN OF THE FCM USING THE PATTEN-OF-LIFE
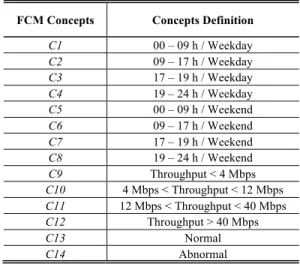
In order to characterise the time of the day in the PoL, four timeframes per day have been defined. These are 00-09h, 09-17h, 17-19h, and 19-24h, distinguishing between week-days and weekends. As can be seen in Table 1, these time-frames have been used to define eight of the concepts that compose the modelled FCM (i.e. C1−8). These timeframes
have been defined after monitoring, for an extended period, the time when the researchers are more frequently present in the monitored offices. This pattern can change for multiple reasons (e.g. bank holidays or festive periods). Therefore, a more comprehensive methodology to characterise the time of the day in the FCM, which could seamlessly adapt to any pattern change, could be developed in future work.
TABLE 1.List of concepts that compose the FCM, building upon the throughput of the network traffic.
Similarly, in order to characterise the network usage in the design of the FCM, we require a number of metrics that could represent the amount of network resources utilised, such as the throughput of the network traffic. From the gathered network traffic dataset, four different metrics have been identified as the most appropriate metrics. These are THR, the number of transmitted bytes per second; COM, the number of frames transmitted per second; SPD, the number of unique source ports per second; and DPD, the number of unique destination ports per second. Further details about these metrics will be presented in Section VII.C.
Since the network traffic would present variable levels of usage depending on the PoL (i.e. the cycles of the PoL), the
network administrator used each of these metrics to define a number of thresholds based on its prior knowledge. These thresholds represent the maximum expected network usage at given time of the day, according to the network administrator. Therefore, each of these thresholds allows the system to characterise the PoL of the network usage. For instance, if we consider the metric THR to design the FCM, the thresh-olds 4 Mbps, 12 Mbps, and 40 Mbps have been defined by the network administrator to characterise the PoL of the network usage. These thresholds are used, in turn, to define four additional concepts (i.e. C9−12) in the FCM design.
As another example, if the metric DPD was considered to design the FCM, the network administrator defined the thresholds 100 and 250 for unique destination ports per second to characterise the PoL.
Although any of the available metrics can be used in the construction of the FCM to characterise the network usage, we decided to utilise only one of the metrics at a time to reduce the complexity of the FCM. The use of fixed thresh-olds may not provide a flexible framework that captures the stochastic nature of the network traffic. Therefore, in future work, alternative methodologies to dynamically characterise the PoL of the network usage in the FCM could be also proposed.
Finally, two additional concepts are defined as the two possible outcomes of the FCM (i.e. C13 = Normal and
C14 = Abnormal). The weights A(t) associated with these
two concepts are used to incorporate the contextual infor-mation extracted from the PoL into the detection process of our IDS.
The next step in the design process of the FCM is to define the relationships between concepts and the positive or negative influence. In our experiments, the FCM concepts defining the time of the day have direct influence upon the number of network users in the monitored research office and, in turn, upon the concepts defining the usage of the network resources. Thus, the concepts C1−8present positive
relationship over C9−12. Similarly, the FCM concepts
defin-ing the usage of the network resources (i.e. C9−12) have direct
influence upon the possible outcomes of the FCM. Then, the concepts C9−12 also present positive relationship over the
concepts C13−14. Finally, the two possible FCM outcomes
cannot occur at the same time. Hence, the concepts C13and
C14present negative relationship with each other.
One adjacency matrix is defined for each network user, considering the time of the day and the usage of the network resources. Then, all the adjacency matrices are averaged out and merged in an adjacency matrix M, as described in (10). Following upon the concepts described in Table 1, in which the throughput is used to characterise the PoL of the network usage, the final [14×14] adjacency matrix M would be as shown in Fig. 6. The weight values in Fig. 6 are the average values resulting after the different adjacency matrices, one for each network user, are merged as described in (10).
For instance, the weight value w19=0.9 represents a very
high positive relationship from C1to C9. In other words, this
FIGURE 6. Merged [14×14] adjacency matrix of the FCM composed using the number of network users, time of the day and the throughput.
weight value indicates that it is very likely to measure from the network traffic a THR lower than 4 Mbps on weekdays, between midnight and 9 am. Similarly, the weight value w1014 = 0.3 represents a low positive relationship from
C10to C14. This weight value indicates that THR
measure-ment between 4 and 12 Mbps is unlikely to correspond to an attack.
In order to understand how the BPAs are adjusted using the outcome of the FCM, consider the concepts listed in Table 1 and the adjacency matrix M shown in Fig. 6. Consider the situation in which the network traffic is evaluated at 12 pm on a weekday (C2), and the throughput reaches
10 Mbps (C10). In this situation the initial state vector would
be defined as A(0)=[0, 1, 0, 0, 0, 0, 0, 0, 0, 1, 0, 0, 0, 0]. As we previously described in Section V.B, we have empiri-cally set the stopping criterion at t=60. The resulting state vector is A(60)=[0, 0.155, 0, 0, 0, 0, 0, 0, 0.379, 0.672, 0.639, 0.581, 0.907, 0.782]. Once the process has ended, the weights associated with both concepts C13, A13(60) =
0.907, and C14, A14(60) = 0.782, are used to adjust the
BPA values assigned to the D-S hypotheses, or to construct the new additional metric to be fused by D-S.
VII. TESTBED AND NETWORK TRAFFIC MEASUREMENTS
A. TESTBED LAN
One drawback associated with publicly available datasets is that the underlying network usage dynamics are not described in detail and high-level information such as PoL becomes very difficult to derive. The KDD99 dataset [28] is arguably the most frequently used publicly available network traffic dataset in the area of network security. Nevertheless, this dataset does not include precise timestamps nor the source address of the network traffic [29]. This makes the extraction of contextual information from the network traffic almost impossible.
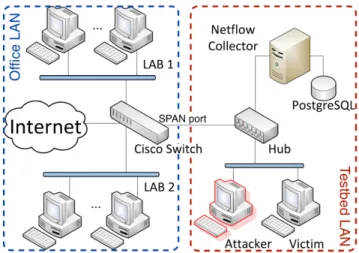
The analysed data traffic, previously described in [2], has been gathered from a Local Area Network (LAN) testbed in a research office environment, in the Wolfson School at Loughborough University. The PCs in two distinct labs are connected to the same office LAN, and these PCs are used by
researchers daily for Internet access. One Cisco switch aggre-gates the traffic from all the PCs in the office LAN, which is used as background traffic. In addition, two additional PCs have been connected through to a testbed LAN in order to implement both the attack and the detection process. Fig. 7 shows the logical topology of the testbed LAN.
FIGURE 7. Logical topology of the testbed LAN; PCs on the left generate the background traffic, whereas those on the right are involved in the port scanning attacks implementation, and detection process.
B. EVALUATED NETWORK SCENARIO
In this paper, we use the technique port scanning to evaluate the performance of our proposed approaches. Port scanning, also known as probing, is used by network administrators to discover possible vulnerabilities in the network through the probing of open ports. However, port scanning is also used by attackers to discover active services that may have vulnerabilities that could be exploited [30]. The real threat of port scanning resides in the fact that this technique often precedes the execution of multi-stage attacks and more elab-orate intrusion attempts [30]. Hence, similar to KDD99 [28] in which probing is one of the main attack categories, we consider port scanning as a test case scenario to be detected. Port scanning has been researched for years. Christopher [31] describes different modes of port scanning attacks. One of the most common methodologies to identify port scanning is based on monitoring if there is an increase in the number of network connections in a short period of time that exceeds a predefined threshold. Another common methodology is based on monitoring the number of different destination ports per source IP address within a given period of time. However, both methodologies require predefined thresholds to be able to detect the port scanning attack.
To carry out the port scanning attacks we have used the network mapper Nmap GUI, Zenmap [32]. Nmap is a pop-ular open source tool that provides a variety of probing techniques for network exploitation and security auditing. Nmap and Zenmap allow the implementation of different modes or profiles of the port scanning attack (e.g. intensive, quick, or slow comprehensive scan). Each of these modes of
attack will manifest itself differently in the network as the intensity of the attack varies from one another. Throughout the experiments, we have implemented a number of these different modes.
As we will explain when presenting the results, the fact that we have combined different profiles of the attack makes the detection process challenging. The intensive scan profiles standout from the normal traffic and are easily differentiable, whereas the stealth scan profile is not clearly distinguishable from the normal traffic. This may cause a large number of misclassifications during the detection process.
C. NETWORK TRAFFIC MEASUREMENTS
All the network traffic from the testbed and office LANs has been gathered by the victim using the network packets analyser Tcpdump [33] in pcap format. In total, 160 GBytes of network traffic has been gathered during the 9 days that the experiment lasted. This traffic dataset comprises 99.4% of non-malicious traffic (i.e. 696638 instances) and 0.6% of malicious traffic (i.e. 4220 instances). The small proportion of malicious traffic in the dataset makes the detection pro-cess even more challenging. The dataset is available from https://figshare.com/s/4bd0fe2dab7e09ce61dc.
Multiple parameters were extracted from the network dataset, and aggregated in a per second manner (e.g. bytes per packet, source and destination IP address, and source and destination port). These parameters have been used to compute the four metrics introduced in Section VI.B that we use to carry out the intrusion detection of the port scan-ning attacks (i.e. COM, THR, DPD, and SPD). The metrics COM and THR are represented in Figs. 8-9. The figures present cyclic patterns in the metric measurements, which correspond to the PoL and the time of the day when the network is being utilised by more users. The section in blue corresponds to the non-malicious traffic, whereas the section in red corresponds to the traces of port scanning attacks. Fig. 8 includes extra annotations to help identify the cycles of the PoL and the traces of port scanning attacks. Additionally, a zoomed in representation of the day 1 of the THR is shown in Fig. 10.
As we can see in Figs. 8-10, there are some attack instances that standout from the normal traffic, and are easily dif-ferentiable by using a simple signature or threshold. These instances coincide with the implementation of the intensive scan profile of the port scanning attack. In contrast, when the port scanning attack is implemented in a stealthy manner, the attack is not clearly distinguishable from the normal traffic. This will arguably cause a higher number of misclassifica-tions during the detection process. A more detailed descrip-tion of the dataset is presented in [2].
VIII. RESULTS AND ANALYSIS
A. PERFORMANCE METRICS
This section describes the detection results, and compares the results generated by our anomaly-based IDS with and
FIGURE 8. COM - Communication Rate (number of transmitted frames per second) collected over 9 days.
FIGURE 9. THR - Throughput (bytes per second) collected over 9 days.
FIGURE 10. THR - Throughput gathered over 1 day, showing a zoomed in representation of the normal traffic and malicious traffic, as well as the PoL.
without the use of an FCM. There are three main purposes of these results. First, to evaluate the efficiency of the proposed approaches in identifying the presence of attacks, and reduc-ing the number of false alarms generated by our IDS. Second, to identify which of the proposed approaches produces the best detection results. Third, to corroborate the improved detection performance of our IDS using an FCM.
The effectiveness of the IDS has been evaluated using the following performance metrics, which provide evidence of how effective the IDSs are at making correct detections:
TABLE 2.Index of the combination of metrics.
TABLE 3.List of FCM approaches compared in the results.
• Detection Rate (DR) - Proportion of anomalies correctly classified as anomalous among all the anomalous data: DR=TP/(FN+TP)
• False Positive Rate (FPr) - Proportion of non-malicious data misclassified as anomalous among all the data: FPr=FP/(TP+FP+TN+FN)
• Overall Success Rate (OSR) - Proportion of all the data correctly classified among all the data: OSR=(TN+TP)/(TP+FP+TN+FN)
where TP represents anomalies classified as malicious; TN represents normal instances classified as normal; FP represents normal instances misclassified as attack; and FN represents anomalies misclassified as normal.
The network traffic dataset has been analysed for all the possible combinations of metrics. The Y-axis of the graphs represents the results in percentage, whereas the X-axis of the graphs represents the index of the used metrics. Each index corresponds to one possible combination of metrics, with #1 being a single metric set and #15 the set that combines all the considered metrics. Therefore, the best results overall are to be expected from the set index #15. The indexes of all the possible combinations of metrics are presented in Table 2.
Figs. 11-13 present the respective results in four graphs in each combination of metrics; one for each proposed approach. Despite the values being discrete, the line style has been used for clarity in the presentation of the results. These graphs correspond to the channels shown in Fig. 3. In these experiments, the metric used to construct the FCM was the THR; using the values in the matrix M pre-sented in Fig. 6.
B. EVALUATION OF PROPOSED APPROACHES
The results of the proposed approaches are compared against the framework that we previously proposed in [2] and the per-formance of the IDS without the use of FCM (i.e.No FCM). Table 3 lists the different approaches that have been compared in this section.
FIGURE 11. DR comparison: Three approaches that use an FCM (designed based on the THR) in conjunction with IDS, and the IDS without an FCM.
FIGURE 12. FPr comparison: Three approaches that use an FCM (designed based on the THR) in conjunction with IDS, and the IDS without an FCM.
FIGURE 13. OSR comparison: Three approaches that use an FCM (designed based on the THR) in conjunction with IDS, and the IDS without an FCM.
1) DETECTION RATE RESULTS
The DR results of the IDS are compared in Fig. 11. As we can see, with regards to the DR, there is no evident difference between all the proposed approaches, using similar combi-nation of metrics. It is worth noting that the approach that
adjusts the BPA values prior to the fusion process using the FCM (i.e.FCM01) produces the highest DR in most cases. However, the maximum difference with the rest of DR results is only∼2%. One undesirable phenomenon that is shown in Fig. 11 is that the DR decreases as the number of fused metrics increases, which is in contrast to what is expected from cross-layer IDSs. In our experiments, this phenomenon is caused by the automatic BPA methodology and the way the SW slides. When multiple metrics are used, the reference of normality in the BPA methodology becomes wider over time. Hence, the IDS becomes less sensitive and more malicious instances are misclassified as non-malicious.
2) FALSE POSITIVE RATE RESULTS
The FPr results of our IDS with and without the use of an FCM are compared in Fig. 12. Again, the metric used to construct the FCM for these results was the THR. Similarly to the DR results, we can see that the use of an FCM outper-forms the FPr results produced by the IDS without the use of an FCM, for all the evaluated approaches. Also, the difference in the performance is evident. The largest difference in the FPr results occurs between FCM01 andNo FCM, for the set #3 (THR), which is over 35%. The largest difference for all the sets that combine two metrics is obtained in #10 (COM-THR), where the difference is 27.82%. Among the sets that combine three metrics, the largest FPr difference is obtained in #14 (COM-THR-SPD), where the difference is 17.15%. When all the metrics are combined, the difference between FCM01 andNo FCM is 9.68%. Also, the set of metrics #15 is the one that produces the best FPr (i.e. the lowest FPr) results, only 6.33%.
Among the three approaches that use an FCM, FCM01 is the one that always produces the lowest FPr, when two or more metrics are combined. FCM01 outperforms the FPr results generated by the other two approaches in∼5% for all the combination of metrics; and a peak improvement of up to 8.05%, for the set #10 (COM-THR). Also, in contrast to the DR results, the FPr decreases as the number of fused metrics increases. Ideally, we would prefer to see a decrease in the FPr and an increase in the DR, at the same time. This behaviour could be associated with the tradeoff in network intrusion detection described in [34]. The authors explain that there exists a tradeoff between the reduction of the FPs by decreasing the sensitivity of the IDS and the increase of the number of misclassifications.
3) OVERALL SUCCESS RATE RESULTS
The final performance metric that we have used is the OSR. In contrast to the DR that is only based on the malicious content of the analysed data, the OSR usefully represents all the instances that have been correctly classified, regardless of whether these are malicious or not. Therefore, the OSR pro-vides a more representative understanding of the efficiency of the IDS. Fig. 13 presents the OSR results comparison between all the approaches. Similar to the DR and FPr, the use of an FCM in the IDS outperforms the OSR results
produced by the IDS without an FCM, for all the evaluated approaches. Additionally, once again,FCM01is the one that always produces the best results among all the approaches.
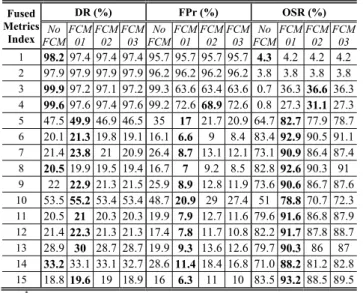
Focusing upon the evaluation of the two approaches, FCM01andNo FCM, for the set #3 (THR) the improvement in the OSR between the two methods is 35.64%. The largest improvement in all the sets that combine two metrics is obtained in #10 (COM-THR), where the difference between the two approaches is 27.38%. Among the sets that com-bine three metrics, the largest OSR improvement is obtained in #14 (COM-THR-SPD), where the difference is 17.15%. And finally, when all the metrics are combined, the difference between the two approaches is over 9.68% of improvement. This improvement is constant for all the combinations of metrics, and shows once more that the use of contextual infor-mation improves the detection capabilities of our anomaly-based IDS. Again, the set of metrics #15 is the one that produces the best OSR (i.e. the highest OSR) results, 93.19%. The results show that, more instances are correctly classified as more metrics are combined. With respect to the three approaches that use an FCM, once again, FCM01 outper-forms the OSR results generated by the other two approaches. The average improvement is ∼6% for all the combination of metrics; and a peak improvement of up to 8.06%, for the set #10 (COM-THR). All the detection results plotted in Figs. 11-13 have been tabulated in Table 4.
TABLE 4. Detection results - proposed approaches.
4) RESULTS ANALYSIS
These results indicate that by utilising only measureable information from the network without considering the avail-able contextual information, the IDS may reach a wrong conclusion, leading to an overall low accuracy. Also, from the presented results, we can infer that the most efficient approach is to adjust the BPA values prior to the data fusion process. This is because the FCM01 approach adjusts all
of the considered metrics individually. Hence, the contribu-tion of the contextual informacontribu-tion adapts according to the BPA values given by the IDS for each individual metric, and would impact each of the metrics differently. Also, the con-tribution of the contextual information through the approach that constructs an additional metric, FCM02, decreases as the number of metrics being fused increases. This is because generally, after a number of consecutive D-S fusions, the BPA value given to one of the hypotheses will be largely higher than the rest of the BPAs. Therefore, the fusion of the metric computed from the FCM may not reverse the decision of the IDS. Only in cases in which the BPA values of both hypotheses,NormalandAttack, are close to each other, could the addition of the new metric have an evident effect on the final IDS decision. In the case of the approach that adjusts the BPA values after the data fusion process,FCM03, is prone to dominate the entire decision. On the one hand, in cases in which the BPA values of both hypotheses,Normal and Attack, are close to each other, the addition of the contextual information could greatly influence the final IDS decision. On the other hand, even if one of the hypotheses receives a largely higher BPA value than the rest, the addition of the contextual information could overturn the final IDS decision if the outcome of the FCM is larger than the resulting BPA values given by the IDS.
The most important findings can be summarised as follows:
• The use of an FCM in the detection process outperforms the efficiency of an IDS without considering the use of contextual information.
• TheFCM01approach performs generally better than the other proposed approaches.
• The contribution of the contextual information is more evident in the case of FPr and OSR.
• The contribution of theFCM02approach decreases as the number of metrics being fused increases.
• TheFCM03approach is prone to dominate the decision.
C. METRICS EVALUATION FOR FCM DESIGN
As it was explained in Section VI.B, in order to characterise the PoL of the network usage in the FCM, the network administrator defined a number of thresholds for each of the considered metrics (i.e. THR, COM, and DPD). These thresholds define expected levels of the normal usage of the network resources according to the a priori knowledge of the network administrator. One FCM model is designed for each of the considered metrics. As described in Section VI.B, any of the available metrics can be used in the construction of the FCM to characterise the network usage. However, we decided to utilise only one of the metrics at a time to reduce the complexity of the model.
This section compares the detection results generated by our IDS when the metrics THR, COM, and DPD are used to model the FCM, as well as the results of the IDS without an FCM. Since the addition of the FCM contribution prior to the data fusion process is the most efficient approach of the
three proposed, only theFCM01approach is considered in the results presented in Figs. 14-16. For clarity, Table 5 lists the different approaches that have been compared in this section. Again, the effectiveness of the IDS has been evaluated in terms of DR, FPr, and OSR, presented in four graphs for all the possible combinations of metrics described in Table 2. TABLE 5. List of FCM models compared in the results.
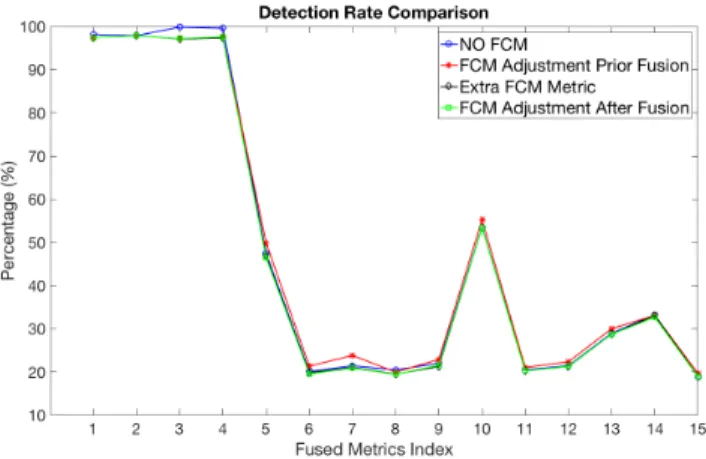
1) DETECTION RATE RESULTS
The DR results of the IDS are compared in Fig. 14. The most noticeable characteristic that we can see in the results is the drastic improvement provided by theFCM-COMand FCM-DPDapproaches. For almost all the possible combina-tion of metrics, both approaches provide over 99% of DR. In particular, for the set #15 (COM-THR-SPD-DPD) the DR reaches 99.76%, which improves the DR results provided by the IDS to 80.94% without the use of an FCM. Also, in contrast to the results generated byFCM-THR, the DR does not decrease as the number of fused metrics increases. This phenomenon manifests that the contribution of the contextual information tends to dominate the detection.
FIGURE 14. DR comparison: Adjustment of BPAs prior to the fusion process; FCM designed based on the THR, COM or DPD, and the IDS without an FCM.
2) FALSE POSITIVE RATE RESULTS
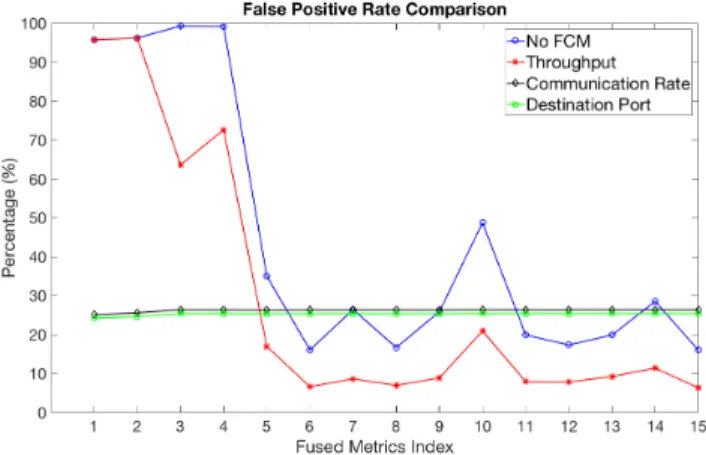
The FPr results of our IDS are compared in Fig. 15. In contrast to the DR results, we can see that the use of theFCM-COM andFCM-DPD produces a slightly higher number of false alarms, in comparison with the use of the FCM-THR. For the set #15 (COM-THR-SPD-DPD) the FPr reaches 26.42% and 25.42% for the FCM-COM and FCM-DPD, respec-tively. This represents an increase in the number of false
FIGURE 15. FPr comparison: Adjustment of BPAs prior to the fusion process; FCM designed based on the THR, COM or DPD, and the IDS without an FCM.
alarms of approximately 20% (i.e. ∼140800 normal data instances misclassified). In comparison with the No FCM approach, the increase in the number of false alarms reaches approximately 10% (i.e. ∼73000 normal data instances misclassified). As these results suggest, the use of the FCM-THRapproach produces the best detection results over-all in terms of FPr. Also, similarly to the DR results presented in Fig. 14, the FPr does not decrease as the number of fused metrics increases.
3) OVERALL SUCCESS RATE RESULTS
Fig. 16 presents the OSR results comparison of our IDS. Generally, the OSR results produced by theFCM-COMand FCM-DPDapproaches remain almost unchanged regardless of whether the number of fused metrics increases or not. As in the previous results (i.e. DR and FPr) when the FCM-COM and FCM-DPD are used, the contribu-tion of the FCM tends to dominate the intrusion detec-tion process. Both approachesFCM-COM andFCM-DPD produce lower OSR overall than the FCM-THR approach for almost all the combinations of metrics. For the set #15 (COM-THR-SPD-DPD), which is the set index expected to produce the best results overall, the OSR reaches 73.58% and 74.58% for the FCM-COM and FCM-DPD, respectively. This represents a decrease of approx-imately 20% of OSR with respect to the use of FCM-THR, and a decrease of approximately 10% of OSR with respect to the IDS without an FCM. As these results suggest, once again, the use of the metric THR to construct the FCM produces the best detection results overall.
4) RESULTS ANALYSIS
From the presented results, the important role played by the metric selection in the design of the modelled FCM (i.e. THR, COM and DPD) in the effectiveness of the IDS is clear. Based on the 99% of DR obtained when either the approachFCM-COM or FCM-DPD is used, we might incorrectly assume that these are the best selection
FIGURE 16. OSR comparison: Adjustment of BPAs prior to the fusion process; FCM designed based on the THR, COM or DPD, and the IDS without an FCM.
TABLE 6. Detection results - FCM design.
of metrics. An IDS that triggers ∼140800 false alarms during the 9 days that the experiment lasted would make the network administrator ignore the generated alarms. A tradeoff between the DR and the false alarms should be found, based on the needs of the protected network. The metric selection should be based on whether we prioritise a system that detects most of the attacks regardless of the number of false alarms, or whether we prioritise reducing the number of misclassifications. All the results plotted in Figs. 14-16 have been tabulated in Table 6.
The most important findings can be summarised as follows:
• TheFCM-COMandFCM-DPDapproaches produce the best detection results overall in terms of DR.
• The FCM-THR approach produces the best detection results overall in terms of FPr and OSR.
• The use of contextual information in the detection pro-cess, regardless of the metric used in the modelling of
the FCM, outperforms the efficiency of an IDS without an FCM.
IX. CONCLUSIONS AND FUTURE WORK
In this paper we have advocated incorporating high-level information regarding a monitored network, in the form of the PoL and the network administrator prior knowledge, when taking decisions on whether an attack is present in the net-work traffic. We have proposed two additional approaches to the one previously presented in [2], that use an FCM in conjunction with an IDS to add the contextual information into the detection process. The analysed dataset was gath-ered from a real LAN in a research office during 9 days, and comprises normal traffic and traces of port scanning attacks.
Initially, we have compared the results generated by our IDS without the use of an FCM and with the application of all the proposed approaches, using the metric THR to design the FCM. In terms of DR results, the proposed approaches provide an improvement to the DR results of only ∼2%. Nonetheless, with regards to the FPr and the OSR, it is evident that the use of PoL constantly improves the detection capabil-ities of the IDS, for all the possible combinations of metrics. Among all the FCM approaches,FCM01, the approach that adjusts the BPA values prior to the fusion process using the FCM, is the one that always produces the lowest FPr and higher OSR. TheFCM01 approach is able to produce only 6.33% of FPr, and up to 93.19% of OSR, in the best-case scenario.
During a second set of experiments, we compared how the selection of metrics used by the network administra-tor to represent the expected normal usage of the network resources may influence the detection results. From the pre-sented results, we can see that there are significantly distinct results, especially in terms of DR. The use of the metric COM and DPD in the design of the FCMs drastically improves the DR results produced when the THR is utilised. For almost all the possible combination of metrics, both approaches provide over 99% of DR. This represents an improvement of almost 80% of DR in comparison to the use of the THR. However, with regards to the FPr and the OSR, the use of the metrics COM and DPD produced slightly worse detection results than the use of the THR. By using all the considered metrics, the FPr reaches 26.42% and 25.42% for the COM and DPD, respectively. This represents an increase in the number of false alarms of approximately 140800 data instances misclassified.
Different conclusions could be extracted from the pre-sented results. First, these results empirically confirm that the use of the FCM provides improvement to the effectiveness of the IDS. Also, the presented results ratify that adjusting the BPAs prior to the data fusion provides the best use of the PoL in the detection process. The number of false alarms may not be low enough to be acceptable and make the IDS usable in practice in multiple scenarios. Nonetheless, it is important to reiterate and emphasise that the aim of this work is to
![FIGURE 6. Merged [14×14] adjacency matrix of the FCM composed using the number of network users, time of the day and the throughput.](https://thumb-us.123doks.com/thumbv2/123dok_us/9018937.2799723/9.864.450.797.99.303/figure-merged-adjacency-matrix-composed-number-network-throughput.webp)