University of Bradford eThesis
This thesis is hosted in
Bradford Scholars
– The University of Bradford Open Access
repository. Visit the repository for full metadata or to contact the repository team
© University of Bradford. This work is licenced for reuse under a Creative Commons
Licence.
Automated Dust Storm Detection Using
Satellite Images
ESAM ELMEHDE AMAR EL-OSSTA
BSc, MSc
PhD
Satellite Images
Development of a Computer System for the Detection of Dust Storms
from MODIS Satellite Images and the Creation of a New Dust Storm
Database
By
ESAM ELMEHDE AMAR EL-OSSTA
BSc, MSc
A Thesis Submitted for the Degree of Doctor of Philosophy
2013
Digital Imaging
School of Computing, Informatics and Media
University of Bradford
i
Abstract
Dust storms are one of the natural hazards, which have increased in frequency in the recent years over Sahara desert, Australia, the Arabian Desert, Turkmenistan and northern China, which have worsened during the last decade. Dust storms increase air pollution, impact on urban areas and farms as well as affecting ground and air traffic. They cause damage to human health, reduce the temperature, cause damage to communication facilities, reduce visibility which delays both road and air traffic and impact on both urban and rural areas. Thus, it is important to know the causation, movement and radiation effects of dust storms. The monitoring and forecasting of dust storms is increasing in order to help governments reduce the negative impact of these storms. Satellite remote sensing is the most common method but its use over sandy ground is still limited as the two share similar characteristics. However, satellite remote sensing using true-colour images or estimates of aerosol optical thickness (AOT) and algorithms such as the deep blue algorithm have limitations for identifying dust storms. Many researchers have studied the detection of dust storms during daytime in a number of different regions of the world including China, Australia, America, and North Africa using a variety of satellite data but fewer studies have focused on detecting dust storms at night. The key elements of this present study are to use data from the Moderate Resolution Imaging Spectroradiometers on the Terra and Aqua satellites to develop more effective automated method for detecting dust storms during both day and night and generate a MODIS dust storm database.
Keywords: Brightness Temperature Difference, Neural Network, Pixel classification, Database, Decision Tree.
ii
First of all I would like to praise the God who helped me to end this research, and reach this stage.
I would like to express my deepest gratitude and thankfulness to both of my supervisors Dr Stanley Ipson and Prof Rami Qahwaji for continuing to advise, encourage, suggest and orientate me towards the right path in my study research and to all those who contributed to me completing this thesis.
Thanks go to the University of Bradford and to the school of Computing, Informatics and Media for providing me with the facilities and the research resources required during the period of study.
I also wish to acknowledge the MODIS team for assisting me to understand how to deal with MODIS HDF file format and for much useful information to complete this work.
Also, I would like to record my great thanks and appreciation to my sponsor the Libyan Centre for Remote Sensing and Space Science, for affording me the opportunity of study and sponsoring my study.
Especially, I would like to give special thanks to my parents, my wife Wafa, my daughter Fatima and my son Abd-Assami and ask them for forgiveness for any inadvertent default on their rights during the period of study.
iii
To My Father And My Mother,
My Beloved Wife: Wafa,
My Lovely Daughter: Fatima,
My Lovely Son: Abd-Assami.
iv
ABSTRACT ... I ACKNOWLEDGMENTS ... II DEDICATION ... III TABLE OF CONTENTS ... IV LIST OF FIGURES ... VI LIST OF TABLES ... XI LIST OF ACRONYMS ... XIII LIST OF PUBLICATIONS ... XVCHAPTER ONE ... 1
1. INTRODUCTION ... 1
1.1 BACKGROUNDANDMOTIVATION ... 1
1.2 PROBLEMIDENTIFICATION ... 5
1.3 OBJECTIVES ... 6
1.4 OUTLINEOFTHETHESIS ... 7
CHAPTER TWO ...10
2. LITERATURE REVIEW OF EXISTING WORK ...10
2.1. INTRODUCTION... 10
2.2. OVERVIEWOFMODISINSTRUMENT ... 10
2.2.1. MODIS PRODUCTS AND APPLICATIONS ... 13
2.2.1.1. MODIS CALIBRATION PRODUCTS ...13
2.2.1.2. MODIS ATMOSPHERIC PRODUCTS ...15
2.2.1. WHY MODIS ... 21
2.2.2. SOFTWARE SYSTEMS TO READ AND VIEW HDF FILES ... 21
2.3. OVERVIEWOFPREVIOUSDUSTSTORMDETECTIONWORK ... 24
2.3.1. DUST STORM DETECTION USING MODIS DATA ... 24
2.3.2. DUST STORM DETECTION NOT USING MODIS ... 34
2.4. OVERVIEWOFSATELLITEIMAGECLASSIFICATION ... 40
2.5. CHAPTERCONCLUSION ... 42
CHAPTER THREE ...45
3. DUST STORM DETECTION USING THRESHOLDING ...45
3.1. INTRODUCTION... 45
3.2. DAYTIMEDUSTSTORMDETECTION ... 45
3.3. NIGHTANDDAYTIMEDUSTSTORMDETECTION ... 63
3.4. CHAPTERCONCLUSIONS ... 72
CHAPTER FOUR ...74
4. DUST STORM DETECTION USING A NEURAL NETWORK ...74
4.1. INTRODUCTION... 74
4.1.1. SINGLE LAYER FEED-FORWARD ... 74
v
4.2.2. EXPERIMENTAL VALIDATION ... 77
4.3. NIGHTANDDAYDUSTSTORMDETECTION ... 86
4.3.1. FEATURE SELECTION ... 86
4.3.2. EXPERIMENTAL AND VALIDATION ... 88
4.4. CREATINGADUSTSTORMMASKUSINGNEURALNETWORKS ... 97
4.5. CHAPTERCONCLUSION ... 101
CHAPTER FIVE ... 102
5. CLASSIFICATION OF MODIS IMAGES USING SIX CLASSES ... 102
5.1 INTRODUCTION... 102
5.2 MODISIMAGECLASSIFICATIONUSINGADECISIONTREE ... 104
5.2.1 FEATURE SELECTION ... 105
5.2.2 EXPERIMENTAL AND VALIDATION ... 106
5.3 MODISIMAGECLASSIFICATIONUSINGANEURALNETWORK... 113
5.3.2 FEATURE SELECTION ... 114
5.3.2 EXPERIMENTAL RESULTS AND DISCUSSION ... 114
5.4 CHAPTERCONCLUSION ... 118
CHAPTER SIX ... 119
6. GENERATING AN AUTOMATED MODIS DUST STORM DATABASE SYSTEM ... 119
6.1INTRODUCTION ... 119 6.2SYSTEMOBJECTIVE ... 119 6.3SYSTEMDEVELOPMENT ... 120 6.4SYSTEMVALIDATION ... 122 6.4.1. ADMINISTRATOR PACKAGE ... 122 6.4.2. USER PACKAGE ... 133 6.5CHAPTERCONCLUSION ... 134 CHAPTER SEVEN ... 135
7. CONCLUSIONS AND SUGGESTIONS FOR FURTHER WORK ... 135
7.1INTRODUCTION ... 135
7.2OVERALLCONCLUSIONS ... 135
7.3DETAILEDCONCLUSIONANDSUMMARY ... 136
7.4CONTRIBUTIONS ... 141
7.5SUGGESTIONSFORFURTHERWORK ... 143
REFERENCES ... 144
APPENDIX A ... 148
1. OVERVIEW OF MODIS INSTRUMENT ... 148
vi
FIGURE 1-1 SAHARAN DUST STORM CAUSED AIR CRASH NEAR TUNIS ... 4
FIGURE 2-1 MODIS ATMOSPHERE DATA PROCESSING ARCHITECTURE AND PRODUCTS [22]. ... 17
FIGURE 2-2 (A) IS A TRUE COLOUR IMAGE CAPTURED BY AQUA OVER NORTH AFRICA AND (B) IS THE RELATIVE CLOUD MASK. ... 18
FIGURE 2-3HDFGUITOOL ... 23
FIGURE 2-4 HDFTOOL READING AN HDF FILE ... 23
FIGURE 3-1PLOTS OF MODIS EMISSIVITY DATA FOR DIFFERENT SURFACES ... 47
FIGURE 3-2 AVERAGE BRIGHTNESS TEMPERATURES OF WATER, LAND, VEGETATION, DUST STORM AND CLOUD IN, FROM LEFT TO RIGHT, BANDS 32, 31, 23, 22, 21 AND 20. ... 51
FIGURE 3-3 (A)IS THE TRUE COLOUR IMAGE FROM DATA NUMBER 8 IN TABLE 3.3, CAPTURED BY MODIS (AQUA) ON 24TH OF FEBRUARY 2006 AT 11:30 GMT OVER NORTH AFRICA, (B) IS THE ASSOCIATED BTD BETWEEN BANDS 23 AND 31. ... 52
FIGURE 3-4(A) IS THE TRUE COLOUR IMAGE FROM DATA NUMBER 6 IN TABLE 3.3, CAPTURED BY MODIS(AQUA) ON 1ST OF MARCH 2006 AT 12:20 GMT OVER LIBYA, (B) IS THE ASSOCIATED BTD BETWEEN BANDS 23 AND 31. ... 52
FIGURE 3-5(A) IS THE TRUE COLOUR IMAGE FROM DATA NUMBER 7 IN TABLE 3.3, CAPTURED BY MODIS(AQUA) ON 29TH OF MAY 2004 AT 12:30 GMT OVER LIBYA, (B) IS THE ASSOCIATED BTD BETWEEN BANDS 23 AND 31. ... 53
FIGURE 3-6(A) IS THE TRUE COLOUR IMAGE FROM DATA NUMBER 26 IN TABLE 3.3, CAPTURED BY MODIS(TERRA) ON 8TH OF MAY 2002 AT 09:35 GMT OVER LIBYA, (B) IS THE ASSOCIATED BTD BETWEEN BANDS 23 AND 31. ... 53
FIGURE 3-7 (A) IS THE BTD BETWEEN BANDS 23 AND 31 OF DATA NUMBER 8 IN TABLE 3.3, (B) IS THE HISTOGRAM OF LAND, CLOUD AND DUST STORM SAMPLES FROM THE DATA SHOWN IN (A). ... 54
FIGURE 3-8(A) IS THE BTD BETWEEN BANDS 23 AND 31 OF DATA NUMBER 6 IN TABLE 3.3,(B) IS THE HISTOGRAM OF LAND, CLOUD AND DUST STORM SAMPLES FROM THE DATA SHOWN IN (A). ... 54
FIGURE 3-9 (A) IS THE BTD BETWEEN BANDS 23 AND 31 OF DATA NUMBER 7 IN TABLE 3.3, (B) IS THE HISTOGRAM OF LAND, CLOUD AND DUST STORM SAMPLES FROM THE DATA SHOWN IN (A). ... 55
FIGURE 3-10 (A) IS THE BTD BETWEEN BANDS 23 AND 31 OF DATA NUMBER 26 IN TABLE 3.3, (B) IS THE HISTOGRAM OF LAND, CLOUD AND DUST STORM SAMPLES FROM THE DATA SHOWN IN (A). ... 55
FIGURE 3-11 FLOW CHART OF THE PROPOSED TECHNIQUE FOR DUST STORM DETECTION ... 56
FIGURE 3-12 (A)IS THE TRUE COLOUR IMAGE FOR DATA NUMBER 8 IN TABLE 3.3 CAPTURED BY MODIS (AQUA) ON 24TH OF FEBRUARY 2004 AT 11:30 GMT OVER NORTH AFRICA, (B) IS THE CORRESPONDING BTD BETWEEN BANDS 23 AND 31 AND (C) IS THE CORRESPONDING BINARY IMAGE SHOWING DUST STORM DETECTION . ... 57
FIGURE 3-13 (A) IS THE TRUE COLOUR IMAGE FOR DATA NUMBER 6 IN TABLE 3.3 CAPTURED BY MODIS (AQUA) ON 1ST OF MARCH 2006 AT 12:20 GMT OVER LIBYA, (B) IS THE CORRESPONDING BTD BETWEEN BANDS 23 AND 31 AND (C) IS THE CORRESPONDING BINARY IMAGE SHOWING DUST STORM DETECTION . ... 58
FIGURE 3-14 (A) IS THE TRUE COLOUR IMAGE FOR DATA NUMBER 7 IN TABLE 3.3 CAPTURED BY MODIS (AQUA) ON 29TH OF MAY 2004 AT 12:30 GMT OVER CHAD, (B) IS THE CORRESPONDING BTD BETWEEN BANDS 23 AND 31 AND (C) IS THE CORRESPONDING BINARY IMAGE SHOWING DUST STORM DETECTION . ... 58
FIGURE 3-15 (A) IS THE TRUE COLOUR IMAGE FOR DATA NUMBER 26 IN TABLE 3.3 CAPTURED BY MODIS (TERRA) ON 8TH OF MAY 2002 AT 09:35 GMT OVER LIBYA, (B) IS THE CORRESPONDING BTD BETWEEN BANDS 23 AND 31 AND (C) IS THE CORRESPONDING BINARY IMAGE SHOWING DUST STORM DETECTION . ... 59
vii
CORRESPONDING BINARY IMAGE SHOWING DUST STORM DETECTION. ... 59
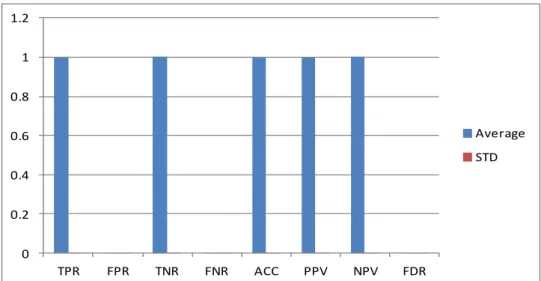
FIGURE 3-17THE AVERAGE AND THE STANDARD DEVIATION RESULTS OF THE VALIDATION MEASUREMENTS OVER THE SAHARA ... 61
FIGURE 3-18 THE AVERAGE AND THE STANDARD DEVIATION RESULTS OF THE VALIDATION MEASUREMENTS OVER CHINA ... 62
FIGURE 3-19 THE AVERAGE AND THE STANDARD DEVIATION RESULTS OF THE VALIDATION MEASUREMENTS OVER SEA SURFACES. ... 63
FIGURE 3-20 FLOW CHART OF THE PROPOSED TECHNIQUE FOR DUST STORM DETECTION ... 64
FIGURE 3-21 THE AVERAGE AND THE STANDARD DEVIATION RESULTS OF THE VALIDATION MEASUREMENTS OVER SAHARA SURFACES ... 65
FIGURE 3-22 (A) IS THE TRUE COLOUR IMAGE FOR DATA NUMBER 8 IN TABLE 3.3 CAPTURED BY MODIS (AQUA) ON 24TH OF FEBRUARY 2006 AT 11:30GMT OVER NORTH AFRICA (B) IS THE CORRESPONDING BINARY IMAGE
SHOWING DUST STORM DETECTION ... 66
FIGURE 3-23 (A) IS THE TRUE COLOUR IMAGE FOR DATA NUMBER 6 IN TABLE 3.3 CAPTURED BY MODIS (AQUA) ON 1ST OF MARCH 2006 AT 12:20 GMT OVER LIBYA, (B) IS THE CORRESPONDING BINARY IMAGE SHOWING DUST
STORM DETECTION ... 66
FIGURE 3-24 (A) IS THE TRUE COLOUR IMAGE FOR DATA NUMBER 7 IN TABLE 3.3 CAPTURED BY MODIS (AQUA) ON 29TH OF MAY 2004 AT 12:30 GMT OVER CHAD, (B) IS THE CORRESPONDING BINARY IMAGE SHOWING DUST
STORM DETECTION ... 67
FIGURE 3-25 (A) IS THE TRUE COLOUR IMAGE FOR DATA NUMBER 26 IN TABLE 3.3 CAPTURED BY MODIS (TERRA) ON 8TH OF MAY 2002 AT 09:35 GMT OVER LIBYA, (B) IS THE CORRESPONDING BINARY IMAGE SHOWING
DUST STORM DETECTION ... 67
FIGURE 3-26 THE AVERAGE AND THE STANDARD DEVIATION RESULTS OF THE VALIDATION MEASUREMENTS OVER CHINA ... 68
FIGURE 3-27 (A) IS THE TRUE COLOUR IMAGE OF A DUST STORM CAPTURED BY MODIS (TERRA) ON 26TH OF
MARCH 2004 AT 03:40 GMT CHINA, (B) IS THE CORRESPONDING BINARY IMAGE SHOWING DUST STORM DETECTION ... 69
FIGURE 3-28 THE AVERAGE AND THE STANDARD DEVIATION RESULTS OF THE VALIDATION MEASUREMENTS OVER SANDY LAND DURING THE THE NIGHT... 70
FIGURE 3-29 (A) IS THE BRIGHTNESS TEMPERATURE IMAGE FOR BAND 31 OF THE DUST STORM EVENT WHICH OCCURRED ON 12TH OF MAY 2005 AT 23:35 OVER THE NORTH OF SAUDI ARABIA, (B) IS THE CORRESPONDING
BINARY IMAGE SHOWING DUST STORM DETECTION ... 71
FIGURE 3-30 (A) IS THE COLOUR IMAGE OF THE CONTINUING DUST STORM EVENT SHOWN IN FIGURE 23 WHICH OCCURRED ON 13TH OF MAY 2005 AT 10: 35, (B) IS THE CORRESPONDING BINARY IMAGE SHOWING DUST
STORM DETECTION ... 71
FIGURE 3-31 (A) IS THE BRIGHTNESS TEMPERATURE IMAGE FOR BAND 31 OF THE DUST STORM EVENT WHICH OCCURRED ON 13TH OF MAY 2005 AT 22:40 OVER THE NORTH OF SAUDI ARABIA, (B) IS THE CORRESPONDING
BINARY IMAGE SHOWING DUST STORM DETECTION ... 72
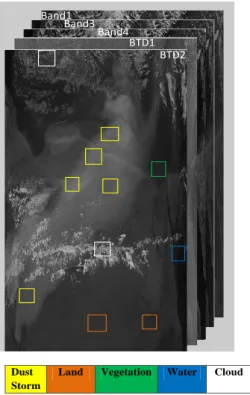
FIGURE 4-1SAMPLING OF THE FIVE CLASSES FROM THE THREE BAND IMAGES AND TWO BTD IMAGES GENERATED FROM ROW 8 OF TABLE 3.3 IN CHAPTER 3. ... 77
FIGURE 4-24 FEED- FORWARD NEURAL NETWORK STRUCTURE ... 78
FIGURE 4-3 A FLOWCHART OF THE FFNN ALGORITHM USING CROSS VALIDATION ... 79
FIGURE 4-4 THE AVERAGE AND THE STANDARD DEVIATION RESULTS OF THE FORECASTING MEASURES AFTER TRAINING AND TESTING THE FFNN TEN TIMES ... 83
viii
CORRESPONDING RESULT FROM THE TECHNIQUE USED IN REFERENCE [39]. ... 84
FIGURE 4-6(A) IS THE TRUE COLOUR AQUA IMAGE OF A DUST STORM OVER NORTH CHINA USED IN REFERENCE [1], (B) IS THE RESULT OF DUST STORM DETECTION USING THE NEURAL NETWORK, AND (C) IS THE
CORRESPONDING RESULT FROM THE TECHNIQUE USED IN REFERENCE [1]. ... 85
FIGURE 4-7 THE AVERAGE AND THE STANDARD DEVIATION RESULTS OF THE FORECASTING MEASURES AFTER TRAINING AND TESTING THE FFNN TEN TIMES ... 88
FIGURE 4-8(A) IS THE TRUE COLOUR IMAGE OF A SAHARAN DUST STORM CAPTURED BY AQUA ON 19TH OF JULY
2005 AND (B) IS ITS CORRESPONDING DUST STORM DETECTION ... 90
FIGURE 4-9 (A) IS THE TRUE COLOUR IMAGE OF DUST STORM OVER NORTH OF SAUDI ARABIA ON 13TH OF MAY 2005
CAPTURED BY AQUA AND (B) IS ITS CORRESPONDING DUST STORM DETECTION. ... 91
FIGURE 4-10 (A) IS THE TRUE COLOUR IMAGE OF DUST STORM EVENT OVER AN AREA OF VEGETATION (NORTH EAST OF CHINA) CAPTURED BY TERRA SATELLITE ON 11TH OF NOVEMBER 2010 AND (B) IS ITS CORRESPONDING
DUST STORM DETECTION. ... 92
FIGURE 4-11 (A) IS THE TRUE COLOUR IMAGE OF A DUST STORM EVENT WHICH OCCURRED OVER AFGHANISTAN ON 5TH OF OCTOBER 2011 CAPTURED BY THE AQUA SATELLITE AND (B) IS ITS CORRESPONDING DUST STORM
DETECTION. ... 93
FIGURE 4-12 (A) IS THE TRUE COLOUR IMAGE OF A SAHARAN DUST STORM CAPTURED BY AQUA ON 19TH OF JULY
2005 AND (B) IS ITS CORRESPONDING DUST STORM DETECTION. ... 94
FIGURE 4-13(A) IS THE TRUE COLOUR IMAGE OF A SAHARAN DUST STORM CAPTURED BY TERRA ON 19TH OF JULY
2005 AND (B) IS ITS CORRESPONDING DUST STORM DETECTION. ... 95
FIGURE 4-14 (A) IS A FALSE COLOUR IMAGE OF A DUST STORM CAPTURED BY AQUA ON 12TH OF MAY 2005 AND (B)
IS ITS CORRESPONDING DUST STORM DETECTION. ... 96
FIGURE 4-15 (A) IS A FALSE COLOUR IMAGE OF THE DUST STORM OVER NORTHERN SAUDI ARABIA SHOWN IN FIGURE 36(A) CAPTURED ON 13TH OF MAY 2005 BY AQUA SATELLITE AND (B) IS ITS CORRESPONDING DUST STORM
DETECTION ... 97
FIGURE 4-16 (A) IS THE TRUE COLOUR IMAGE OF THE SAHARAN DUST STORM CAPTURED BY TERRA ON 8TH OF MAY
2002 AND (B) IS ITS CORRESPONDING DUST STORM MASK. ... 99
FIGURE 4-17 (A) IS THE TRUE COLOUR IMAGE OF THE SAHARAN DUST STORM CAPTURED BY TERRA ON 8TH OF MAY
2002 AND (B) IS ITS CORRESPONDING DUST STORM MASK. ... 99
FIGURE 4-18 (A) IS THE TRUE COLOUR IMAGE OF THE SAHARAN DUST STORM CAPTURED BY TERRA ON 8TH OF MAY
2002 AND (B) IS ITS CORRESPONDING DUST STORM MASK. ... 100
FIGURE 4-19(A) IS THE TRUE COLOUR IMAGE OF THE SAHARAN DUST STORM CAPTURED BY TERRA ON 25ST OF JUNE
2006 AND (B) IS ITS CORRESPONDING DUST STORM MASK ... 100
FIGURE 5-1 CLASSIFICATION AS THE TASK OF MAPPING AN INPUT ATTRIBUTE SET X INTO ITS CLASS LABEL Y. ... 102
FIGURE 5-2EXAMPLE OF PIXEL DATA EXTRACTED FROM A MODIS IMAGE: CLOUD IS RED, WATER IS BLUE, DUST STORM IS YELLOW, VEGETATION IS GREEN AND LAND IS BROWN. ... 107
FIGURE 5-3STEPS IN DATA EXTRACTED FROM THE TWO BTDS,NDVI,NDDI AND NDSI TO BE USED IN THE DECISION TREE ... 107
FIGURE 5-4 FLOWCHART OF THE DECISION TREE APPLICATION WITH SEPARATE TRAINING AND TESTING DATA ... 110
FIGURE 5-5 ON THE LEFT IS THE TRUE COLOUR IMAGE OF A DUST STORM CAPTURED OVER LIBYA BY MODIS (TERRA) ON THE 8TH OF MAY 2002 AT 09:35 GMT, AND ON THE RIGHT IS THE RESULT OF THE DECISION TREE CLASSIFICATION DISPLAYED USING THE COLOUR KEY AT THE BOTTOM. ... 111
ix
CLASSIFICATION DISPLAYED USING THE COLOUR KEY AT THE BOTTOM. ... 111
FIGURE 5-7ON THE LEFT IS THE TRUE COLOUR IMAGE OF A DUST STORM CAPTURED OVER THE SAHARA BY MODIS (TERRA) ON THE 25TH OF JUNE 2006, AND ON THE RIGHT IS THE RESULT OF THE DECISION TREE CLASSIFICATION DISPLAYED USING THE COLOUR KEY AT THE BOTTOM. ... 112
FIGURE 5-8 ON THE LEFT IS THE TRUE COLOUR IMAGE OF A DUST STORM CAPTURED OVER THE NORTH OF SAUDI ARABIA BY MODIS (AQUA) ON THE 13TH OF MAY 2005, AND ON THE RIGHT IS THE RESULT OF THE DECISION TREE CLASSIFICATION DISPLAYED USING THE COLOUR KEY AT THE BOTTOM. ... 112
FIGURE 5-9 ON THE LEFT IS THE TRUE COLOUR IMAGE OF HEAVY SNOW CAPTURED OVER THE UK BY MODIS (TERRA) ON THE 7TH OF JANUARY 2010, AND ON THE RIGHT IS THE RESULT OF THE DECISION TREE CLASSIFICATION DISPLAYED USING THE COLOUR KEY AT THE BOTTOM. ... 113
FIGURE 5-10 ON THE LEFT IS THE TRUE COLOUR IMAGE OF A DUST STORM CAPTURED OVER LIBYA BY MODIS (TERRA) ON THE 8TH OF MAY 2002 AT 09:35GMT, AND ON THE RIGHT IS THE RESULT OF THE NEURAL NETWORK CLASSIFICATION DISPLAYED USING THE COLOUR KEY AT THE BOTTOM ... 116
FIGURE 5-11 ON THE LEFT IS THE TRUE COLOUR IMAGE OF A DUST STORM CAPTURED OVER THE SAHARA BY MODIS (TERRA) ON THE 8TH OF MAY 2002, AND ON THE RIGHT IS THE RESULT OF THE NEURAL NETWORK CLASSIFICATION DISPLAYED USING THE COLOUR KEY AT THE BOTTOM. ... 116
FIGURE 5-12 ON THE LEFT IS THE TRUE COLOUR IMAGE OF A DUST STORM CAPTURED OVER THE SAHARA BY MODIS (TERRA) ON THE 25TH OF JUNE 2006, AND ON THE RIGHT IS THE RESULT OF THE NEURAL NETWORK CLASSIFICATION DISPLAYED USING THE COLOUR KEY AT THE BOTTOM. ... 117
FIGURE 5-13 ON THE LEFT IS THE TRUE COLOUR IMAGE OF A DUST STORM CAPTURED OVER THE NORTH OF SAUDI ARABIA BY MODIS (AQUA) ON THE 13TH OF MAY 2005, AND ON THE RIGHT IS THE RESULT OF THE NEURAL NETWORK CLASSIFICATION DISPLAYED USING THE COLOUR KEY AT THE BOTTOM. ... 117
FIGURE 5-14 ON THE LEFT IS THE TRUE COLOUR IMAGE OF HEAVY SNOW CAPTURED OVER THE UK BY MODIS (TERRA) ON THE 7TH OF JANUARY 2010, AND ON THE RIGHT IS THE RESULT OF THE NEURAL NETWORK CLASSIFICATION DISPLAYED USING THE COLOUR KEY AT THE BOTTOM. ... 118
FIGURE 6-1 BLOCK DIAGRAM DESCRIBING THE OPERATIONS OF THE ADMINISTRATOR PACKAGE FOR MODIS DUST STORMS DATABASE ... 121
FIGURE 6-2 BLOCK DIAGRAM DESCRIBING THE OPERATIONS OF THE USER PACKAGE FOR MODIS DUST STORMS DATABASE ... 122
FIGURE 6-3 THE MAIN INTERFACE OF THE ADMINISTRATOR PACKAGE ... 123
FIGURE 6-4 THE FILE MENU OF THE ADMINISTRATOR PACKAGE INTERFACE ... 124
FIGURE 6-5 LOADING MODIS LEVEL 1B DATA ... 124
FIGURE 6-6 ERROR MESSAGE CAUSED BY LOADING THE WRONG FILE ... 125
FIGURE 6-7 THE RESULT WHEN NEW DATA ARE ADDED. ... 126
FIGURE 6-8 THE RESULT IF THERE IS INSUFFICIENT DUST STORM EVIDENCE IN THE IMAGE. ... 126
FIGURE 6-9 THE RESULT IF THE METADATA OF THE IMAGE ALEADY EXISTS ... 127
FIGURE 6-10THE SEARCH MENU OF THE ADMINISTRATOR PACKAGE INTERFACE ... 128
FIGURE 6-11DATABASE SEARCHING WINDOW ... 129
FIGURE 6-12ERROR MESSAGE CAUSED BY LEAVING TEXT EMPTY OR ENTERING A CHARACTER ... 130
FIGURE 6-13ERROR MESSAGE WHEN THE START DATE IS AFTER THE END DATE ... 130
FIGURE 6-14 ERROR MESSAGE CAUSED BY ENTERING INCORRECT FORMAT FOR DATE OR TIME ... 131
FIGURE 6-15 ERROR MESSAGE CAUSED BY AN INCORRECT HOURS FORMAT ... 131
FIGURE 6-16 ERROR MESSAGE CAUSED BY AN INCORRECT MINUTES FORMAT ... 131
x
FIGURE 6-20 THE FILE MENU OF THE USER PACKAGE INTERFACE WHERE THE LOAD FILE MENU ITEM IS NOT ACTIVE
xi
TABLE 2-1 PROPERTIES OF THE MODIS BANDS ... 12
TABLE 2-2 FILE SPECIFICATION FOR THE 48-BITS MODIS CLOUD MASK [23] ... 19
TABLE 2-3 DIFFERENCES BETWEEN MODIS (TERRA/AQUA) AND INSTRUMENTS ON OTHER SATELLITES ... 21
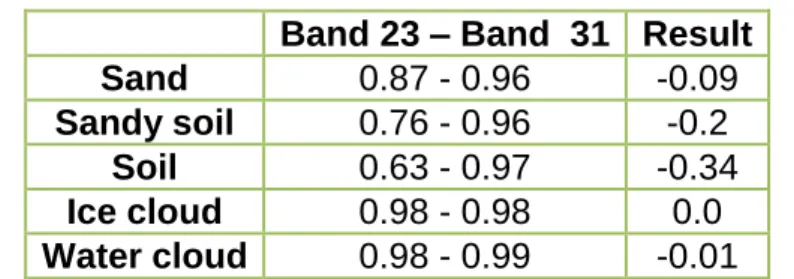
TABLE 3-1 EMISSIVITIES OF SAND, SANDY SOIL AND ICE AND WATER CLOUDS FROM THE MODIS DATA LIBRARY .. 47
TABLE 3-2EMISSIVITY DIFFERENCES BETWEEN BANDS 23 AND 31 ... 48
TABLE 3-3THE MODIS DATA USED IN THIS STUDY ... 49
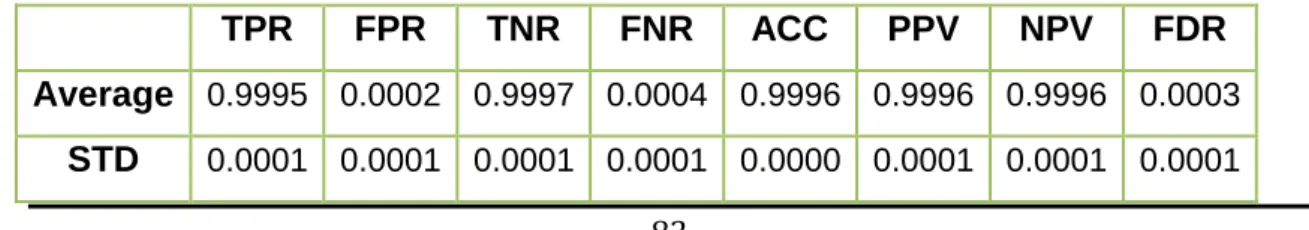
TABLE 3-4VALIDATION OF THE THRESHOLD METHOD OVER THE SAHARA USING SEVERAL MEASURES: TRUE POSITIVE RATE (TPR), FALSE POSITIVE RATE (FPR), TRUE NEGATIVE RATE (TNR), FALSE NEGATIVE RATE (FNR), ACCURACY (ACC), POSITIVE PREDICTIVE VALUE (PPV), NEGATIVE PREDICTIVE VALUE (NPV) AND FALSE DISCOVERY RATE (FDR) ... 61
TABLE 3-5 VALIDATION OF THE THRESHOLD METHOD OVER CHINA USING SEVERAL MEASURES: TRUE POSITIVE RATE (TPR), FALSE POSITIVE RATE (FPR), TRUE NEGATIVE RATE (TNR), FALSE NEGATIVE RATE (FNR), ACCURACY (ACC), POSITIVE PREDICTIVE VALUE (PPV NEGATIVE PREDICTIVE VALUE (NPV) AND FALSE DISCOVERY RATE (FDR) ... 61
TABLE 3-6 VALIDATION OF THE THRESHOLD METHOD OVER SEA SURFACES USING SEVERAL MEASURES: TRUE POSITIVE RATE (TPR), FALSE POSITIVE RATE (FPR), TRUE NEGATIVE RATE (TNR), FALSE NEGATIVE RATE (FNR), ACCURACY (ACC), POSITIVE PREDICTIVE VALUE (PPV), NEGATIVE PREDICTIVE VALUE (NPV) AND FALSE DISCOVERY RATE (FDR) ... 62
TABLE 3-7VALIDATION OF THE THRESHOLD METHOD OVER THE SAHARA USING SEVERAL MEASURES: TRUE POSITIVE RATE (TPR), FALSE POSITIVE RATE (FPR), TRUE NEGATIVE RATE (TNR), FALSE NEGATIVE RATE (FNR), ACCURACY (ACC), POSITIVE PREDICTIVE VALUE (PPV), NEGATIVE PREDICTIVE VALUE (NPV) AND FALSE DISCOVERY RATE (FDR) ... 65
TABLE 3-8 VALIDATION OF THE THRESHOLD METHOD OVER CHINA USING SEVERAL MEASURES: TRUE POSITIVE RATE (TPR), FALSE POSITIVE RATE (FPR), TRUE NEGATIVE RATE (TNR), FALSE NEGATIVE RATE (FNR), ACCURACY (ACC), POSITIVE PREDICTIVE VALUE (PPV), NEGATIVE PREDICTIVE VALUE (NPV) AND FALSE DISCOVERY RATE (FDR) ... 68
TABLE 3-9 VALIDATION OF THE THRESHOLD METHOD DURING NIGHT OVER SANDY LAND USING SEVERAL MEASURES: TRUE POSITIVE RATE (TPR), FALSE POSITIVE RATE (FPR), TRUE NEGATIVE RATE (TNR), FALSE NEGATIVE RATE (FNR), ACCURACY (ACC), POSITIVE PREDICTIVE VALUE (PPV), NEGATIVE PREDICTIVE VALUE (NPV) AND FALSE DISCOVERY RATE (FDR) ... 70
TABLE 4-1A SMALL SAMPLE OF THE DATA USED FOR TRAINING AND TESTING THE NEURAL NETWORK.NUMBERS IN COLUMNS 1 TO 3 ARE REFLECTANCE VALUES AND NUMBERS IN COLUMNS 4 AND 5 ARE BTD VALUES. THE CLASS VALUES 0.9 AND 0.1 CORRESPOND TO “DUST STORM” AND “NOT DUST STORM”, RESPECTIVELY. ... 78
TABLE 4-2THE AVERAGE AND THE STANDARD DEVIATION RESULTS OF THE FORECASTING MEASURES AFTER TRAINING AND TESTING THE FFNN TEN TIMES ... 82
TABLE 4-3 COMPARISON OF STANDARD MEASURE AVERAGES OBTAINED APPLYING THE FFNN AND TIIDI METHODS OVER THE SAHARA ... 84
TABLE 4-4 COMPARISON OF STANDARD MEASURE AVERAGES OBTAINED APPLYING THE FFNN AND TIIDI METHODS OVER THE CHINA. ... 85
TABLE 4-5 THE AVERAGE AND THE STANDARD DEVIATION RESULTS OF THE FORECASTING MEASURES AFTER TRAINING AND TESTING THE FFNN TEN TIMES ... 88
TABLE 4-6 THE AVERAGE AND THE STANDARD DEVIATION OF THE FORECASTING MEASURES OF APPLYING FFNN OVER SANDY LAND ... 89
TABLE 4-7 THE AVERAGE AND THE STANDARD DEVIATION OF THE FORECASTING MEASURES OF APPLYING FFNN OVER NON SANDY LAND ... 91
xii
TABLE 4-9 THE AVERAGE AND THE STANDARD DEVIATION OF THE FORECASTING MEASURES OF APPLYING FFNN OVER SEA WATER ... 95
TABLE 5-1 TOTAL NUMBER OF DATA IN EACH CLASS IN EACH FEATURE ... 108
TABLE 5-2 SAMPLE OF DATA USED FOR TRAINING THE DECISION TREE ... 108
TABLE 5-3 STANDARD MEASURE RESULTS FOR THE SIX CLASSES USING TRAINING DATA WITH THE DECISION TREE109
TABLE 5-4 STANDARD MEASURE RESULTS FOR THE SIX CLASSES USING THE DECISION TREE WITH 200 NEW MODIS TEST DATA IMAGES ... 109
TABLE 5-5 STANDARD MEASURE RESULTS FOR THE SIX CLASSES USING TRAINING DATA WITH THE NEURAL NETWORK
... 114
TABLE 5-6STANDARD MEASURE RESULTS FOR THE SIX CLASSES USING THE NEURAL NETWORK WITH 200 NEW MODIS TEST DATA IMAGES ... 115
xiii
AMSU Advanced Microwave Sounding Unit AOT Aerosol Optical Thickness
BT Brightness Temperature
BTD Brightness Temperature Difference DEP Dust Enhancement Product
DSI Dust Sand Index
DTC Decision tree classifier
EDOS EOS Data and Operating System EOS Earth Observing System
FAO Food and Agriculture Organization GUI Graphic User Interface
HDF Hierarchical Data Format
HDF-EOS Hierarchical Data Format – Earth Observing System INeN Incremental neural network
LAADS Level 1 and Atmosphere Archive and Distribution System LWIR Long-Wave Infrared
MISR Multi-angle Imaging Spectroradiometer ML Maximum Likelihood
MLC Maximum Likelihood Classifier MODAPS MODIS Adaptive Processing System
MODIS Moderate Resolution Imaging Spectroradiometer
NDDI Normalised Difference Dust Index NDSI Normalized Difference Snow Index
NIR Near Infrared
xiv
OBC On Board Calibrator
PCA Principal Component Analysis PNN Probabilistic Neural Network SDS Sand and Dust Storm
SMIR Short and Mid-Wave Infrared SRB Solar Reflectance Band
TIIDI Thermal Infrared Integrated Dust Index TIR Thermal Infrared Data
TMI TRMM Microwave Image
TOMS Total Ozone Mapping Spectrometer
VIS Visible
xv
E. El-ossta, R. Qahwaji and S. Ipson “A new Approach for the detection
of Dust Storms Using Multi-spectral MODIS bands” presented at the Mosharaka International Conference on Communications, Computers and Applications Amman Jordan, 2009.
E. El-ossta, R. Qahwaji and S. Ipson “Detection of Dust Storms Using MODIS Reflective and Emissive bands”, has been published in the “IEEE Journal of Selected Topics in Applied Earth Observations and Remote Sensing”.
E. El-ossta, R. Qahwaji and S. Ipson “Automatic Detection of Day and Night Time Dust Storms Using MODIS bands”, under preparation for publication in the “IEEE Journal of Selected Topics in Applied Earth Observations and Remote Sensing”.
1
CHAPTER ONE
1.
INTRODUCTION
1.1
BACKGROUND AND MOTIVATION
Dust storms are a common natural phenomena that occur widely around the world in arid and semi-arid regions especially in subtropical latitudes, including North Africa, northern China, Australia, the Arabian Desert, and Turkmenistan, which have worsened during the last decade [1, 2]. Desert landscapes and human activities in semi-arid areas are the most important sources of dust storms [3]. Scientifically, soil particles of size about 0.6-1mm are described as sand, while soil particle of size less than about 0.6 mm are described by dust. In practice only those dust particles of size less than 0.1 mm are transported by the wind and dust storms are the product of the collective transport of soil particles by wind [3]. The World Meteorological Organisation (WMO) protocol has classified dust storms according to their visibility into the following categories.
Drifting Dust: The visibility within these kinds of the dust events is not less than 10 km. This kind of dust is widespread dust and is not raised more than two metres.
2
Blowing Dust: This reduces the visibility to between 1 km and 10 km and is caused by a moderate wind which raises dust to a moderate height above the ground.
Dust Storm: This reduces the visibility to between 200 m and 1000 m and occurs when a strong wind lifts a large quantity of dust particles into the atmosphere
Severe Dust Storm: This reduce the visibility to less than 200 m and occurs when a very strong wind lifts a very large quantity of dust particles into the atmosphere [4].
Strong winds above dry land are the most important reason for the occurrence of dust storms and the largest source of dust storms in the world is the Sahara region, which is a source of dust deposited over much of Western Europe. Saharan dust storms are also blown westwards, depositing dust in the Atlantic Ocean and as far west as the United States and the West Indies. The arid and semi-arid region around the Arabian Sea is another principal source of global dust and contributes to dust sediment in the Arabian Sea. Many of the dust storms from China contribute to dust deposition in the Pacific Ocean. Fine dust can be transported at altitudes up to 6 km and move over distances up to 6,000 km [3]. Saharan dust storms transport large quantities of material across the African continent and beyond and can be both a cause of extensive disruption and hazard to health and also an important source of nutrients to both land and ocean [5]. Since 1900, 17 dust storms have swept over Great Britain from the Sahara. Each event transported about 10 million tons of dust to
3
Great Britain, according to research by the Geology Faculty of Oxford University [3].
Dust storms have a number of impacts upon both humans and the environment including the loss of many young plants, resulting in a loss of productivity. However, most of the impacts of dust storms are within the atmosphere, affecting air temperatures by absorption and reflection of solar radiation and affecting cloud formation and convection activity. The spread of the African dust in the air layer over the Sahara desert can cause changes in the intensity of the hurricane peak in the North Atlantic. Large quantities of dust deposited on ice surfaces have the effect of lowering snow reflection and amplifying snowmelt. There are many studies which show that dust transported long distances can affect geochemical conditions at long distances from dust sources. Reducing visibility to a few metres is only one of the most noticeable effects. This loss of visibility can be a major hazard effecting both civilian and military traffic and aircraft [6]. Figure 1-1 shows an Egyptian airplane which crashed near Tunis, Tunisia, killing 18 of the 60 people on board. The cause of this air crash was the Saharan dust storm on May 7th, 2002. Dust storms also reflect sunlight back into space, reducing the amount of energy reaching the surface resulting in cooling.
4
Dust particles impacting on human health, causing a wide range of respiratory disorders including chronic bronchitis and lower respiratory illness. Dust emissions from dried lake basins which introduce fine particles, including salts and chemical herbicides into the atmosphere generate a suite of health impacts and not just respiratory complaints, but also other serious illnesses. Dust storms can transport allergens, including bacteria and fungi, and it could be that an outbreak of meningococcal meningitis in the Sahel region of Africa and the spread of Coccidioidomycosis in the southwest United States are related to dust storm activity [6]. In China, dust storms are considered a risk factor in hospitals for respiratory and cardiovascular complains [6].
Dust storms are considered one of the main causes of desertification [3]. The Middle East, Taklamakan, Southwest Asia, Central Australia, the Etosha and Mkgadikgadi pans of Southern Africa, the Salar de Uyuni of Bolivia, and the Great Basin in the USA are known as dust storm source regions, but the Sahara is the biggest single source of dust storms. The Sahara is the main source of dust sedimentation into the Mediterranean Sea and neighbouring countries [6].
5
1.2
PROBLEM IDENTIFICATION
While dust storms are only one of many natural hazards, monitoring and tracking them has become very important in recent years to help governments to alleviate the consequences of these storms. At the present time there are only two main methods available for monitoring dust storms. The first is ground-based measurements, and the second is satellite ground-based remote sensing technology, in which interest is increasing [7] because ground based measurements cannot meet the requirements of monitoring and tracking dust storms very well.
Satellite remote sensing is likely to become the primary approach for the detection of dust storms [1] because of the potential advantages to using this technology, including flexible coverage of wide areas and continuous or frequent monitoring of the earth. On the other hand, satellite remote sensing is indirect, and methods based on analysis of true-colour images or calculations of aerosol optical thickness (AOT) by the deep blue algorithm, for example, are limited. However, in principle, the severity of dust storms, the areas they affect and changes in intensities can be monitored using remotely sensed images [7]. For these reasons, many researchers have proposed methods to distinguish dust storms from clouds, ground and water surfaces using images in many different spectral bands obtained from various instruments [1, 2, 7-9]. However, the detection of dust storms is difficult because they share some characteristics with clouds which can make it very hard to distinguish them in some spectral bands [2]. Furthermore, the characteristics of dust storms and ground sand are similar, which makes it difficult to discriminate between them. There is also
6
difficulty in detecting dust storms during the night. All the previous work on dust storm detection focused on detecting dust storms over one type of ground surface and most concentrated on detecting dust storms during the day.
1.3
OBJECTIVES
The objective here is to address long standing problems in the automatic detection of dust storms and develop techniques and procedures to efficiently recognize dust storms using the Moderate Resolution Imaging Spectroradiometers (MODIS) on board the NASA Terra and Aqua satellites. Furthermore, there is a need for generating a MODIS dust storm database as there is no such database for new further studies, particular for monitoring and tracking dust storms.
To achieve this objective, the following sub-objectives are addressed:
Statistical analysis for dust storm detection is pursued. The resulting analysis will allow better understanding of suitable MODIS bands for detecting dust storm from sandy land. The analysis could also be utilized in classifications and post-processing.
The generation of manually detected dust storm data, as there is no dust storm ground truth data available for validating dust storm detection methods.
The development of a new method for dust storm detection using thresholds. The target technique aims to be simple and produce binary images of dust storms.
7
The development of a new method for dust storm detection during the night using a threshold method.
The development of an efficient detection technique using a neural network to lead potentially to more accurate detection of dust storms during the day.
The development of an efficient detection technique using a neural network to lead potentially to more accurate detection of dust storms during both day and night time.
The generation of an automated system to update a MODIS dust storms database. This would involve creating a MODIS dust storm database as there is no such database available. This could then be used for the monitoring and tracking of dust storms.
1.4
OUTLINE OF THE THESIS
The remainder of this thesis is structured as follows. Chapter 2 starts by providing an overview of the relevant properties of the data available from the MODIS instrument and how it can be accessed, which helps to inform the subsequent review. This is followed by a literature review of previous work on dust storm detection, which provides definitions, context, and an understanding of the previous research. The review gives some examples of how different types of techniques are being used in this field. It reviews the state of the art, recent advances and the limitations of dust storm detection.
Chapter 3 presents two threshold based methods for detecting dust storms, starting with an analysis of the emissivities and the brightness
8
temperatures of objects seen in MODIS images in order to generate the best brightness temperature difference (BTD) to distinguish between dust storms and sandy land. One method is for daytime use only, while the other is for both day and night time use.
Chapter 4 presents two methods for detecting dust storms using Neural Networks. The methods differ in the sets of pixel features which are input into the Neural Networks in order to classify pixels as dust storm or not. The first feature set includes the brightness temperature differences calculated from two pairs of MODIS spectral bands and the reflectances from three other bands. This method is limited to daylight use only and so the second method uses a feature set which includes four brightness temperature differences and one other brightness temperature to achieve both day and night time classification of pixels as to the presence or absence of a dust storm.
Chapter 5 presents and compares two methods for classifying the pixels of MODIS Images into six classes: cloud, dust storm, water, vegetation, land and snow. The first method employs a decision tree method, and the second a neural network. Both methods use the same feature set, which includes two brightness temperatures and three other combinations of spectral bands, defined in previous work.
Chapter 6 presents an automated dust storm database system based on MODIS data which works during both day and night time, using a neural network. The feature vector used for the pixel classification is the one presented in Chapter 4.
9
The contributions of this research work to the field of dust storm detection are presented in Chapter 7, together with some possible future research directions in related areas.
10
CHAPTER TWO
2.
LITERATURE REVIEW OF EXISTING WORK
2.1. INTRODUCTION
Much of this chapter reviews existing work using data from the Moderate Resolution Images Spectrometer (MODIS). To aid this review, the chapter first continues in Section 2.2 with an overview of the MODIS instrument, its wavelength bands (and their intended uses), the products provided and the MODIS tools provided. The chapter then presents previous work on dust storm detection divided into two parts. Section 2.3.1 includes studies used MODIS data for dust storm detection, and Section 2.3.2 includes studies using data from other instruments. Section 2.4 describes some previous work on classification of the content of satellite images. The chapter ends with some conclusions in Section 2.5.
2.2. OVERVIEW OF MODIS INSTRUMENT
The Moderate Resolution Imaging Spectrometer (MODIS) scientific instrument is part of the NASA Earth observing System (EOS) mission. MODIS was launched onboard the Terra and Aqua satellites in December 1999 and May 2002 respectively. Both satellites have been working well except for band 6 (1.628 µm – 1.652 µm) of the Aqua satellite which is either non-functional or noisy. The MODIS instrument provides calibrated, high radiometric-sensitivity
11
(12 bit) data, in 36 spectral bands covering wavelengths from 0.4 µm to 14.4 µm in the visible (VIS), near infrared (NIR), short and mid-wave infrared (SMIR), and long-wave infrared (LWIR). Furthermore, the MODIS sensor has three different nadir ground spatial resolutions: 250m (bands 1 and 2), 500m (bands 3 - 7), and 1000m (bands 8 - 36). Table 2-1 provides some information on the MODIS bands and their intended usage. In the long track direction, there are 40 detectors per band for bands 1 and 2, 20 detectors per band for bands 3 - 7, and 10 detectors per band for bands 8 - 36 [10]. A double-sided scan mirror providing ±55-degree scanning pattern at the EOS orbit of 705 km, achieves a 2,330-km swath and provides near-daily imaging capability, complementing the spectral, spatial, and temporal coverage of the other research instruments [11]. MODIS data is intended to help improve understanding of global dynamics and processes occurring on land, in the oceans, and in the lower atmosphere [12]. The Terra satellite orbits the Earth, crossing the equator from north to south in the morning, while the Aqua satellite orbits the earth crossing the equator from south to north in the afternoon. MODIS data are transferred to ground stations in White Sands, New Mexico, and then sent to the Data and Operation System (EOS) at the Goddard Space Flight Centre. The MODIS instrument has been designed to provide improved monitoring for land, ocean, and atmosphere research. Spectral channels for improved atmospheric and cloud characterization have been included to permit both the removal of atmospheric effects on surface observations and the provision of atmospheric measurements [11].
12
Table 2-1 Properties of the MODIS bands Band Wavelength
(nm)
Resolution (m)
Key Use Primary nature
1 620-670 250 Absolute Land Cover
Transformation, Vegetation Chlorophyll
Reflectance Solar Bands 2 841-876 250 Cloud Amount, Vegetation Land
Cover Transformation 3 459-479 500 Soil/Vegetation Differences
4 545-565 500 Green Vegetation
5 1230-1250 500 Leaf/Canopy Differences 6 1628-1652 500 Snow/Cloud Differences 7 2105-2155 500 Cloud Properties, Land Properties
8 405-420 1000 Chlorophyll 9 438-448 1000 Chlorophyll 10 483-493 1000 Chlorophyll 11 526-536 1000 Chlorophyll 12 546-556 1000 Sediments 13h 662-672 1000 Atmosphere, Sediments 13l 662-672 1000 Atmosphere, Sediments 14h 673-683 1000 Chlorophyll Fluorescence 14l 673-683 1000 Chlorophyll Fluorescence 15 743-753 1000 Aerosol Properties 16 862-877 1000 Aerosol Properties, Atmospheric
Properties
17 890-920 1000 Atmospheric Properties, Cloud Properties
18 931-941 1000 Atmospheric Properties, Cloud Properties
19 915-965 1000 Atmospheric Properties, Cloud Properties
Band Wavelength (µm)
Resolution (m)
Key Use Primary nature
20 3.660-3.840 1000 Sea Surface Temperature
Thermal Emissive
Bands 21 3.929-3.989 1000 Forest Fires & Volcanoes
22 3.929-3.989 1000 Cloud Temperature, Surface Temperature
23 4.020-4.080 1000 Cloud Temperature, Surface Temperature
24 4.433-4.498 1000 Cloud Fraction, Troposphere Temperature
25 4.482-4.549 1000 Cloud Fraction, Troposphere Temperature
26 1.360-1.390 1000 Cloud Fraction (Thin Cirrus), Troposphere Temp.
Reflectance Solar Band 27 6.535-6.895 1000 Mid Troposphere Humidity
Thermal Emissive
Bands 28 7.175-7.475 1000 Upper Troposphere Humidity
29 8.400-8.700 1000 Surface Temperature
30 9.580-9.880 1000 Total Ozone
31 10.780-11.280 1000 Cloud Temperature, Forest Fires & Volcanoes, Surface Temp. 32 11.770-12.270 1000 Cloud Height, Forest Fires &
13
33 13.185-13.485 1000 Cloud Fraction, Cloud Height 34 13.485-13.785 1000 Cloud Fraction, Cloud Height 35 13.785-14.085 1000 Cloud Fraction, Cloud Height 36 14.085-14.385 1000 Cloud Fraction, Cloud Height
2.2.1. MODIS PRODUCTS AND APPLICATIONS
From the raw data, MODIS provides over 40 standard data products, in the Hierarchical Data Format – Earth Observing System (HDF-EOS) [13], intended to help scientists studying Earth’s land, ocean and atmosphere [14]. MODIS data have several levels of maturity. Scientists have used MODIS products in a great variety of applications, including oceanography, biology, and atmospheric science. The next sub-section provides some details of individual products, where names starting with MO or MY indicate the Terra and Aqua satellites respectively [15].
2.2.1.1.
MODIS CALIBRATION PRODUCTS
MODIS Calibration products (Level 1A, Level 1B and geo-location) are a precursor to every geophysical science product [16].
Level-1A Radiance Counts (MOD01, MYD01)
MODIS Level 1A data is produced by the MODIS Adaptive processing System (MODAPS) and sent to the Level 1 and Atmosphere
Archive and Distribution System (LAADS)
(http://modis.gsfc.nasa.gov/data/). Level 1A processing includes packaged and reformatted raw instrument data from Level 0 MODIS data received from the EOS data and operating system (EDOS) [17]. Raw Radiance Counts data set includes Level 1A Swath (MOD01 or MYD01) data, raw instrument engineering and spacecraft ephemeris data for all 36 MODIS
14
channels, which are used as inputs for geo-location, calibration, and processing. For indicating missing or bad pixels and instrument modes, quality indicators have been added. This product includes all MODIS digitized (counts) data for all bands, spatial resolutions, time covered, all detector views, and all engineering and ancillary data [15]. MODIS scan data during Level 1A processing includes eight fields which are used to store the earth location information for each MODIS spatial element. These fields are: geodetic latitude, geodetic longitude, height above the Earth ellipsoid, satellite zenith angle, satellite azimuth, range to the satellite, solar zenith angle and solar azimuth [17].
Level – 1B Calibrated Geo-located Radiances
MODIS Level 1A sensor counts (MOD 01) are used to generate, calibrated and geo-located radiances (in W/(m2.µm.sr)) for 36 bands and presented as Level 1B data. MODIS Level 1B calibration code generates four product files: Calibrated Earth View data at 250m resolution MOD02QKM and MOD02QKM for Terra and Aqua respectively; Calibrated Earth View data at 500m resolution including the 250m resolution bands aggregated to 500m resolution MOD02HKM and MOD02HKM for Terra and Aqua respectively; Calibrated Earth View data at 1km resolution including the 250m and 500m resolution bands aggregated to 1km resolution MOD021KM and MOD021KM for Terra and Aqua respectively; and On Board Calibrator (OBC) and Engineering Data MOD02OBC and MYD02OBC for Terra and Aqua respectively which contains on board measurements in the Space View, Black Body, Spectro-Radiometric
15
Calibration Assembly and Solar Diffuser Sectors, and additional engineering data [18]. The reflectance and the radiance can be generated from the solar reflective bands (1-19 and 26) using the Level 1B scaled integer representation. Quality flags, error estimates, and calibration data are all provided in Level 1B data files. Also, Brightness Temperature (BT) data (that assumes the emitting surface is a black body) can be generated using thermal emissive bands (20-25 and 27-36) [12, 19].
Geolocation Data
The MODIS Geolocation product (MOD03) consists of information on geodetic coordinates (latitude, longitude, and height), and the sun and satellite sensors properties (sensor zenith angles, sensor azimuth angles, slant ranges, solar zenith angle, solar azimuth angles) and geolocation flag values for each MODIS 1-km sample. By comparison, MODIS level 1B 250m and 500m data sample include just information about latitude and longitude. Spacecraft attitude and orbit, instrument telemetry, and a digital elevation model are used to determine the geolocation fields [20].
2.2.1.2.
MODIS ATMOSPHERIC PRODUCTS
MODIS atmospheric products include five data products in Level 2 and three data products in Level 3. The level 2 products contain geophysical parameters for aerosols (optical properties and mass concentration), water vapour, clouds (physical and optical properties), atmospheric profiles (temperature, moisture and total ozone and stability indices) and cloud mask. The Level 3 products contain daily, weekly and monthly statistics for the Level 2
16
science parameters [21]. The MODIS Atmospheric algorithm using twenty six MODIS bands to create atmospheric products [22]. Figure 2-1 summarises the MODIS atmosphere data processing architecture and products. Appendix A shows more details about MODIS atmospheric products
17
Figure 2-1 MODIS atmosphere data processing architecture and products [22].
L eve l-1 MOD01Level-1A MOD03
Geo location data set
MOD01
Calibrated L1Radiances
MODIS Atmosphere Processing
Instrument Packet Data
L eve l-0 L eve l-2 MOD02 MOD03 MOD35 Cloud Mask MOD07 Atmospheric Profiles
Total Ozone Burden
Stability Indices
Temperature and Moisture Profiles.
Precipitable Water (IR)
MOD02, MOD03, MOD07, MOD35
MOD04 Aerosol Product Aerosol Optical Thickness Aerosol Size Distribution MOD05 Precipitable Water Product Solar Algorithm IR Algorithm MOD06 Cloud Product
Cloud Top Properties
Cloud Particle Phase
Cloud Fraction
Cloud Optical Properties
MOD03. Level 2 Atmosphere Products
L eve l-3 MOD08 L3 Atmospheric Products 1- Aerosol 4- Water Vapour 2- Clouds 5- Stability Indices 3– Ozone
18
Cloud Mask (MOD35 for Terra and MYD35 for Aqua)
The goal of the cloud mask (MOD35) algorithm is to classify each pixel as confidently clear, probably clear, probably cloudy, or cloudy. The cloud mask is generated at 250m and 1000m resolutions [23] and consists of 48 bits of output that include information on individual cloud test results. However, there is no need to process all 48 bits when applying the mask; only the first 8 bits may be necessary. Figure 2-2(B) shows an example of cloud mask of MODIS image captured by Aqua satellite over North Africa on 2005 where the red flag pixel is confidently clear, yellow is probably clear, light blue is probably cloud and dark blue is cloud. However, the MODIS cloud mask has some limitations; firstly it is not accurate for detecting cloud when there is a dust storm as can be clearly seen in Figure 2-2(B), secondly the MODIS cloud mask takes two hours to become available, which leads to difficulty monitoring events such as dust storms.
Figure 2-2 (A) is a true colour image captured by Aqua over North Africa and (B) is the relative cloud mask.
19
The cloud mask algorithm uses a series of threshold tests applied to the 19 MODIS bands 1, 2, 4, 5, 6, 7, 17, 18, 19, 20, 22, 26, 27, 28, 29, 31, 32, 33, and 35 to identify the presence of clouds in the instrument field of view [23]. The cloud mask requires several ancillary data inputs: sun angle, azimuthal angle, viewing angle, land/water map at 1 km resolution and topographic elevation above mean sea level obtained from MOD03 (geolocation fields), and ecosystems global 1 km map of ecosystems based on the Olson classification system, and Daily NISE snow/ice map provided by NSIDC (National Snow and Ice Data Centre), and daily sea ice concentration product from NOAA [23].
The cloud mask is not the only cloud product from MODIS; several Principal Investigators have responsibility to deliver algorithms for various additional cloud parameters, such as water phase and altitude. The specific tests executed are functions of surface type, Including land, coastal, water, snow/ice and desert, and are different during the day and night [22]. The cloud mask output also includes results from particular cloud detection tests. Table 2-2 gives a description of MODIS cloud mask product bits.
Table 2-2 File specification for the 48-bits MODIS cloud mask [23]
BIT DESCRIPTION KEY RESULT
0 Cloud Mask Flag 0 = not determined
1 = determined
1-2 Unobstructed FOV Quality Flag 00 = cloudy
01 = uncertain clear 10 = probably clear 11 = confident clear
PROCESSING PATH FLAGS
20
4 Sun glint Flag 0 = Yes / 1 = No
5 Snow / Ice Background Flag 0 = Yes/ 1 = No
6-7 Land / Water Flag 00 = Water
01 = Coastal 10 = Desert 11 = Land
ADDITIONAL INFORMATION
8 Non-cloud obstruction Flag (heavy aerosol) 0 = Yes / 1 = No
9 Thin Cirrus Detected (near infrared) 0 = Yes / 1 = No
10 Shadow Found 0 = Yes / 1 = No
11 Thin Cirrus Detected (infrared) 0 = Yes / 1 = No
12 Spare (Cloud adjacency) (post launch) (Post launch)
1km CLOUD FLAGS
13 Cloud Flag - simple IR Threshold Test 0 = Yes / 1 = No
14 High Cloud Flag - CO2 Threshold Test 0 = Yes / 1 = No
15 High Cloud Flag - 6.7 µm Test 0 = Yes / 1 = No
16 High Cloud Flag - 1.38 µm Test 0 = Yes / 1 = No
17 High Cloud Flag - 3.9-12 µm Test 0 = Yes / 1 = No
18 Cloud Flag - IR Temperature Difference 0 = Yes / 1 = No
19 Cloud Flag - 3.9-11 µm Test 0 = Yes / 1 = No
20 Cloud Flag - Visible Reflectance Test 0 = Yes / 1 = No
21 Cloud Flag - Visible Ratio Test 0 = Yes / 1 = No
22 Clear-sky Restoral Test- NDVI in Coastal Areas 0 = Yes / 1 = No
23 Cloud Flag -7.3-11 µm Test 0 = Yes / 1 = No
ADDITIONAL TESTS
24 Cloud Flag – Temporal Consistency 0 = Yes / 1 = No
25 Cloud Flag - Spatial Consistency 0 = Yes / 1 = No
26 Clear Sky Restoral test 0 = Yes / 1 = No
27 Cloud Test – Night Ocean Variability Test 0 = Yes / 1 = No
28 Suspended Dust Flag 0 = Yes / 1 = No
29-31 Spares 0 = Yes / 1 = No
250m CLOUD FLAG - VISIBLE TESTS
32 Element(1,1) 0 = Yes / 1 = No
33 Element(1,2) 0 = Yes / 1 = No
34 Element(1,3) 0 = Yes / 1 = No
35 Element(1,4) 0 = Yes / 1 = No 0 = Yes / 1 = No
36 Element(2,1) 0 = Yes / 1 = No 0 = Yes / 1 = No
37 Element(2,2) 0 = Yes / 1 = No 0 = Yes / 1 = No
38 Element(2,3) 0 = Yes / 1 = No 0 = Yes / 1 = No
39 Element(2,4) 0 = Yes / 1 = No 0 = Yes / 1 = No
40 Element(3,1) 0 = Yes / 1 = No 0 = Yes / 1 = No
41 Element(3,2) 0 = Yes / 1 = No 0 = Yes / 1 = No
42 Element(3,3) 0 = Yes / 1 = No 0 = Yes / 1 = No
43 Element(3,4) 0 = Yes / 1 = No 0 = Yes / 1 = No
44 Element(4,1) 0 = Yes / 1 = No 0 = Yes / 1 = No
45 Element(4,2) 0 = Yes / 1 = No 0 = Yes / 1 = No
46 Element(4,3) 0 = Yes / 1 = No 0 = Yes / 1 = No
21 2.2.1.WHY MODIS
Many studies have concentrated on the detection, monitoring, mapping and assessment of various natural disasters (fire, snow, dust storm, flood etc) using various instruments and satellites. The MODIS instrument provides calibrated high radiometric sensitivity (12 bit) in 36 spectral bands covering wavelengths from 0.4 µm to 14.4 µm and has three different nadir ground spatial resolutions: 250m, 500m and 1000m. In the long track direction, there are 40 detectors per band for bands 1 - 2, 20 detectors per band for bands 3 - 7, and 10 detectors per band for bands 8 – 36. The MODIS instrument has been designed to provide improved monitoring for land, ocean, and atmosphere two times a day [10]. Table 2-3 illustrates the differences between MODIS satellites and other available satellites.
Table 2-3 Differences between MODIS (Terra/Aqua) and instruments on other
satellites Satellite Orbital Type Spatial
Resolution Frequency Field of View Number of Bands Cost to User MTSAT, FY-2C, METEOSAT Geostationary 1-5 km Every 30 minutes Hemisphere 5 4 12 free NIAA , FY-2B Polar 1 km 2 times a day 2500 km 6 14 free Landsat, SPOT, CBERS Polar 2-30 m Every 16 days 60-180 km costly IKONS, Quickbird Polar 0.6-1 m Every 16 days 11 km 5 4 costly MODIS Terra/Aqua Polar 250-1Km 2 times a day 2300 km 36 free
2.2.2. SOFTWARE SYSTEMS TO READ AND VIEW HDF FILES
MODIS data is not just one image file but a set of image files and scientific data files that are saved in hierarchical data format (HDF file type). Therefore, software systems are provided for reading and displaying the HDF
22
files for the different purposes listed below. There is more information about these software systems in Appendix A.
MODIS REPROJECTION TOOL
MODIS REPROJECTION TOOL SWATH HDF-EOS WEB-BASED SUB-SETTER SPOT - SUBSETTABILITY CHECKER MODIS LDOPE TOOLS
HDFLOOK
HDF-EOS TO GEOTIFF CONVERTER HREPACK
HDF-EOS TO GEOTIFF CONVERTER HREPACK
MATLAB
MATLAB is widely used in research, because it includes an enormous number of tools, has a flexible easy to use user interface and has a useful help library. It also provides access to HDF files. In this study the MATLAB HDF, image processing and neural network tools have been used for detection of dust storms as described below.
HDF Tools in MATLAB provide two options for reading HDF files. The first uses a GUI to browse for HDF files, as shown in Figure 2-3.
23
Figure 2-3 HDF GUI Tool
After reading an HDF file, the HDF Tool provides information about the file as shown in Figure 2-4.
24
After the HDF tool has read an HDF file, the individual bands can be imported to MATLAB workspace, for subsequent processing. Alternatively, the command line can be used to read bands from the HDF file using the hdfread function.
2.3. OVERVIEW OF PREVIOUS DUST STORM DETECTION WORK
Satellite remote sensing is the common method for monitoring dust storms but its use for identifying dust storms over sandy ground is still limited as the two share similar characteristics. Many researchers have proposed methods aiming to distinguish dust storms from clouds, ground and water surfaces using images from instruments such as MODIS [8, 9], MERIS [8], TOMS [7], SeaWiFS [24], GOES [25] and images from satellites such as NOAA-AVHRR [26], Landsat and GMS [27].
2.3.1. DUST STORM DETECTION USING MODIS DATA
Several methods have been presented for the detection of dust storms based on thresholding some quantity calculated using data from a few of the 36 spectral bands provided by the Moderate Resolution Imaging Spectroradiometers (MODIS) on board the Terra and Aqua satellites at pixel resolutions varying from 250m to 1km. Calibrated spectral radiance data provided in the thermal emission bands can be used to calculate a corresponding Brightness Temperature (BT) by assuming the radiation is emitted from a surface behaving like a blackbody with emissivity of 1.0.
Reference [25] describes what was then (2003) a new dust enhancement technique to create the Naval Research Laboratory’s 1-km Dust Enhancement
25
Product (DEP) over land and water during daytime. Compared against standard visible (0.65 m) images, the DEP over land algorithm provides an improved ability to distinguish areas of dust from water and ice clouds and bright desert backgrounds by using false colour images as an enhancement technique formed using high spatial and spectral resolution digital data from MODIS. To enhance dust storms over land, the DEP technique is based on the following physical attributes: (1) elevated dust produces a depressed BT against the hotter land background temperature; (2) dust can be differentiated from water clouds having the same radiometric temperature by the colouration properties of mineral dust; (3) dust storms often have positive values of Brightness Temperature Difference (BTD) (between 12 µm and 11 µm) and (4) the additional infrared (1.38 µm) information from MODIS enables the dust signal to be separated from the other spectrally similar components of the scene. The DEP over land algorithm is generally applicable to any satellite having the requisite spectral bands. On the other hand, it has some limitations for detecting dust storms: (1) it is useful only during daytime, (2) some parts of cold terrain can appear falsely enhanced; (3) the sun glint area is prescribed, and the true area is a dynamic function of local sea surface state; (4) in terms of Brightness Temperature differences, not all dust pixels have large positive values, depending on opacity and background; (5) dust storms that are viewed at longer optical paths generate stronger enhancements; and (6) DEP is unable to detect dust storms underneath clouds.
26
Reference [9] presents a method for the Automatic Detection of dust storms in the northwest of China using a decision tree classifier with features comprising the difference between bands 7 and 3, the Normalized Difference Snow Index (NDSI) and the quantity defined in equation 2-1
Equation 2-1.
where bn represents a band number. The decision tree discriminates areas of land, dust storms, cloud and snow. A weakness of this study is that the weak dust regions are not easily distinguished from the surface, because the lower dust content in these regions does not cover the surface sufficiently. Furthermore, cloud shadow and surface are mixed up with detected dust, so further improvement is still needed.
Reference [28] describes a method for detecting and separating dust storms from cirrus cloud over the Gobi desert using a combination of reflective and emissive MODIS bands. This method used the D-parameter technique based on equation 2-2
Equation 2-2.
where rr is the ratio of the reflectances at wavelengths of 0.54µm and 0.86µm, a is a scaling factor which is equal 0.8 and b is an offset derived from the wavelength difference 11µm – 12µm related to BTD which is numerically equal to 2. Using the D-parameter makes it possible to separate cirrus clouds from high altitude airborne dust using a threshold of 1.
27
Reference [29] investigated a method that can distinguish sand and dust from cloud and surface, also determining the scope and intensity of sand and dust storms from MODIS images. The normalized difference snow index (NDSI) and the dust sand index (DSI) were used in this method to detect dust storm from cloud and land surface. The NDSI and DSI are defined in equations 2-3 and 2-4 respectively.
Equation 2-3.
Equation 2-4.
where Bn is a band number. This method was applied on the China dust storm event which occurred on 27th of March 2004. The results show this method to be very effective for the detection and scope of dust storms over China, also it can determine the intensity of sand and dust storms using multiple thresholds where the intensity is divided into different levels from weak to heavy. However, this method was less effective when it was applied to dust storm events occurring over sandy land.
Reference [1] proposes a method based on the Normalised Difference Dust Index (NDDI) for the detection of sand dust storms in the north of China by combining the Terra and Aqua MODIS solar reflectance band (SRB) measurements, which is defined in equation 2-5.
28
To identify airborne and ground sand and dust, these authors use a threshold of 275K on the BT using MODIS band 31 to detect airborne or ground sand and dust. The NDDI index is effectively a method for separating SDS from water/ice clouds and ground features except sandy ground. Although, this method can be useful for the detection of dust storms over non-sandy ground, it does not give good results over sandy ground such as the Sahara desert, even when enhanced using the BT calculated from band 31. So, if this technique is to be used successfully over surfaces such as the Sahara, it seems likely that extra bands will be needed.
Reference [2] describes the use of Terra and Aqua MODIS level 1B thermal infrared data (TIR) at wavelengths of 8.5µm, 11µm, and 12µm for detecting and monitoring dust storms in the north of China. It is found that combining the BTD between 8.5µm and 11µm with the BTD between 11µm and 12µm can be used to detect dust storms in northern China during both day and night. However, this method is less effective for detection of dust storms over sandy land.
Reference [30] describes an investigation of the dust storm which occurred on 7 April 2001 in the north of China using the MODIS thermal infrared bands 29, 31 and 32. A dust storm mask algorithm was developed to identify dust storms using the BTD between bands 29 and 31 and the BTD between bands 31 and 32. BTD values between bands 31 and 32 of less than -0.5 and BTD values between bands 29 and 31 of greater than 0 represent a strong dust region, while BTD values between bands 31 and 32 of less than -0.5 and BTD
29
values between bands 29 and 31 of less than 0 represent a weak dust region. Other cases represent cloud, or other unknown surface. This algorithm can be used to identify dust storms, such as the one investigated, during both day and night over non sandy areas.
Reference [31] describes the use of a BTD technique to detect and monitor desert dust using infrared MODIS and SEVERI data. The BTDs used in this study are from bands 20 and 31, bands 29 and 31 and bands 31 and 32. Several thresholds were created to classify a data pixel as dusty or not dusty. The BTD between 31 and 32 for dust storm is generally negative over land and smaller than -0.5K over sandy land. The BTD between 20 and 31 for dust storm during the day is positive, while the BTD between 29 and 31 is also negative. The results show that more work is needed to improve the quality of dust storm detection. However, this method can be used for monitoring dust storms.
Reference [32] describes an integrated approach for separating dust from clouds during both day and night using MODIS thermal infrared bands. This method is based on the spectral variability of dust emissivity in bands 20, 29, 31 and 32. A combination of three methods was used to identify dust and cirrus cloud. The first method used the D*-parameter (defined by equation 2-6) test for detecting dust storms at night
Equation 2-6.
where C and E are the thermal offsets for BTDs between bands 31 and 32 (BTD31-32) and bands 29 and 31 (BTD29-31), respectively. Dust storm and cloud