U.S. BILATERAL TRADE WITH ITS MAJOR TRADING PARTNERS AND RUSSIA
A Thesis
Submitted to the Graduate Faculty of the
North Dakota State University of Agriculture and Applied Science
By
Valentina Belousova
In Partial Fulfillment of the Requirements For the Degree of
MASTER OF SCIENCE
Major Department:
Agribusiness and Applied Economics
February 2011
North Dakota State University
Graduate School
Title
U.S. Bilateral Trade With Its Major Trading Partners and Russia
By
Valentina Nikolaevna Belousova
The Supervisory Committee certifies that this disquisition complies with North Dakota State University's regulations and meets the accepted standards for the degree of
MASTER OF SCIENCE
SUPERVISORY COMMITTEE:
ebb
ChairApproved by Department Chair:
ABSTRACT
Belousova, Valentina; M.S.; Department of Agribusiness and Applied Economics; College of Agriculture, Food Systems, and Natural Resources; North Dakota State University; February, 2011. U.S. Bilateral Trade with Its Major Trading Partners and Russia. Major Professor: Dr. Won Koo.
This study examines U.S. exports and imports to/from its major 15 trading partners and Russia. To analyze U.S. export and import flows the gravity model approach is used. Factors affecting U.S. bilateral trade flows with its 16 trading countries are evaluated using Generalized Method of Moments (GMM). Annual data from 2000 to 2009 are used for this study. Goods traded between the U.S. and its trading partners are disaggregated into three groups based on the Standard International Trade Classification (SITC).
Results show that major factors affecting both U.S. export and import flows are distance and change in polity score. Also U.S. exports are influenced by U.S. trading partner Gross Domestic Product (GDP) for agricultural (AGR) and middle sector (MID)
groups. U.S. foreign direct investment is a complement for U.S. exports of final (FIN) group and at the same time it serves as substitute for U.S. exports of AGR. On the other hand, U.S. imports of AGR and foreign direct investment (FD!) from 16 trading
partners to the U.S. are substitutes. This study also reveals that the U.S. and Russia bilateral trade could be improved through economic growth in both countries, improving political cooperation and increasing inward and outward FD!.
ACKNOWLEDGEMENTS
I would like to thank my major adviser, Dr. Won Koo, for his support, guidance and understanding. I appreciate the help from my committee members, Dr. Saleem Shaik, Dr. Robert Herren and Dr. John Bitzan for their contribution and constructive comments.
I particularly thank my beloved mother, Natalya Belousova, who has supported me in every step of his Jong process. Special thanks are given to Evgeny Yurtaykin for his encouragement and infinite optimism.
This thank you is also for my friends. My thanks are extended to Dr. Oleksiy Tokovenko for his precious advice and amazing cooking talent. A special thank you to my best friend Ana1s, to Yan, Xia, Dan, Anna, Ashley and Tom, who made my stay in Fargo enjoyable and fu11 of amazing cultural discoveries.
TABLE OF CONTENTS
ABSTRACT ... iii
ACKNOWLEDGEMENTS ... iv
LIST OF TABLES ... vii
LIST OF FIGURES ... ix
CHAPTER I ... INTRODUCTION Objective ... 5
Method ... 5
Organization ... 5
CHAPTER 2 ... U.S. TRADE WITH ITS 16 TRADING PARTNERS 7 Russia's Macroeconomics ... 7
Characteristics of U.S. Trade with Russia ... 22
Characteristics of U.S. Trade with Its Main 15 Trading Partners .... 31
CHAPTER 3 ... LITERATURE REVIEW 36 CHAPTER 4 ... THEORETICAL FRAMEWORK AND MODEL 45 Theoretical Framework ... 45
Specification of a Gravity Model.. ... .47
CHAPTERS. DATA AND ECONOMETRIC PROCEDURE ... 57
Data Description ... 57
Specification of Generalized Method of Moments (GMM) ... 59
CHAPTER 6. EMPIRICAL RESULTS ... 66
U.S. Trade with Its Trading Countries ... 66
U.S.-Russia Bilateral Trade ... 72
CHAPTER 7. CONCLUSIONS ... 79
Need for Further Study ... 80
REFERENCES ... 82
APPENDIX A.VARIABLE ST A TISTICS ... 90
LIST OFT ABLES
2.1 The Russian Economy at a Comparative Glance in 2009 ... 8
2.2 Foreign Direct Investment in Russia, 1999-2009 ... 15
2.3 Russian Exports and Imports at a Comparative Glance, 2009 ... 20
2.4 U.S.-Russia Bilateral Trade at a Comparative Glance, 2009 ... 26
2.5 List of U.S. Main Trading Partners in 1999 and 2009. ($Billion) ... 32
4.1 Hypotheses Tested in the Model ... 55
5.1 Moment Equations for U.S. Exports and Imports ... 65
6.1 Estimation Results for U.S. Exports ... 67
6.2 Estimation Results for U.S. Imports ... 67
6.3 Ranking of U.S.-Russia Bilateral Trade ... 73
6.4 Significance of the Variables in the Gravity Model ... 73
A. I Brazil.. ... 90 A.2 Canada ... 91 A.3 China ... 92 A.4 France ... 93 A.5 Germany ... 94 A.6 India ... 95 A.7 Italy ... 96 A.8 Japan ... 97
A.9 South Korea ... 98
A. IO Mexico ... 99
A.11 Netherlands ... 100
A.12 Russia ... 101 A.13 Singapore ... I 02
A.14 Taiwan ... l 03
A.IS UnitedKingdom ... 104
A.16 Venezuela ... 105
Bl. U.S. Exports of AGR to Its 16 Trading Partners, Million of U.S. Dollars ... 106
B2. U.S. Exports of MID to Its 16 Trading Partners, Million of U.S. Dollars ... 106
B3. U.S. Exports of FIN to Its 16 Trading Partners, Million of U.S. Dollars ... 107
B4. U.S. Imports of AGR to Its 16 Trading Partners, Million of U.S. Dollars ... I 07 BS. U.S. Imports of MID to Its 16 Trading Partners, Million of U.S. Dollars ... 108
LIST OF FIGURES
2. I Gross Domestic Product of the U.S., Its 2009 Year Five Main Trading Partners and Russia 1999-2009 ... 9 2.2 Russian Gross Domestic Product, I 992-2009 ... I 0 2.3 Annual Gross Domestic Product Growth of the U.S., Its Two Main Trading
Partners and Russia ... I 0 2.4 Gross Domestic Product per Capita in 2009 of the U.S., Its 15 Trading Partners
and Russia. ($) ... 11 2.5 Gross Domestic Product per Capita U.S., Its 5 Main Trading Partners and Russia
in 1999-2009 ... 12 2.6 Inflation in Russia, Average Consumer Prices ... 13 2. 7 Consumer Price Index (2000= I 00) Annual Average of the U.S. Its 15 Main
Trading Partners and Russia in 1999 versus 2009 ... 13 2.8 Comparison of Inflation in Russia and the U.S., Average Consumer
Prices ... 14 2.9 Foreign Direct Investment, Net, Balance of Payments ... 15 2.10 Foreign Direct Investment, Net Inflows ... 15 2.11 U.S. Direct Investment Position Abroad to Its 15 main Trading Partners and
Russia in 1999 on a Historical-Cost Basis. ($Million) ... 17 2.12 U.S. Direct Investment Position Abroad to Its 15 Main Trading Partners and
Russia in 2009 on a Historical-Cost Basis. ($Millions) ... 18 2.13 Foreign Direct Investment Position to the U.S. from Its 15 Major Trading
Partners and Russia in 1999 and 2009 on a Historical-Cost Basis ... 19 2.14 Russian Exports and Imports of Goods and Services ... 19 2.15 Countries' Place in the World Exports of Merchandise in 2009. Comparison of
U.S., Its 15 Main Trading Partners and Russia ... 20 2.16 Countries' Place in the World Imports of Merchandise in 2009. Comparison of
U.S., Its 15 Main Trading Partners and Russia ... 21 2.17 Relative Share of U.S. Trade Value with Russia in Its Total Trade Value with
All Countries, 1992-2009 ... 27 2.18 The U.S. Balance with Russia for SITC All Merchandise, 1992-2009 ... 27
2.19 Relative Share of U.S. Exports to Russia in Total U.S. Exports to All
Countries, 1992-2009 ... 28
2.20 Composition of U.S. Exports to Russia in 1999 and 2009 ... 29
2.21 Relative Share of U.S. Imports from Russia in Total U.S. Imports from All Countries, 1992-2009 ... 30
2.22 Composition of U.S. Imports from Russia, 1999 and 2009 ... 31
2.23 Relative Share of U.S. Trade Value with 5 Main Trading Partners in Its Total Trade Volume with All Countries, 1992-2009 ... 33
2.24 U.S. Exports to the World of SITC ( 1-9) All Merchandise, 2009. ($Billion) ... 33
2.25 Relative Shares of U.S. Exports to Its Five Major Trading Partners in Total U.S. Exports to All Countries, 1992-2009 ... 34
2.26 U.S. Imports from the World of SITC ( 1-9) All Merchandise, 2009, ($Billion) ... 35
2.27 U.S. Imports from Its Five Major Trading Partners, 1992-2009 ... 35
6.1 U.S. Exports of FIN to Its 16 Trading Partners and GDP of the 16 Trading Partners ... 68
6.2 U.S. Imports of MID from Its 16 Trading Partners, U.S. Dollars and GDP, and GDP of the 16 Trading Partners ... 69
6. 3 Exchange Rate Index. (2000 Ba sis) ... 7 1 6.4 Distance between U.S. and Its 16 Trading Partners ... 74
6.5 Average GDP for 2000-2009 of the U.S.16 Trading Partners ... 75
6.6 Average FD! for 1999-2009 into AGR from the U.S. to Its 16 Trading Partners .... 75
6.7 Average FD! for 1999-2009 into FIN from the U.S. to Its 16 Trading Partners ... 75
6.8 Average FD! for 1999-2009 into AGR from Trading Partners to the U.S ... 76
6.9 Average Polity Score Index of the U.S. 16 Trading Partners, 1999-2009 ... 77
CHAPTER 1. INTRODUCTION
Foreign trade is an important component of any economy, generally accounting
for a significant share of GDP. Importance of U.S. trade with other countries is well
established with the existence of multilateral and bilateral trade agreements with other
countries. Even though there are established trade agreements the volume of trade
between the U.S. and other countries has either increased, decreased or remained
neutral. The reasons for increasing, decreasing and neutral trade flows have yet to be
examined in a comprehensive way. In this study it is proposed to first identify a set of
factors and evaluate importance of these factors in the bilateral trade flows.
All the countries could be divided into three groups: those who have
a) High trade volume with the U.S.;
b) Low trade volume with the U.S.;
c) No trade with the U.S. (countries against which the U.S. has embargo).
This study focuses on the U.S. and Russia bilateral trade. Russia has been one of
the world's largest and fastest growing economies in transition in recent years. It is on
track to join the World Trade Organization (WTO). Being in the list of 10 largest
economies in the world the U.S. and Russia bilateral trade volume and levels of foreign
direct investment are surprisingly low.
Identification of the factors effecting trade flows between countries would allow
quantifying the extent of the importance of these factors. Second and more importantly
this study will help to understand how the U.S. can expand its market access to Russia.
Although Russia's economic and political strength has been diminished a lot
since the Soviet period, its influence seems to be growing recently. Russia's economy is
large enough to effect global economy. Many countries are highly dependent on
the U.S. However, national interests of these two countries do not always match, creating a hostile political environment.
The Bilateral Presidential Commission established in April 2009 is expected provide policy alternatives which increase trade and investment between the U.S. and Russia. Russia remains one of the most promising markets for U.S. exporters. In 2009, Russian GDP per capita was the highest among the BRIC (Brazil, Russia, India, and China) countries (Gosling, 20!0). Before 2009, Russia had a continuous economic growth for nine years ( 1999-2008). Russia's GDP was increasing at approximately 7% annually for that period (U.S. Department of state, 20!0).
Russia's economic prospects have direct and indirect implications for the U.S. One way to measure the direct implications is by examining the status of U.S.-Russian economic ties. U.S.-Russian trade and investment flows have increased in the post-Cold War period reflecting the changed U.S.-Russian relationship. In recent years, trade between Russia and the U.S. has grown fast but it is still on a low level. In 2008, Russia accounted for about 0. 7% of U.S. exports and 1.3% of U.S. imports. On the other hand, U.S. accounted for 3.4% of Russian exports and 5.4% of Russian imports. U.S. imports from Russia have risen 19% annually since 2000 (U.S. Department of Commerce, 20l0b). U.S. imports from Russia have increased substantially, rising from $0.5 billion in 1992 to a peak of $26.8 billion in 2008. The large increase in U.S. imports reflects not so much an increase in the volume of trade but the rise in world prices of raw materials, particularly oil, that comprise the bulk of those imports (64% in 2008). Russian exports to the U.S. were down 32% in 2008 ($ l 8.2 billion).
U.S. exports to Russia have increased 22% per year on average from $2. l bi\lion in 1992 peaking at $9.3 billion in 2008. Major U.S. exports to Russia consist of
experienced a 42% decrease from the 2008 level ($5.4 billion). In some areas, such as agriculture, Russia has become an important market for U.S. exports. Russia is the largest foreign market for U.S. poultry. Furthermore, U.S. exports of energy exploration equipment and technology, as well as industrial and agricultural equipment, have increased. Russian equipment and technology are getting old. That means that demand for these products is expected to grow.
Despite the increase in bilateral trade, U.S. and Russia still account for small shares of each others' FOL Russia accounted for only 0.3% of U.S. FOi stock abroad on average from 2000 to 2008 (Nestmann, 2009). According to Russian government data, by the end of 2008, the United States accounted for 3.3% of total accumulated foreign direct and portfolio investments of Russia and was the eighth largest source of foreign investment (Cooper, 2009). U.S.-Russian investment relations could grow if Russia's business climate improves. Being in a transition period on the way to building free market economy, Russia has some issues to deal with concerning international standards in accounting, intellectual property rights, taxation and many others to make the environment attractive to U.S. investors and businesses.
The importance of Russia's economic policies and prospects to the U.S. also lies in their indirect effect on the overall economic and political environment in which the U.S. and Russia operate. From this perspective, Russia's continuing economic stability and growth can be considered positive for the U.S. in the interrelated global economy. For example, as a major oil producer and exporter, Russia influences world oil prices that affect the U.S. economy. Also the U.S. is concerned about Russian role in U.S. national security interests. Russia is a major supplier of natural gas to many U.S. European allies, which can possibly make them vulnerable to political pressure. In
2006, Russia accounted for 20% of France's, 25% of Italy's, and 36% of Germany's consumption of natural gas (Cooper, 2009).
There are other impediments affecting U.S.-Russia economic relations. Some of them are: history of the cold war, large geographical distance, and lack of cultural ties. At the same time there are institutional impediments: the fact that the U.S. does not grant Russia permanent normal trade relations (NRT) status, and Russia's membership in the WTO.
Russia is the largest and most populous country that is not a member of the WTO. It means that Russia is excluded from the process of making world trade rules. Russia is already in the world trade but it has not engaged in shaping the rules of trade (Putin, 2002).
Moreover, Russia is still subject to restrictions under Jackson-Yanik amendment included in the Trade Act of l 974, which impact on U.S.-Russia trade hasn't been quantified yet (Cooper, 2007). Russia's accession to the WTO is important for the Russian economy since the WTO requires its members to extend mutual unconditional MFN status to one another's exports (Cooper, 2006).
To answer the question "Why is the trade between Russia and U.S. low?" it is necessary to compare it with trade between U.S. and its main trading partners and analyze how different factors influence bilateral trade flows between those pairs of countries. In order to have a better picture of reasons for low U.S.-Russia trade three different aggregated sectors (agricultural goods (AGR), middle-technology (MID), and high-technology manufacturing goods (FIN)) are studied.
Objective
The primary focus of this study is to analyze bilateral trade relationship between the U.S. and its major trading partners, including Russia. Specific objectives of the study are:
a) evaluate main factors influencing U.S. bilateral trade with its main trading partners;
b) analyze economic and political characteristics significantly affecting the U.S. and Russia trade relationship;
c) evaluate some economic variables which could enhance bilateral trade relationship between the U.S. and Russia.
Method
A gravity model for U.S. trade with its major trading partners and Russia is developed for the study to analyze factors affecting U.S. exports and imports to/from those countries. The panel data for 16 countries from 2000 to 2009 was used for the study. Main variables considered in the model are U.S. GDP, GDP of 16 countries, distance, exchange rate, inward and outward foreign direct investment, change in polity score and dummy variables for language and 2009 year. Hausman and Taylor method is used to conduct econometric estimation of the gravity model.
Organization
Chapter 2 will describe main trends in the U.S. trade with its main 15 trading partners and Russia emphasizing how U.S. Russia bilateral trade is different in comparison with U.S. and other countries trading relationship. Previous studies regarding gravity model and determinants of bilateral trade are addressed in Chapter 3. A theoretical framework for bilateral trade and development of empirical model is
presented in Chapter 4. Then Chapter 5 is devoted to the description of data and econometric procedures for estimating the trade model using the Hausman and Taylor method. Results of the econometric analysis are discussed in Chapter 6. Finally, Chapter 7 includes implications and conclusions drawn from the results.
CHAPTER 2. U.S. TRADE WITH ITS 16 TRADING PARTNERS
In that section characteristics of bilateral trade between the U.S., its major trading partners and Russia will be discussed. To understand reasons for U.S. bilateral trade with other countries, it's necessary to have a look at the current situation in their trade with the U.S. Since the focus of this thesis is the U.S. and Russia trade relations, Russian economy characteristics will be discussed in this chapter in more detail.
Russia's Macroeconomics
The Russian economy was one of the fastest growing economies in the world since 1999 until the worldwide recession in 2009. Real gross domestic product (GDP) was increasing 6. 9% annually on average. The growth brought an improvement in economic stability that Russia had not experienced at the beginning of its existence as an independent country. However, the Russian economy experienced negative growth (7.9%) in 2009 (Cooper, 2009).
After the collapse of the Soviet Union, Russia has been existing as an independent country since 1991. The economic crisis that struck all post-Soviet
countries in the 1990s was twice as intense as the Great Depression that the countries of Western Europe and U.S. had in the 1930s. Russia was the only country that took the responsibility for settling the USSR's external debts. Most of the industry was privatized as a result of economic reforms in 1990s and the country moved from a centrally-planned to a market-based economy.
The financial crisis of 1998 brought a 60% decline in the value of the ruble decreasing flows of FDI, delayed payments on sovereign and private debts, and the threat of runaway inflation. However, Russia was revived from 1998 crisis fast and paid off its entire Soviet-era Paris Club debt of $22 billion in late 2006 (U.S. Department of state, 2010).
There are still lots of problems in the country such as weak private sector,
reliance on commodity exports as the main source of country income, high inflation,
weak protection of property rights and many others. However, some progress in
building the market economy is achieved. The main characteristics of the Russian
economy in comparison with the U.S. and its two major trading partners Canada and
China are described in Table 2.1. In 2009 Russia had smaller nominal GDP, real GDP
growth rate than China, Canada and the U.S. Moreover, Russia's inflation was highest
out of these three countries.
Table 2.1 The Russian Economy at a Comparative Glance in 2009
Russia China GDP in current prices, billion of U.S. dollars* 1229.23 4908.98
-Place in the world 12 3
-Place among 16 U.S. trading partners 10 2
Real GDP Growth Rates* -7.90 9.10
Per Capita GDP current prices, U.S. dollars* 8693.80 3677.86
-Place in the world 59 98
-Place among 16 U.S. trading partners 12 15
Consumer Price Index (CPI)* 304.24 119.60
Inflation, o/o* 11.65 -0.69
U.S. Outward FDI (million of U.S. dollars)** 21328 49403
-Place among 16 U.S. trading partners 13 IO
U.S. Inward FDI (million of U.S. dollars)** 7792 791
-Place among 16 U.S. trading partners 11 15
Canada 1336.43 10 8 -2.50 39668.62 18 5 119.97 0.29 259792 3 225836 4 USA 14256.28 -2.60 46380.91 9 124.60 -0.32
*Source: International Monetary Fund, World Economic Outlook Database, April 2010 **Source: U.S. Bureau of Economic Analysis. (June 25, 2009). International Economic. Accounts Data: U.S. Direct Investment Abroad and Foreign Direct Investment in the U.S.
In 2009 agriculture composed 4.7% of Russian GDP, industry 34.8%, services
U.S. trading partners and number 23d in the world ($195.907 billion) in 1999. Figure 2.1 shows the development of Russian GDP in comparison with the U.S. and its five
main trading partners.
16,000 I'.: 14,000 .!E 0 12,000 Cl 0 10,000 :::, 0 8,000 C ~ 6,000 ;;;
-
4,000 C i" 2,000 3 u 0 a, 0 ,-< a, 0 0 a, 0 0 c< N N N 8 N M 8 N..
0 0 N Year"'
8 N co 8 N....
0 0 Ng
N ~United States ~Canada -.-China ...-Mexico -Germany a, 8 ~Russia NFigure 2.1 Gross Domestic Product of the U.S., Its 2009 Year Five Main Trading Partners and Russia 1999-2009.
Source: International Monetary Fund. (April, 20 I 0). World Economic Outlook
Database.
In absolute terms Russia was 31" largest trading partner of the United States
(0.46% of the U.S. total trade value in 1999). Since then, the Russian economy grew. In
2009 it was ranked I21
h in the world in value of GDP according to IMF (2010b); it had
10th largest economy in GDP among U.S. main trading partners (Figure 2.1). Also the
country was ranked at number 25 in total trade turnover among U.S. trading partners
(0.90% of U.S. total trade value). Figure (2.2) shows changes in the Russian GDP more
clearly for 1992-2009 period. A sharp growth in nominal GDP after 1999 is attributed
to increase in oil prices and beginning of a political stability period with the new
1800 ~ 1600 .!!! 1400 0 1200 0 vj 1000 ::, 800
-
0 C 600 ~ 400 iii 200 0 YearFigure 2.2 Russian Gross Domestic Product, 1992-2009.
Source: International Monetary Fund. (April, 2010). World Economic Outlook
Database.
GDP Growth
Russian economy had on average a 7% growth since the 1998 financial crisis till
2008 (Figure 2.3). Between the financial crisis of 1998 and global crisis of 2008,
Russian socio-economic indicators were improved, through sound macroeconomic
management and policy changes at the national and regional level (OECD Observer,
2009). 20 10 -10 -20 Year
-+-United States -Canada -.-China ~Russian Federation
N
Figure 2.3 Annual Gross Domestic Product Growth of the U.S., Its Two Main Trading Partners and Russia.
Source: International Monetary Fund. (April, 2010). World Economic Outlook Database.
By 2008 Russian dollar reserves grew to the third-largest in the world (almost
the Russian Federation ("the Fund") was established on January I, 2004 as a part of the
federal budget to be balanced at the time of when oil price falls below a cut-off price.
Furthermore the Fund is an important tool for absorbing excessive liquidity, reducing
negative influence on the economy from volatility of raw material export earnings
(Ministry of Finance of the Russian Federation, 2010).
Russia was extremely vulnerable during the recent global economic downturn,
since its economy is highly dependent on oil prices. In fact, the Russian Federation
went through its worst recession in 15 years, decreasing the GDP by 7.9% in 2009
which was much worse than in the U.S. and its two main trading partners Canada and
China. However, surge in energy price, various stimulus programs and low interest
rates made Russia grew at 2. 9% annually in the first quarter of 20 IO (Trading
Economics, 20 I 0).
GDP Per Capita
Russia is classified as upper middle income country (World Bank, 2010b).
Russia was ranked at number 59 in 2009 by its GDP per capita (IMF, 2010b). In
comparison with U.S. and its main 15 trading partners Russia had 13th in terms of GDP
per capita in 2009 (Figure 2.4).
8693.8 35334.32 35435.145 D United States a Netherlands • France •Germany a Japan l!ICanada • Singapore •Italy II United Kingdom • Korea
42747 .218 a Taiwan Province of China
El Venezuela II Russia D Brazil D Mexico DChina 39731.042 Dlndia
Figure 2.4 Gross Domestic Product per Capita in 2009 of the U.S., Its 15 Trading
Partners and Russia. ($).
Changes in GDP per capita over time for selected developed and developing
countries are presented in Figure 2.5. This Figure shows a stable growth for the period
with the highest value in 2008. Moreover, Russia had the largest per capita GDP among
BRIC (Brazil, Russia, India, and China) countries and is one of the most promising
markets for U.S. exporters. Russia has fewer people than other BRIC countries, but it is
the richest nation among BRIC nations. On average Russian GDP per capita is twice
higher than Chinese and five times higher than Indian (Gosling, 2010).
50000 45000 40000 35000 I'.: 30000 .!)1 0 25000 0 0 20000 ::, 15000 10000 5000 0
P>°' 1:>"
1:,'> -""' 1:,"> ~ 1:,<> 1:,'o _c'/> _C\'b1:>°'
~ '\,G '\,G 'V'- '\,G '\,G '\,G '\,G '\,._,- 'V'- '155 Year -+-United States -Canada -&-China ~Mexico ....+-Japan -Germany -RussiaFigure 2.5 Gross Domestic Product per Capita in the U.S., Its Five Main Trading Partners and Russia in 1999-2009.
Source: International Monetary Fund. (April, 20 I 0). World Economic Outlook
Database.
Consumer Price Index
The Russian economy was bad for the first seven years of Russia's transition
from the Soviet central planned economy (1991-1998) to free market based economy.
During that period, Russia lost about 30% of its real gross domestic product (GDP),
which is similar to a decline of the 1930s Great Depression in the United States. Russia
also suffered very high rates of inflation- over 2000% in 1992 and about 900% in
1993- before it became more tolerable. Inflation was of around 20% by the end of the
However, inflation remained a problem later as the government failed to
constrain the growth of prices between 1999-2007. In 2009 inflation in Russia was
11.7% that is much less then in 2008 (14.1%) but still high (Figure 2.6).
800.00 ~ 600.00 <=
"'
~ 400.00"'
a. 200.00 0.00 YearFigure 2.6 Inflation in Russia, Average Consumer Prices.
Source: International Monetary Fund. (2010). International Financial Statistics Online.
Also shown in Figure 2. 7 Russian inflation in 2009 was much higher than the
inflation in the U.S. and its 15 main trading partners. Russia's economy was hit hard by
the world financial crisis. In 2009 GDP decreased by 7.9% and the government wasn't
able to hold the inflation.
600 500
8
<-< 400"
§
~ 300 ~ 200~
10:~
li9•
~
I ••
~
f •
I
304.24J
•
•2009 1999Figure 2.7 Consumer Price Index (2000=100) Annual Average of the U.S. Its 15 Main Trading Partners and Russia in 1999 versus 2009.
Source: International Monetary Fund. (April, 201 OJ. World Economic Outlook
Figure 2.8 shows distinctly the difference between the U.S. and Russian
inflation levels. Pick of inflation occurred during the period of financial crisis for the
1998-1999 period in Russia. Since 2000, Russia's inflation has remained at less than
20%, but much higher than inflation rate in the U.S.
95 85 75 65
-
C 55 -Russia ru 45 u ~ 0. 35 ~United 25 States 15 5•
•
•
•
•
I•
•
I•
•
•
•-.
-5 1996 1997 1998 1999 2000 2001 2002 2003 2004 2005 2006 2007 2008 2009Figure 2.8 Comparison oflnflation in Russia and the U.S., Average Consumer Prices. Source: International Monetary Fund. (20 I 0). International Financial Statistics Online.
FD! in Russia
Curtis, Griffin, Kornecki (2009) provide an investigation of FD! changing
patterns in Russia between 1994 and the first quarter of 2009. The growth ofFDI in
Russia began only from the first quarter of 2003. Before that the Russian economy was
politically unstable. Tarr and Volchkova (March, 2010) point out that in the first ten
years of transition the inflow ofFDI in Russia was very low compared to Eastern
European countries and the BR!Cs.
Right after the collapse of the Soviet Union, Russia was incurring serious capital
outflow - some $150 billion worth between 1992 and 1999. Russia's investment climate
had improved during the last few years, a byproduct of Russia's robust growth (Cooper,
2009). Table 2.2, Figure 2.9 and Figure 2.10 demonstrate changes in Russian FD!
Table 2.2 Foreign Direct Investment in Russia, 1999-2009 1999 2000 2001 2002 2003 2004 2005 2006 2007 2008 2009 FD!, net inflows 3.3 2.7 2.7 3.4 7.9 15.4 12.8 29.7 (current $ billion) FD! as% I. 7 1.0 0.9 1.0 1.8 2.6 1.6 2.9 of GDP
Source: World Bank. (2010). World Development Indicators.
200 150 ~ .!!! 100 0 0 50 v; :::, 0
-
0 -50 C g -100 iii -150 -200~Canada -China -,tr,• Russia ~USA
Figure 2.9 Foreign Direct Investment, Net, Balance of Payments.
Source: World Bank. (2010). World Development Indicators.
10 8 0. 0 6
"'
a
4-
C ru ~ 2 ru 0. 0 55.1 72.8 37.1 4.2 4.5 3.0 -2 1999 2000 2001 2002 2003 2004 2005 2006 2007 2008 2009~Canada -China -dz-Russia -..-usA
Figure 2.10 Foreign Direct Investment, Net Inflows.
Source: World Bank. (2010). World Development Indicators.
The Figures show that during the period of political stability and strong
economic growth (2000-2008), FD! into the Russian economy has been growing and
terms FD! in Russia is much smaller than in China during the whole period (
1999-2009).
The United Nations Conference on Trade and Development (2009) ranked
Russia among the most attractive locations for FDI in 2009-2011 after China, the
United States, India, and Brazil. In 2008 the largest inward investments in the economy
of Russia were from Cyprus (21.1 % ), Netherlands ( 17 .5% ), Luxemburg ( 13% ), and
United Kingdom (11.6%) as a result of repatriation of Russian funds. According to
Curtis, Griffin, Kornecki (2009), by the end of 2008, the U.S. accounted for 3.3% of
total accumulated foreign direct and portfolio investments in Russia and was the 8th
largest source of foreign investment.
On the other hand, Russia has become the third largest outward investor among
emerging markets after Hong Kong and Singapore. In 2007 Russia's largest outward
investments were in Netherlands (51.9%), Cyprus (13.5%), and U.S. (8.1 %). Curtis,
Griffin, Kornecki (2009) found out that this was influenced by efforts to avoid taxes
and instability of domestic situation.
Risks associated with Russian business environment and recent
import-substitution measures prevent U.S.-Russia relations from improvement.
Macroeconomic risks are caused by Russia's dependence on highly volatile prices of
several commodities, since high share of Russian output and exports is in energy
sectors. In addition, there is a need for Russia to improve its institutional environment.
According to the World bank (2010d) and Transparency International (2010) Russia
ranks 123 out of 183 on the Doing Business Index; 94 out of 155 on the Logistics
Performance Index; and 154 out of 178 on the Transparency International Corruption
Perceptions Index. Finally, in order to diversify the economy the Russian government
and Volchkova (March, 2010), among those are high export taxes on timber to develop
the wood processing industry; increased import tariffs on processed food, light industry
and automotive sectors; use of sanitary and phyto-sanitary measures for protection
against meat imports; increases in agricultural production subsidies; restrictions on
foreign investment in the Russian economy through the introduction of the law of
foreign investment in strategic sectors in 2008.
U.S. Outward FD! to Russia
U.S. FOi to Russia is only 0.3% of U.S. FOi stock abroad on average for the
2000-2008 period (Nestmann, 2009). U.S. FD! increased sharply from 2003 to 2007 but
dropped significantly in 2008 and 2009. It has been concentrated in the mining sector
(53%) over the 2000-2008 period. During these years, another important sector was
manufacturing (16%). For all other sectors, Russia's share was close to or even well
below I% of worldwide U.S. FD! (Nestmann, 2009).
In 1999 Russia was number 53d in U.S. Direct Investment Position Abroad. That
year U.S. investment in Russia was only $1,678 million. This is a much lower than in
any of the U.S. 15 main trading partners (Figure 2.11 ).
• United Kingdom • Netherlands BCanada a Japan •Germany • France II Brazil a Mexico 1B Singapore a Italy .i China m Korea, Republic of DVenezuela DTaiwan Dlndia • Russia
Figure 2.11 U.S. Direct Investment Position Abroad to Its 15 main Trading Partners and Russia in 1999 on a Historical-Cost Basis. ($Million).
Source: U.S. Bureau of Economic Analysis. (June 25, 2009). International Economic. Accounts Data: US. Direct Investment A broad and Foreign Direct Investment in the
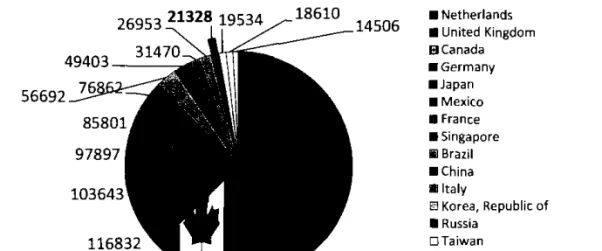
The situation changed for the last 10 years. In 2009 the U.S. invested $21,328
million in the Russia economy. That was higher than investments in other countries
individually: Taiwan, India and Venezuela ($19,534, $18,610 and $14,506 million
respectively) (Figure 2.12). With regard to the stock of U.S. FD!, Russia ranked below
Brazil and China, slightly below India and above Turkey on average for 2000-2008
period (Nestmann, 2009). 14506 56692 • Netherlands • United Kingdom BCanada •Germany •Japan • Mexico • France • Singapore Iii Brazil • China a Italy El Korea, Republic of • Russia D Taiwan Olndia DVenezuela
Figure 2.12 U.S. Direct Investment Position Abroad to Its 15 Main Trading Partners and Russia in 2009 on a Historical-Cost Basis. ($Millions).
Source: U.S. Bureau of Economic Analysis. (June 25, 2009). International Economic. Accounts Data: U.S. Direct Investment Abroad and Foreign Direct Investment in the
us.
Russia's FD! to the U.S.
Data on Russian FD! stock in the U.S. is limited. Media reports and expert
assessments reveal that Russian FD! stock in the U.S. was dominated in the steel sector,
accounting for 90-95% in recent years (Nestmann, 2009). ln 1999 Russia invested $97
million, 0.01% (451h absolute place) of total FD! into the U.S.
In 2009 Russian investment in the U.S. was equal to $7,792 million. Russia's
investment in the U.S. economy was ranked 21'1
(0.34% of total FD! in the U.S.) in
500000 450000 ~ 400000 -" 0 350000 0 vi 300000 :::, 250000 0 200000 C ~ 150000 ':'1 100000 50000 0
~~t~~---Country -• 2009 D 1999
Figure 2.13 Foreign Direct Investment Position to the U.S. from Its 15 Major Trading Partners and Russia in 1999 and 2009 on a Historical-Cost Basis.
Source: U.S. Bureau of Economic Analysis. (June 25, 2009). International Economic. Accounts Data: U.S. Direct Investment Abroad and Foreign Direct Investment in the
U.S.
Trade in Russia
Russia foreign trade has increased sharply in the last nine years ( l 999-2008) and
the country has experienced rapidly increasing trade surplus. During that period Russian
exports grew 4 times from $75.67 billion in 1999 to $303.39 billion in 2009. Imports
grew 4.84 times from $43.59 billion in 1999 to $210.98 billion in 2009 (Figure 2.14).
500.00 450.00 ~ 400.00 -" 350.00 0 0 300.00 vi ::i 250.00
-
0 200.00 C ~ 150.00 iii 100.00 50.00 0.00Figure 2.14 Russian Exports and Imports of Goods and Services.
Russia exported and imported less than China, Canada or the U.S. in 2009
(Table 2.3). At the same time, Russian exports were 12th largest in the world in 2009
(Figure 2.15). Russia has an abundance of natural gas, oil, coal, and precious metals and
various natural resources. Oil and petroleum-related products have dominated Russia's
exports and as a result economy is still commodity-driven despite its growth.
Table 2.3 Russian Exports and Imports at a Comparative Glance, 2009
Exports (billion of U.S. dollars) Imports (billion of U.S. dollars)
Russia 303.39 191.80 China 1201.79 954.30 Canada 314.01 327.20
Source: International Monetary Fund. (2010a). International Financial Statistics
Online. 1 2 1200 3 ~ .'E 1000 0 0 800 vi ::i 600 4 5
-
0 6 7I
8 9 C 400I
I I
10 12 13 ~I
I
I
15 18 21 25 .; 200II
I
I
I
40 0I
-ro,..
~ C w ~ -"' ro E ro ro w 0 C .'!> ..,
ro C C B ro u 'O 1' 'O .8:i:s
u ro 'O -;; ro C. C C _,':l 0 ro.,,
~ ~ ~E
ro ~ ro 0 "O C ~ C. E ~ u ~ ~ w ·;;; a, N ~""
C ro"'
ro ::;; w w"'
~ -5 ,1 u"'
>- C CJ 'O -5 C w B ~ 'O vi > w 0 w ·c z"'
·"
:::, C :::, Country USA 1056.75 1563.00Figure 2.15 Countries' Place in the World Exports of Merchandise in 2009. Comparison of U.S., Its 15 Main Trading Partners and Russia.
Source: CIA-World Fact Book. (2010). Country Comparison: Exports.
The Russian reliance on commodity exports makes Russia vulnerable to highly
volatile global commodity prices. In 2008, oil, natural gas, and other fuels accounted
for 64.8% of Russian exports. If metals are included, the share of raw materials was
78.7% in 2008 (Cooper, 2010).
According to CIA-World Fact Book (2010), Russia is the world's largest
bbl/day) and the U.S. (9.056 million bbl/day). At the same time Russia was second
largest world's exporter of oil (4.93 million bbl/day) in 2009. Russia took second place
in the list of world leaders in natural gas production of2009 in (546.8 billion cum).
The first place in 2009 belonged to the U.S. (593.4 billion cum). However, Russian
was number one exporter ofnatural gas in the world (207.7 billion cum) in 2009.
Moreover, Russia was third largest exporter of steel and primary aluminum in 2009.
Thus Russia's main export commodities are petroleum and petroleum products,
natural gas, grain, wood and wood products, metals, chemicals, and a wide variety of
civilian and military manufactures. The main export partners as of2009 are Netherlands
(10.62%), Italy (6.46%), Germany (6.24%), China (5.69%), Turkey (4.3%), Ukraine
(4.01%).
Because of the world economic crisis Russian imports were much lower in 2009
($191.8 billion) than in 2008 ($291.9 billion) (Figure 2.16). Machinery and equipment
accounted for 43.9% of Russian imports, and food and other agricultural products
accounted for another 16. 9%. The leading import commodities in general are vehicles,
machinery and equipment, plastics, medicines, iron and steel, consumer goods, meat, fruits
and nuts, semi finished metal products. The main importers to Russia in 2009 were
Germany 14.39%, China 13.98%, Ukraine 5.48%, Italy 4.84%, the U.S. 4.46%.
~ 2000 1 'g 1500
I
2 .,; 3 =i 1000I I
4 0 5 6 7 8 C 500 10n
ll 15 16 18 19 ~I
I I
25 51 e; 0I
I
I I
I•
•
•
•
-Figure 2.16 Countries' Place in the World Imports of Merchandise in 2009. Comparison of U.S., Its 15 Main Trading Partners and Russia.
Putin V. in his late years of presidency and the current Russian president Medvedev D. set a goal to modernize the country's economy, reduce its dependence on raw materials exports and developing high technology sector (Levy, 2009).
Characteristics of U.S. Trade with Russia
U.S.-Russia Relations
Contradictory geopolitical issues have historically dominated U.S.-Russia relations. As a result, bilateral trade and investment levels are low. However, bilateral trade between the two countries has grown rapidly in recent years and closer economic relations may help to stabilize the political relationship between Russia and the U.S.
Afterthe collapse of the Soviet Union in December 1991 Russia became an independent country. As a recently appeared democracy it has had a contradictory history of political and economic development. U.S.-Russia relations were not always easy and characterized by some tension most of the time. According to Cooper and Nichol (2010) in early 1990s U.S.-Russia relationship could be characterized as "strategic partnership", followed by difficulties later. After the terrorist attacks September 11, 2001, the two nations reshaped their relationship in order to cooperate against terrorism. However, later tension began to rise because of NATO enlargement, Kosovo's independence, proposed the U.S. missile defenses in Eastern Europe, Iranian and North Korean nuclear issues and nuclear non-proliferation in general (Cooper and Nichol, 20 I 0). In 2008 as a result of Russia-Georgia conflict, U.S.-Russia bilateral ties reached their lowest point since the Cold War. Nevertheless, the situation improved lately. The White House (June 24, 2010) reported that the new presidents agreed to "reset" bilateral relations between the U.S. and Russia in order to improve cooperation.
Despite this cooperation, the two countries still disagree about Moscow's recognition of the independence of South Ossetia and Abkhazia.
Moreover some traces of Cold War such as Jackson-Yanik amendment have not yet disappeared.
Jackson-Yanik Amendment and WTO
A fair amount of literature talks about Jackson-Yanik amendment and Russian nonmenbership in the WTO. Nestmann (2009) gives some reasoning for the low trade volume between the two countries. Among those reasons are geopolitical and historical issues, technological impediments, lack of cooperation between the countries, existence of Jackson-Yanik amendment that implies no permanent normal trade relation status (PNTR) for Russia, lack of Russian economy diversification. The fact that Russia is not a member of WTO influences U.S.-Russia trade negatively (Nestmann, 2009).
Nichol and Cooper in the Congressional Research service report (20 JO)
summarize Russian political, economic situation and their relation to the U.S. interests. In that report authors discuss the problems of Russian accession to the WTO and absence of PNTR for Russia from the U.S. The WTO requires that each member grant to all other members "unconditional" most-favored-nation status (MFN), or permanent normal trade relations status (PNTR). NTR is used to denote nondiscriminatory treatment of a trading partner compared to that of other countries. In fact only a few countries do not have NTR status in trade with the U.S. Nevertheless, the U.S. doesn't grant Russia this status.
Russia's NTR status is governed by Title JV of the Trade Act of 197 4, which includes the Jackson-Yanik amendment (section 402). As Pregelj (2005) explains it was the U.S. reaction to the severe restrictions the Soviet Union had placed in late 1972 on the emigration of its citizens, and was applied to so-called "nonmarket economy" countries.
President waiver, which is based on results of semiannual review of Russia's
compliance with freedom-of-emigration criteria under section 402 subject. (Nichol and Cooper, 2010). Russia will receive "permanent" NTR (PNTR), only if Congress passes and the President signs legislation indicating that Title IV no longer applies to Russia. At the same time, Kyrgyzstan, Georgia, Armenia, Ukraine, China and Vietnam have PNTR (Cooper, 2007).
WTO accession will certainly result in the elimination of the Jackson-Yanik Amendment against Russia as a result of a commercial pressure on the U.S. from its own exporters and investors. In practice, the U.S. has dropped Jackson-Yanik on all countries that have acceded to the WTO with one exception (Moldova).
Russia has a Jong history of negotiations with WTO. The country applied for membership in the General Agreement on Tariffs and Trade (GA TT) in June 1993 which was transformed into the World Trade Organization (WTO) in 1995.
"As of June 2009, there were 153 member countries of the WTO. Trade among them represented 97% of the world's trade value, including over 94% of the foodstuffs. Russia is the largest economy outside the WTO" (Tarr and Yolchkova,2010).
Entering WTO was stated as a one of the priorities by the first Administration of President V. Putin WTO was seen as an important tool for Russia's move toward an open trade and investment model of economic development. The Russian Duma (the lower house of the parliament) passed into Jaw about 42 significant packages of legislation to conform to WTO requirements. Although in 2009 Russia announced that it hopes to accede to the WTO with Belarus and Kazakhstan on the basis of a common external tariff.
A series of studies quantitatively estimate effect of Russia's accession into the WTO. The computable general equilibrium model of the Russian economy numerically
estimated liberalization of barriers against FDI (Jensen, Rutherford and Tarr, 2004). According to the authors' estimation, the gains to Russia from WTO accession are 7.2% of Russian consumption (3.3% of GDP) in the medium run, and 23.6 % of Russian consumption (I 1.0% of GDP) in the long run in their comparative steady state analysis. To understand the sources of these gains, several scenarios are executed in the paper for decomposing the impacts. The results of this analysis indicate that Russia will get most gains from FDI liberalization in services (5.2% of the value of Russian consumption), which amounts for over 70% of the total gains from Russian WTO accession. Also it is concluded in the study that tariff reform is responsible for 1.3% increase in
consumption gain. Improved market access accounts for 0.6% of the welfare gain.
Bilateral Trade Between the U.S. and Russia
On the whole, U.S.-Russian trade and investment flows have increased in the post-Cold War period. U.S. imports from Russia have increased substantially, rising from $0.5 billion in 1992 to $26.8 billion in 2008 (Cooper and Nichol, 2010). However, the pattern of U.S.-Russia trade undergone several different periods. Boyrie, Pak, Zdanowicz (2005) analyzed millions of import/export transactions between the U.S. and Russia for the period 1992-1999. This study tests two portfolio models, Cuddington
(I 987) and Pastor (1990), to explain large capital movements from Russia through trade with the U.S. The problem was especially big in Russia right after disappearance of the Soviet Union. The results showed that the capital flight from Russia to the U.S. during the five-year period studied was $8.92 billion. This resulted from $7.24 billion under-invoiced exports from Russia to the U.S. and $1.68 billion over under-invoiced imports into Russia also from the U.S. The authors suggest that capital movement out of Russia was due to money laundering activities and/or tax evasion.
the 2000-2008 period. Russia and the U.S. account for minor fractions of each other's trade with the rest of the world. On average trade between the two countries in 2000-2008 was equal to $18 billion per year. Nestmann (2009) states that it was more than 13 times lower than total trade volume with China. In 2008, Russia accounted for about 0.7% of U.S. exports and 1.3% of U.S. imports. The U.S. accounted for 3.4% of Russian exports and 5.4% of Russian imports (Cooper and Nichol, 2010). The situation for 2009 is presented in Table 2.4.
Table 2.4 U.S.-Russia Bilateral Trade at a Comparative Glance, 2009
Russia China Canada
U.S. Exports to a Foreign Country (billion
5.33 69.50 204.66
of U.S. dollars)*
-Relative Share** 0.50% 6.58% 19.38%
-Absolute place ** 32 3 1
U.S. Imports from a Foreign Country 18.20 296.37 226.25
(billion of U.S. dollars)*
-Relative Share** 1.17% 19.00% 14.51 %
-Absolute place ** 20 1 2
Total Trade Value between the U.S. and a
23.53 365.87 430.91
Foreign Country (billion of U.S. dollars)**
-Relative Share** 0.90% 13.99% 16.47%
-Absolute place ** 25 2
Source:
*
U.S. Department of Commerce. TradeStats Express. (November 11, 2010).**
Calculated by the author.In recent years, trade between Russia and the U.S. has grown fast but it is still on a low level. Since 2000, U.S. exports to Russia have increased 22% per year on average while U.S. imports from Russia have risen 19% annually. Back in 1999 Russia was 31 '1 largest trading partner of the U.S. by total value. It accounted for 0.46% of U.S. foreign trade. In 2008 Russia was 23'd U.S. trading partner (I .07% of U.S. trade value). As a result of global crisis these numbers decreased in 2009 and Russia was ranked at number 25 (0.9% of U.S. trade value) (Figure 2.17).
1.00%
-
0.80% C"'
i:' 0.60%"'
0.. 0.40% 0.20% YearFigure 2.17 Relative Share of U.S. Trade Value with Russia in Its Total Trade Value with All Countries, 1992-2009.
Source: Data obtained from U.S. Department of Commerce. TradeStats Express. (2010), calculations done by author.
The value of U.S. imports from Russia has been bigger than the value of U.S.
exports. The trade deficit has grown rapidly since 1999 (Figure 2.18). At the same time
the two countries have made some effort to strengthen their economic ties. Russia has
become an important trading partner for the U.S. in agricultural trade.
Major U.S. exports to Russia consist of machinery, vehicles, energy and
exploration equipment, technology, and meat (primarily chicken) (U.S. Department of
Commerce, TradeStats Express, 2010). The experts predict that Russian demand for
that equipment will grow as Russian old equipment and technology need to be
modernized. =o~ 2.00 • . • - • - •
I
J
lJ
I
'Jt
-3.00 ·?)'\, ?),,, ?J"' ?J., ?J~ ~ ?J'I, ·si .
~
-8.00 ,$5 - ,$5 ,$5 ,$5 ,$5~ ~ ~
,; <:s "'<:s "'<:s \l <:s <:s C 0 ,;; -13.00"'
-18.00 Yeart1
Figure 2.18 The U.S. Balance with Russia for SlTC All Merchandise, 1992-2009. Source: U.S. Department of Commerce. TradeStats Express. (2010).
Russia is also the largest foreign market for U.S. poultry. Nestmann (2009)
states that 39% of total U.S. chicken is exported to Russia and 32% of U.S. fertilizer
imports come from Russia. However, Russian restrictions on meat imports (pork,
poultry, beet) imposed recently created tension in U.S.-Russian trade relations.
Russia is an important supplier of a number of raw materials (petroleum and
petroleum products, different types of metals) that are critical to U.S. manufacturers.
However, Russian economy lacks diversification while focusing on oil, gas, and other
natural resources. That implies Russia's significance is relatively small as a supplier of
U.S. imports.
U.S. Exports to Russia
Russia's absolute place as a destination of U.S. exports was 39 in 1999 with
$2.06 billion. At that time Russia accounted for 0.3% of U.S. exports to other countries
(Figure 2.19).
Machinery and Transport Equipment (SITC-7) comprised the largest part of U.S.
exports to Russia in 1999. This group of products made up 51% or 1045.73 millions of U.S.
-
~ <1> t' <1> 0. 0.80% 0.70% 0.60% 0.50% 0.40% 0.30% 0.20% Year ~8
0 0 N NFigure 2.19 Relative Share of U.S. Exports to Russia in Total U.S. Exports to All Countries, 1992-2009.
Source: Data obtained from U.S. Department of Commerce. TradeStats Express. (20 I 0), calculations done by author.
For the last IO years U.S. exports to Russia in SITC-4 and SITC-9 decreased by
97% and I 0%, respectively. U.S. export of SITC-05 group to Russia demonstrated the
largest growth by 940% by 2009 in comparison with 1999. Other groups showed strong
increase as well.
U.S. Imports from Russia
The magnitude and composition of U.S. imports from Russia have changed
during IO years (Figure 2.21 ).
•
1.40% 120% 1.00% -~ 0.80% ~t.
0.60% 040% --0.20% + - - + - - - --- - -- - -0.00%+-~~--,---
·,···r~~~ -0~~~~~~~~~~~~~~~~~ ~~~~~~~~~~~~~~~~~~ YearFigure 2.21 Relative Share of U.S. Imports from Russia in Total U.S. Imports from All Countries, 1992-2009.
Source: Data obtained from U.S. Department of Commerce. TradeStats Express. (20 IO), calculations done by author.
Right after dissolution of the Soviet Union U.S. imports from Russia were even
less than 0.01%. In 1992 U.S. imports from Russia were $0.48 billion which accounted
for 0.09% of U.S. imports from all foreign countries.
By 1999 situation improved, Russia had 281h absolute place among countries
importing to the U.S. (0.58% of total U.S. imports from the world). U.S. imports from
Russia were dominated by SITC-6, SITC-5, SITC-3 with 62%, 14%, 9%, respectively
14000 ~ 12000 -"' 10000 0 Cl .,; 8000 :;;
-
0 6000 C g 4000 2 2000 0---
0 1 2 3 4 5 6 7 8 9 SITC-#Figure 2.22 Composition of U.S. Imports from Russia, 1999 and 2009.
1111999 •2009
Source: U.S. Department of Commerce. TradeStats Express. (November 11, 2010). The situation has changed in 2009. That year total Russian exports to the U.S. increased by three times from 1999 and equaled to $18.20 billion (1.17% of U.S. total imports from foreign countries) down 32% from year 2008. In 2009 Mineral Fuels, Lubricants and Related Materials (SITC-3) comprised the largest part of U.S. imports from Russia. It comprised $13.16 billion or 72% all U.S. imports from Russia in 2009. Second and third places belonged to SITC-6 and SITC-5, respectively (Figure 2.22). U.S. imports of all groups of products from Russia increased. As a result Russia became the zo<h U.S. largest trading partner in terms of imports versus 61" place in 1992.
Finally, U.S.-Russia trade is dominated by inter-industry trade. The U.S. mainly exports skill-intensive products to Russia and imports raw materials from Russia. While Russia and the U.S. each only account for minor fractions of the other's trade with the rest of the world, there are a few products for which bilateral trade is significant.
Characteristics of U.S. Trade with Its Main 15 Trading Partners
The U.S. was the 3'd largest exporter in the world in 2009. Also it took the !"place in the world in imports in 2009 (CIA-World Fact Book, 2010).The relations with each trading partner have been changing over time as a result total trade value with
them has been changing. In 1992 U.S. trade value with all countries was equal to $ l 720.42 billion. At the same time trade value with its main 15 trading partners was equal to $1330.88 billion.
The total trade value increased 1.52 times since 1999. In 2009 U.S. trade value with all countries was equal to $2615.7 billion. At the same time, trade value with its main 15 trading partners was equal to $1878.8 billion. The composition of the U.S. main trading partners has been changing over time (Table 2.5).
Table 2.5 List of U.S. Main Trading Partners in 1999 and 2009. ($Billion)
# Year 1999 # Year 2009 Canada 365.31 Canada 430.91 2 Mexico 196.63 2 China 365.87 3 Japan 188.33 3 Mexico 305.55 4 China 94.90 4 Japan 146.94 5 Germany 82.03 5 Germany 114.80
6 United Kingdom 77.64 6 United Kingdom 93.18
7 Taiwan 54.34 7 South Korea 67.83
8 South Korea 54.14 8 France 60.73
9 France 44.59 9 Netherlands 48.34 10 Singapore 34.44 10 Taiwan 46.85 II Italy 32.45 II Brazil 46.17 12 Malaysia 30.48 12 Italy 38.70 13 Netherlands 27.91 13 Singapore 37.94 14 Brazil 24.52 14 India 37.61
15 Hong Kong 23.18 15 Venezuela 37.37
31 Russian Federation 7.98 25 Russian Federation 23.53
Source: U.S. Department of Commerce. TradeStats Express. (2010).
Figure 2.23 shows the change in U.S. trade value with 5 main trading partner for the 1992-2009 period. U.S.-China bilateral trade was increasing rapidly. In 2003 China surpassed Japan and became the third main trading partner of the U.S. Three years later China was already the second largest trading partner leaving Mexico behind in spite of Mexico's obvious geographic advantage.
Since 1999 U.S. exports to all countries grew by 66% and comprised $1056.04 billion in 2009. The main exported products by category are represented in the Figure 2.24.
22.0% 17.0%
-
C <U u 12.0% :;:; "-7.0% 2.0% N"'
st"' "'
"
<X)"'
"' "' "' "' "' "' "' "'
"' "' "' "' "' "' "' "'
.-< .-< .-< .-< .-< .-< .-< .-< 0 .-< N"'
st"'
0 0 0 0 0 0 0 0 0 0 0 0 N N N N N N Year"'
"
<X) 0 0 0 0 0 0 N N N"'
0 0 N -+-Canada -Japan -Mexico ~China -GermanyFigure 2.23 Relative Share of U.S. Trade Value with 5 Main Trading Partners in Its Total Trade Volume with All Countries, 1992-2009.
Source: U.S. Department of Commerce. TradeStats Express. (2010).
The composition of U.S. exports hasn't changed much over years. The main exported
groups (SITC-7, SITC-5, SITC-8) are still three leading categories, making 41.8%,
15.1%, 11.4% of total U.S. exports in 2009, respectively.
• 7--Machinery And Transport
Equipment
• 5--Chemicals And Related Products • 8--Miscellaneous Manufactured
Articles
• 6--Manufactured Goods Classified
Chiefly By Material • 0--Food And Live Animals
• 2--Crude Materials; Inedible; Except
Fuels
3--Mineral Fuels; Lubricants And
Related Materials
, 9--Commodities & Transactions Not Classified Elsewher
1--Beverages And Tobacco
4--Animal And Vegetable Oils; Fats And Waxes
Figure 2.24 U.S. Exports to the World of SITC (1-9) All Merchandise, 2009. ($Billion) Source: U.S. Department of Commerce. TradeStats Express. (2010).
Lately U.S. exports to its four main trading partners have decreased, however
exports to China have been growth since 2001. Exports to Japan have been decreasing
the most among the U.S. five major trading partners (Figure 2.25).
25% 20% ~Canada
-
C 15%"'
-Mexico t'"'
a. 10% =,,,,.., .. China 5%-
~Japan 0% -United N M.,,.
"'
'°
,.._"' "'
0 r l N M.,,.
"'
'°
,.._"' "'
Kindom"' "' "'
"'
"' "' "' "'
0 0 0 0 0 0 0 0 0 0"' "' "' "' "' "' "' "'
0 0 0 0 0 0 0 0 0 0 r l r l r l r l r l r l r l r l N N N N N N N N N N YearFigure 2.25 Relative Shares of U.S. Exports to Its Five Major Trading Partners in Total U.S. Exports to All Countries, 1992-2009.
Source: U.S. Department of Commerce. TradeStats Express. (2010).
Canada enjoys a substantial trade surplus with the U.S., which absorbs nearly
80% of Canadian exports each year. The U.S. is by far its largest trading partner,
accounting for about 73% of exports and 63% of imports as of 2009 (Statistics Canada,
2010). Canada is the U.S. 's largest foreign supplier of energy, including oil, gas,
uranium, and electric power.
Since 1999 U.S. imports from all countries grew by 66% and comprised
$1,559.62 billion in 2009. The composition of U.S. imports hasn't change with years as
well as the composition of exports. The main exported groups (7, 3,
SITC-8) are still three leading categories generating 41.8%, 15.1%, 11.4% of total U.S.
exports in 2009 (Figure 2.26).
• 7--Machinery And Transport
Equipment
• 3--Mineral Fuels; Lubricants And
Related Materials
• 8--Miscellaneous Manufactured
Articles
• 6--Manufactured Goods Classified Chiefly By Material
• 5--Chemicals And Related
Products
• 9--Commodities & Transactions Not Classified Elsewher 0--Food And Live Animals 2--Crude Materials; Inedible; Except Fuels
!--Beverages And Tobacco 4--Animal And Vegetable Oils; Fats And Waxes
Figure 2.26 U.S. Imports from the World ofSJTC (1-9) All Merchandise, 2009, ($Billion).
Source: U.S. Department of Commerce. TradeStats Express. (2010).
higher than export and it has been growing during the 1992-2009 period (Figure 2.27).
U.S. imports from China have increased sharply. In 2009 China became the main
source of U.S. imports, followed by Canada, Mexico, Japan and Germany.
400.00 350.00 ~ 300.00 -" a 250.00 0 ,,; :j 200.00
-
0 C 150.00 ~ iii 100.00 50.00 0.00 Year -+-Canada -Japan ~Mexico ~China -GermanyFigure 2.27 U.S. Imports from Its Five Major Trading Partners, 1992-2009. Source: U.S. Department of Commerce. TradeStats Express. (2010).
CHAPTER 3. LITERATURE REVIEW
This section is devoted to the review of the literature on international trade and specifically detenninants of bilateral trade. The chapter especially reviews studies which describe different factors influencing international trade and bilateral trade models.
Various international trade studies are trying to find out what is the effect of different variables on bilateral trade flows. Some focus on the effect of exchange rate, others on FD!. political factors and so on.
An analysis by Baek and Koo (2008) explored the short run and long-run relationships between the U.S. agricultural trade balance and U.S. exchange rate, disposable income, U.S. agricultural price and U.S. agricultural production for the period of 1981-2003. The U.S. has been a net exporter for several decades and had a record high agricultural trade surplus of $27 billion in 1996. However, since 1997 U.S. agricultural imports increased by about 50%. The U.S. trade surplus shrunk to $7 billion in 2004. The authors used an auto-regressive distributed lag model (ARDL) model to measure short and long term effect. The results show that the exchange rate, agricultural price, and disposable income have significant impact on U.S. agricultural balance both in the long and short run. That implies that the depreciation of the dollar can improve U.S. competitiveness in agricultural trade.
Another study examines the effects of the Canada-U .S. Free Trade Agreement (CUSTA) and the Canada-U.S. exchange rate on bilateral trade of agricultural goods between the two countries and on U.S. fann income (Kim, Cho and Koo, 2004). After CUSTA took effect in 1989, trade between the two countries increased. However, U.S. imports from Canada grew more than exports, which resulted in a substantial growth of the U.S. agricultural trade deficit. Quarterly data are used, from the fourth quarter of