2015 Intergenerational Report
Australia in 2055
Circulated by
The Honourable J. B. Hockey MP
Treasurer of the Commonwealth of Australia
Page ii
ISBN 978-1-925220-41-4
This publication is available for your use under a Creative Commons BY Attribution 3.0 Australia licence, with the exception of the Commonwealth Coat of Arms, third party content and where otherwise stated. The full licence terms are available from http://creativecommons.org/licenses/by/3.0/au/legalcode.
Use of Commonwealth of Australia material under a Creative Commons BY Attribution 3.0 Australia licence requires you to attribute the work (but not in any way that suggests that the Commonwealth of Australia endorses you or your use of the work).
Commonwealth of Australia material used ‘as supplied’.
Provided you have not modified or transformed Commonwealth of Australia material in any way including, for example, by changing the Commonwealth of Australia text; calculating percentage changes; graphing or charting data; or deriving new statistics from published statistics — then the Commonwealth of Australia prefers the following attribution:
Source: The Commonwealth of Australia. Derivative material
If you have modified or transformed Commonwealth of Australia material, or derived new material from those of the Commonwealth of Australia in any way, then the Commonwealth of Australia prefers the following attribution:
Based on Commonwealth of Australia data. Use of the Coat of Arms
The terms under which the Coat of Arms can be used are set out on the It’s an Honour website (see www.itsanhonour.gov.au).
Other uses
Enquiries regarding this licence and any other use of this document are welcome at: Manager Communications The Treasury Langton Crescent Parkes ACT 2600 Email: [email protected] Internet
A copy of this document is available on the Treasury website at: www.treasury.gov.au. Printed by CanPrint Communications Pty Ltd.
Page iii
Treasurer’s Foreword
I believe that our best years are ahead of us.
To harness the potential of the future we need to prepare and have a plan that aligns with the demographic challenges and opportunities we face. These important issues are clearly identified in the Intergenerational Report.
The Intergenerational Report is the social compact between the generations – children, grandchildren, parents, grandparents and each other.
We are at a critical juncture in our history. To help us make the right choices, the Intergenerational Report sets out what we need to do if we are to maintain and improve our standards of living.
It is fantastic that Australians are living longer and healthier lives but we need to address these demographic changes. If we don’t do something, we risk reducing our available workforce, impacting negatively on growth and prosperity, and our income will come under increasing pressure.
To drive higher levels of prosperity through economic growth, we must increase productivity and participation. If we are to achieve these goals we need to encourage those currently not in the workforce, especially older Australians and women, to enter, re-enter and stay in work, where they choose to do so.
With a growing population that will live longer, the Intergenerational Report shows the growth in the costs of many services, especially in health, that will put pressure on the budget and threaten the sustainability of those services. Every day our spending exceeds Government revenue by more than $100 million. To make up the shortfall we have to borrow that $100 million per day.
If the status quo had remained, the growing debt burden projected in the Intergenerational Report would have been a major drag on our prosperity and a threat to services that our community expects – that is not the social compact we want. In response the Government has set out a credible trajectory to once again live within our means, and much progress has been made.
Our economic plan, aligned with the Intergenerational Report, will allow us to focus on the key drivers of economic growth – participation and productivity.
In responding to the Intergenerational Report, the Government will continue to promote growth, jobs and opportunity so that we can relieve the burden on Australians and unlock the immense potential of our future.
Page iv
(a) The following definitions are used in this report: – ‘real’ means adjusted for the effect of inflation;
– real growth in spending is calculated by the Consumer Price Index as the deflator; and
– one billion is equal to one thousand million.
(b) Figures in tables and generally in the text have been rounded. Discrepancies in tables between totals and sums of components are due to rounding.
(c) References to the ‘States’ include the Territories. (d) GDP refers to Gross Domestic Product.
(e) CPI refers to Consumer Price Index.
(f) Projections are based on the 2014-15 Mid-Year Economic and Fiscal Outlook, adjusted for the following demographic data update:
– Australian Demographic Statistics, June Quarter 2014, ABS cat. no. 3101.0 (released 18 Dec 2014);
– Births, Australia, 2013, ABS cat. no. 3301.0 (released 23 Oct 2014); and – Deaths, Australia, 2013, ABS cat. no. 3302.0 (released 6 Nov 2014). (g) In this report, the term Commonwealth refers to the Commonwealth of Australia.
The term is used when referring to the legal entity of the Commonwealth of Australia.
The term Australian Government is used when referring to the Government and the decisions and activities made by the Government on behalf of the Commonwealth of Australia.
Contents
TREASURER’S FOREWORD ...
IIINotes ... iv
EXECUTIVE SUMMARY ...
VII 1. How will Australia change over the next 40 years? ... vii2. Government budgets over the next 40 years ... xiii
3. Preparing for the future ... xxi
WHAT IS THE INTERGENERATIONAL REPORT? ...
XXIII Understanding long-term projections ... xxvCHAPTER 1:
HOW WILL AUSTRALIA CHANGE OVER THE NEXT 40 YEARS? ... 1
1.1 Demography ... 3
1.2 Participation ... 16
1.3 Productivity ... 23
1.4 Long-term economic projections ... 27
1.5 Managing the environment ... 35
CHAPTER 2:
GOVERNMENT BUDGETS OVER THE NEXT 40 YEARS ... 45
2.1 Projections of the overall budget position ... 46
2.2 Government spending ... 57
2.3 Revenue projections ... 79
2.4 Major balance sheet items ... 83
CHAPTER 3:
PREPARING FOR THE FUTURE ... 89
3.1. Building jobs, growth and opportunity ... 89
3.2. Harnessing further gains in productivity and participation ... 92
Page vi
APPENDIX A:
PROJECTIONS SUMMARY ... 99
APPENDIX B:
SENSITIVITY ANALYSIS OF LONG-RUN ECONOMIC AND
SPENDING PROJECTIONS ... 102APPENDIX C:
METHODOLOGY ... 106
C.1 Demographic and economic projections ... 106
C.2 Aggregate fiscal projections ... 110
C.3 Revenue projections ... 113
C.4 Spending projections ... 117
C.5 Fiscal scenario modelling ... 136
APPENDIX D:
AGE SPECIFIC PARTICIPATION RATES ... 138
Page vii
Executive Summary
Over the past 40 years, Australia has enjoyed strong economic performance, underpinned by a growing population and a series of major reforms.
This economic success has greatly enhanced our quality of life. Average incomes have doubled in real terms since 1975, with this increased wealth shared broadly across the community.
As a result, Australian families enjoy access to a well-functioning health system, good schools, a strong social safety net and options for recreation and leisure that our grandparents could only dream about.
All Australians share aspirations for economic security and an even more prosperous future — a better place for our children and the generations beyond.
But it is not enough that we share this aspiration. We need to make choices today to build a strong and resilient economy and lay the foundation for future prosperity.
1. How will Australia change over the next 40 years?
Chapter 1 of this report outlines projections of the three long-run drivers of economic growth in Australia: our population, participation in the workforce and improved productivity.Understanding how these drivers of economic growth are likely to change over the next 40 years will inform the action governments must take to build jobs, growth and opportunity.
Population
Australia’s population is projected to change and grow over the next 40 years. The changing size and structure of our population is important as it influences how quickly our economy and our incomes grow, and therefore the rate at which our future living standards will increase.
Australians will live longer and continue to have one of the longest life expectancies in the world. In 2054-55, life expectancy at birth is projected to be 95.1 years for men and 96.6 years for women, compared with 91.5 and 93.6 years today.
Page viii
In 2054-55, there are projected to be around 40,000 people aged over 100. This is a dramatic increase, well over three hundred times the 122 Australian centenarians in 1974-75.
Not only will Australians live longer, but improvements in health mean they are more likely to remain active for longer. ‘Active ageing’ presents great opportunities for older Australians to keep participating in the workforce and community for longer, and to look forward to more active and engaged retirement years.
The structure of Australia’s population will also continue to change. This has important implications for the demand for health and aged care services and retirement incomes. A greater proportion of the population will be aged 65 and over. The number of Australians in this age group is projected to more than double by 2054-55 compared with today.
Both the number and proportion of Australians aged 85 and over will grow rapidly. In 1974-75, this age group represented less than 1 per cent of the population, or around 80,000 people. In 2054-55, it is projected that 4.9 per cent of the population, or nearly 2 million Australians, will be aged 85 and over.
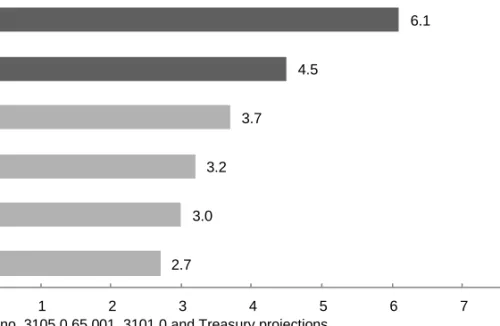
There will be fewer people of traditional working age compared with the very young and the elderly. This trend is already visible, with the number of people aged between 15 and 64 for every person aged 65 and over having fallen from 7.3 people in 1974-75 to an estimated 4.5 people today. By 2054-55, this is projected to nearly halve again to 2.7 people.
Fertility is assumed to remain at around the 2013 rate of 1.9 births per woman. The total fertility rate has remained relatively steady since the late 1970s.
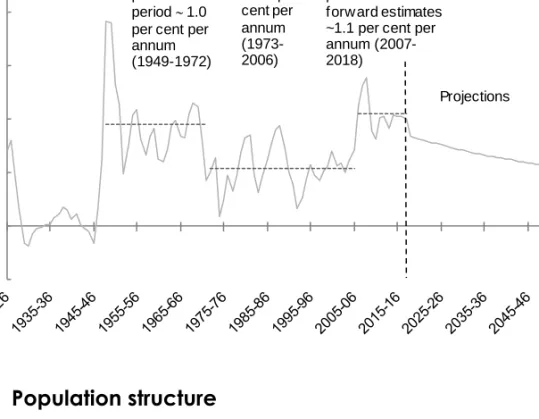
Based on patterns of migration, fertility and life expectancy (mortality), Australia’s population is projected to grow at 1.3 per cent per year, which is slightly below the average growth rate of the past 40 years. If this were to occur, the population would reach 39.7 million in 2054-55, up from 23.9 million today.
Net overseas migration has a significant impact on population projections. Net overseas migration is mainly comprised of permanent migration (including skilled and family) and temporary migration (including temporary skilled and students). The central assumption of this report is that net overseas migration will be 215,000 people a year beyond the current forward estimates, which is based on current permanent migration intake settings.
The permanent migration intake, which was increased significantly during the mining boom, is reviewed each year in the context of the budget to reflect evolving economic and social circumstances. Temporary migration (including temporary skilled and
Page ix students) has also been an important driver of increases in net overseas migration over the past decade.
Participation
Participation refers to the proportion of the population of people aged 15 years and over who are actively engaged in the workforce.
The community and economy will benefit from opportunities to support older Australians who want to work, as well as boosting opportunities for women, young people, parents and people with disability to participate in the workforce. This can be achieved through policies that support people who choose to stay in the workforce for longer, or re-enter it sooner after a temporary absence.
Over the next 40 years, the proportion of the population participating in the workforce is expected to decline as a result of population ageing. A lower proportion of Australians working will mean lower economic growth over the projection period.
By 2054-55, the participation rate for Australians aged 15 years and over is projected to fall to 62.4 per cent in 2054-55, compared with 64.6 per cent in 2014-15.
That said, female employment is projected to continue to increase, following on from strong growth over the past 40 years. In 1975, only 46 per cent of women aged 15 to 64 had a job. Today around 66 per cent of women aged 15 to 64 are employed. By 2054-55, female employment is projected to increase to around 70 per cent.
Nonetheless, Australia’s female participation rates remain lower than some other advanced economies such as Canada and New Zealand, and more can be done to encourage women to enter and stay in the workforce. Policies that help to continue to boost female participation will help Australia achieve an even higher level of future prosperity.
As Australians live longer and do so in better health, more Australians will continue to lead an active lifestyle and participate in the workforce after they reach traditional retirement age.
Participation rates among those aged 65 and over are projected to increase strongly, from 12.9 per cent in 2014-15 to 17.3 per cent in 2054-55. This represents a significant opportunity for Australia to benefit more from the wisdom and experience of people aged over 65.
Page x
Productivity
Of the three key drivers of economic growth, productivity has historically been the most important to Australia’s economic performance. Put simply, productivity is about working more efficiently or producing more or better quality goods and services with the same level of resources.
Australia has enjoyed periods of high productivity growth, which have contributed to growth in incomes and high living standards.
For every hour average Australians work today, they produce twice as many goods and services as they did in the early 1970s. It is no coincidence that average income per person has also broadly doubled in this period.
Technology is changing the way we interact with each other and how we live our lives. It is changing the face of business, markets, governments and social engagement.
In the 1970s, the Internet, mobile phones and social media did not exist as we know them today. Now they are integral parts of our lives and IT-related industries employ nearly as many people in Australia as the mining industry.
Technological advances, such as advanced robotics, 3D printing and self-navigating vehicles have the potential to unlock quality of life improvements.
Harnessing future opportunities to support innovation, adopt new technologies, facilitate foreign trade and investment and foster competition can boost future productivity growth and living standards.
Government policy settings will be very important to helping individuals, businesses and governments take full advantage of opportunities from technological developments so that productivity growth is maintained, or even improved.
During the 1990s, Australia’s productivity growth was especially high, with an estimated average of 2.2 per cent growth per year. This has been widely attributed to economic reforms during the 1980s and 1990s. These reforms created more competitive and flexible markets in which businesses became more efficient and innovative, and new and improved technologies were adopted.
More recently, our productivity growth has slowed, with an average of 1.5 per cent growth per year observed through the 2000s.
This report takes historical productivity growth as a guide, and assumes that average annual labour productivity growth over the next 40 years will be 1.5 per cent. Reforms to enhance productivity over the next 40 years will be crucial if we are to achieve the growth in living standards we have enjoyed since the mid-1970s.
Page xi
Economic projections
Taken together, population, participation and productivity drive the economic growth projections in this report.
With an ageing population, economic growth is projected to be slightly slower over the next 40 years than over the past 40 years. Slower growth is due to slightly lower projected population growth and declining participation rates.
Chart 1 Components of real GDP growth per person
0.3 0.2 -0.1 -0.2 1.5 1.7 0.1 -0.1 0.0 0.0 1.5 1.5 -1 0 1 2 3 4 -1 0 1 2 3 4 Share of population 15+ Participation rate Unemployment rate Average hours worked Labour productivity Real GDP per person
Past 40 years Next 40 years
Percentage point Percentage point
Population Participation Productivity
Source: ABS cat. no. 5206.0, 6202.0 and Treasury projections.
However, it is important to acknowledge that the past 40 years include an unprecedented 23 year stretch of unbroken economic growth that is continuing. This has only been matched by one other advanced country, the Netherlands, which experienced close to a 27 year stretch of unbroken economic growth between 1981 and 2008.
It is also important to keep in mind that the long-term projections look through business cycles and assume a smooth growth path through to 2054-55. In reality, it is almost certain that any economy will go through such cycles over a 40 year time period. However, the outlook to 2054-55 will not be driven by these cycles, but by the underlying trends in population, participation and productivity.
The average annual growth of real GDP is projected to be 2.8 per cent over the next 40 years compared with 3.1 per cent over the past 40 years. Average annual growth in real GDP per person is projected to be 1.5 per cent over the next 40 years compared with 1.7 per cent over the past 40 years.
Page xii
National income growth is expected to slow more markedly than real GDP growth as the decline in the terms of trade takes place during the current decade and the construction phase of the mining boom ends.
Real gross national income (GNI) per person is the measure of how much we earn, not just what we produce. Real GNI per person is projected to grow at 1.4 per cent over the next 40 years, compared with 1.9 per cent over the past 40 years. If this level of growth is achieved over the next 40 years, the annual average Australian income will increase from $66,400 today to $117,300 in 2054-55 in today’s dollars.
Over the next 40 years, changes in the share of population aged 15 and over are projected to make a small positive contribution (0.1 percentage points) to average annual GDP growth per person. This is less than its contribution over the past 40 years.
Increasing participation rates contributed 0.2 percentage points to average growth over the past 40 years. Over the next 40 years declining participation is projected to detract 0.1 percentage points from average growth.
This report illustrates why, over the next 40 years, ongoing improvements in Australian living standards will remain primarily contingent upon continually improving our productivity, and require us to take every opportunity to increase participation rates.
Environment
The environmental changes that unfold over the next 40 years will affect Australians’ quality of life across a range of dimensions.
It is difficult for individual governments to control or affect the collective and cumulative impact of human activity globally, but there is a role for the Australian Government to continue in its efforts in leading and coordinating domestic environmental policies to drive better environmental management and economic growth for the generations to come.
Economic growth and strong environmental outcomes are complementary objectives. Policies that create strong economic growth and a sustainable budget will mean that governments are better placed to invest in environmental protection. Additionally, protecting the environment can also contribute to economic growth, particularly in sectors such as tourism.
Page xiii
2. Government budgets over the next 40 years
Chapter 2 explores the current state of the Australian Government budget and how economic and demographic trends are projected to impact the budget over the next 40 years.
The fiscal position contained in the 2014-15 Mid-Year Economic and Fiscal Outlook (MYEFO) is the starting point of this report. Three scenarios are presented to illustrate the long-term sustainability of alternative policy settings:
• The scenario ‘previous policy’ shows fiscal projections associated with the set of
policies in place prior to the 2014-15 Budget.
• The scenario ‘currently legislated’ shows fiscal projections on the basis of laws
passed by the Australian Parliament. It shows the anticipated fiscal outcomes based on the current state of play, given that a range of policies the current Government announced in the 2014-15 Budget remain unimplemented.
• Finally, the scenario ‘proposed policy’ shows fiscal projections based on the full
implementation of the policies of the government of the day. This scenario follows the usual practice of presenting fiscal projections on the basis of announced policy (as taken to the 2014-15 MYEFO), and assumes all outstanding measures are implemented.
The first two scenarios show an unequivocal deterioration in fiscal sustainability. The third scenario shows that the Government’s current set of policies would bring the budget back to a sustainable path over the medium to long term.
The scenarios show that repairing the budget is possible, and is well underway. However, the policies currently legislated would not see the budget in surplus at any point over the next 40 years. If all outstanding measures — or alternatives of similar value — were implemented, the budget would be on track to a sustainable surplus.
Page xiv
Fiscal aggregates
Under the ‘previous policy’ scenario, by 2054-55, the underlying cash deficit is projected to reach 11.7 per cent of GDP ($532.8 billion in today’s dollars) (Chart 2). However, considerable progress has been made under the ‘currently legislated’ scenario with the underlying cash deficit projected to almost halve to around 6 per cent of GDP ($266.7 billion in today’s dollars) by 2054-55. The ‘proposed policy’ scenario projects the underlying cash balance to improve from a deficit of 2.5 per cent of GDP in 2014-15 to a sustained surplus from 2019-20 to the end of the reporting period.
Chart 2 Underlying cash balance
-12 -9 -6 -3 0 3 -12 -9 -6 -3 0 3 2014-15 2019-20 2024-25 2029-30 2034-35 2039-40 2044-45 2049-50 2054-55 Per cent of GDP Per cent of GDP Proposed policy Previous policy Currently legislated
Note: Net Future Fund earnings are included in projections of the underlying cash balance from 2020-21. Source: Treasury projections. Projections assume trend economic growth from 2021-22 to 2054-55.
Page xv Similarly, under the ‘previous policy’ scenario, net debt is projected to reach 122 per cent of GDP (or $5,559 billion in today’s dollars) by 2054-55 (Chart 3).
The ‘currently legislated’ scenario projects that net debt would more than halve to 60 per cent of GDP (or $2,609 billion in today’s dollars).
If the ‘proposed policy’ scenario were to eventuate, net debt would decline from 15.2 per cent of GDP in 2014-15 to be zero by 2031-32, after which the Australian Government is projected to begin accumulating assets utilising underlying cash surpluses.
Chart 3 Net debt
-50 0 50 100 150 -50 0 50 100 150 2014-15 2019-20 2024-25 2029-30 2034-35 2039-40 2044-45 2049-50 2054-55 Per cent of GDP Per cent of GDP Currently legislated Proposed policy Previous policy
Note: The projections of net debt include net interest payments.
Source: Treasury projections. Projections assume trend economic growth from 2021-22 to 2054-55.
The debt levels in both the ‘previous policy’ and ‘currently legislated’ scenarios would negatively impact economic growth, waste significant resources on interest payments, and leave Australia exposed in the event of an economic downturn. Ireland’s experience during the Global Financial Crisis, which saw gross debt reach 124 per cent of GDP in 2013, is a warning of how rapidly government balance sheets can deteriorate in the face of large economic shocks.
In contrast, the ‘proposed policy’ scenario would afford scope for future governments to reduce taxes and make productivity-enhancing investments to improve the resilience of the budget to future economic shocks.
Nevertheless, we are living beyond our means. The Australian Government is currently spending over $100 million a day more than it collects, and is borrowing to meet the shortfall.
Page xvi
Government expenditure
The report outlines in detail the projected trends in the main items of government spending.
Over the next 40 years, Australian governments will face increasing fiscal pressures as the population grows and ages. The report considers the anticipated patterns of spending across the programs most affected by demographic factors: health expenditure, Age and Service Pensions and aged care funding.
Based on ‘previous policy’, the ratio of payments to GDP would have been on track to reach 37.0 per cent in 2054-55. This would be dramatically higher than the historic high of 27.6 per cent in 1984-85. If left unchecked, this would mean drastic future cuts to payments, higher taxes, or both.
Australian Government real health expenditure per person is projected to more than double over the next 40 years.
Australian Government health expenditure is projected to increase from 4.2 per cent of GDP in 2014-15 to 5.5 per cent of GDP in 2054-55 under the ‘proposed policy’ scenario. In today’s dollars, health spending per person is projected to more than double from around $2,800 to around $6,500. State government expenditure is also expected to be significantly higher.
If no changes to policy had been made, health expenditure was on track to reach 7.1 per cent of GDP in 2054-55 under the ‘previous policy’ scenario.
The report explains how non-demographic factors, including higher incomes, health sector wages growth and technological change, are more significant drivers of the projected increase than demographic changes. The area of largest growth is Medicare services, which is projected to increase by over 15 per cent per person in real terms over the next decade.
Payments made through Age and Service Pensions are projected to increase each year. In today’s dollars, spending per person is projected to increase from almost $2,000 in 2014-15 to around $3,200 in 2054-55. As a share of GDP, these payments are expected to broadly stabilise. This is as a result of the structural changes to indexation and age of eligibility proposed in the 2014-15 Budget.
Age and Service Pension payments are currently equal to 2.9 per cent of GDP. In the ‘proposed policy’ scenario, this is projected to stand at 2.7 per cent of GDP in 2054-55, when real incomes per person will be much higher. If the structural changes to indexation and age of eligibility are not implemented, spending is projected to continue rising over the period, reaching 3.6 per cent of GDP by 2054-55.
Page xvii A significant change over the past 40 years has been the increase in the number of people accessing aged care services. The Australian Government provides aged care funding for residential aged care and a range of community care services, including care in the home. Australian Government expenditure on aged care has nearly quadrupled since 1975. Expenditure is projected to nearly double again as a share of the economy by 2055, as a result of the increase in the number of people aged over 70. Specifically, under the ‘proposed policy’ scenario, expenditure is projected to increase from 0.9 per cent of GDP in 2014-15 to 1.7 per cent of GDP in 2054-55, and from $620 to $2,000 in real, per person terms.
A range of Australian Government programs provide income support to individuals, for example Family Tax Benefit and the Disability Support Pension. Successive governments have taken steps to make payments to individuals more sustainable.
Total Australian Government payments to individuals, excluding the Age and Service Pensions, are projected to fall as a proportion of GDP as a result of changes in the structure of the population and rising incomes. This result is in line with the 2010 Intergenerational Report. Under the ‘proposed policy’ scenario, expenditure is projected to fall from 4.5 per cent of GDP in 2014-15 to 3.2 per cent of GDP in 2054-55. If the 2014-15 Budget measures remain unimplemented, projections in the ‘currently legislated’ scenario show that expenditure on payments to individuals are projected to fall less, to 3.4 per cent of GDP by 2054-55.
In aggregate, Australian Government spending on education and training is projected to be maintained in real terms per person over the reporting period. Once higher education and vocational education loans are also taken into account, the amount the Australian Government provides per person (in today’s dollars) is projected to rise from $1,500 in 2014-15 to $1,900 in 2054-55.
Total government spending on the National Disability Insurance Scheme (NDIS) is projected to increase rapidly from less than 0.1 per cent of GDP in 2014-15 to 1.1 per cent in 2019-20. Spending on the NDIS is then projected to be broadly stable at 1.1 per cent of GDP between 2019-20 (when fully operational) and 2054-55. The Australian Government’s contribution is projected to grow as a proportion of the total NDIS spending, increasing from under 55 per cent in 2019-20 to around 75 per cent in 2054-55.
Consistent with government policy, defence expenditure is projected to remain at 2 per cent of GDP through to 2054-55.
Page xviii
Revenue
The Australian Government collects the majority of Australia’s taxation revenue. The largest source of taxation revenue for the Australian Government is income taxes, comprising taxes on both personal income and corporate income. The Australian Government also taxes goods and services.
The composition of Australian Government taxes and heavy reliance on income taxes has remained largely unchanged since the 1950s. Over the past fifteen years, some modest compositional changes in tax revenue have occurred partly as the result of movements in commodity prices and policy changes (for example, the introduction of the GST).
Tax receipts are projected to continue to recover following the Global Financial Crisis. Under current policy settings, the tax-to-GDP ratio would reach the long-term assumption of 23.9 per cent of GDP in 2020-21. This is expected to be largely driven by ‘bracket creep’, which occurs when rises in nominal income from employment and investments push people into higher income tax brackets over time. Bracket creep will entail an increase in the personal income tax burden. Beyond 2020-21, projections of tax receipts are assumed to remain capped at a constant 23.9 per cent of GDP. This ratio of tax-to-GDP reflects the average of the period 2000-01 to 2007-08.
Although projections in this report have been prepared on the basis of the current tax settings, a better tax system would help Australia to take advantage of global opportunities and improve economic growth.
In recent decades, financial deregulation, the growth of multinational companies using global supply chains and the increasing digitisation of global commerce have all transformed the economic environment in which tax systems operate. This is putting strain on the tax system in Australia, as well as all around the world. Other economies are responding with reforms that reduce the average burden of corporate tax, while also addressing global tax avoidance activities. Australia’s reliance on corporate income taxes is amongst the highest in the developed world and significantly higher than key regional competitors.
Bracket creep and higher personal income taxes also impact on participation incentives for some people. Increases in workforce participation will have a strong influence on future economic growth, alongside productivity improvements.
Governments need to manage carefully the taxes collected from Australians and ensure that they are allocated judiciously and prudently. Unchecked government spending would require even higher taxes or severe future spending cuts, posing difficult allocative decisions for subsequent governments.
Page xix
Superannuation
The superannuation system helps Australians enhance their retirement incomes, and supplement or reduce reliance on the Age Pension.
Employers are currently required to make minimum payments equivalent to 9.5 per cent of an employee’s salary to a superannuation fund, to help the employee save for retirement. This rate is scheduled to rise to 12 per cent between 1 July 2021 and 30 June 2026.
Total Australian superannuation assets have increased strongly since compulsory superannuation was introduced in 1992. At the end of 2013-14, total superannuation assets were $1.84 trillion, around 116 per cent of GDP. As the superannuation system matures and wages grow, total Australian superannuation assets are expected to continue to increase and make a growing contribution to national savings.
As more Australians receive compulsory superannuation contributions for longer periods of their working lives, they are likely to retire with higher superannuation balances. This will have important implications for reliance on payments made through the Age Pension.
An ageing population also underlines the importance of considering the overall adequacy of our retirement incomes system — which combines compulsory and voluntary superannuation, and the Age Pension as a safety net. The Government will consider several aspects of the superannuation system as part of the review of the tax system. The Government is also considering improving the way in which the superannuation system transforms savings into retirement income streams.
Major balance sheet items
The Australia Government currently has a gross debt of around $360 billion, equivalent to around 22 per cent of GDP, and it is continuing to rise. Without stabilising and reducing this debt, the ‘previous policy’ scenario shows that future generations will not only have to fund their own government services, they will be funding the services used by Australians today.
Without the Government’s budget repair strategy, the ‘previous policy’ scenario projects gross debt will reach $5,707 billion in today’s dollars, and 125 per cent of GDP by 2054-55. With budget repair efforts reflected in the ‘currently legislated’ scenario, gross debt projections have halved to $2,820 billion in today’s dollars, and 61.8 per cent of GDP by 2054-55.
Page xx
If all policy measures were implemented, as in the ‘proposed policy’ scenario, Australia would be on course to pay off this debt. Gross debt is projected to peak at 26.1 per cent of GDP in 2016-17 and is projected to decline as it is paid off.
Once the budget returns to balance, new debt issuance will no longer be needed to finance government activities. However, the Government is committed to a well-functioning and liquid debt market. In this report, government debt on issue is assumed to be maintained equivalent to 13 per cent of GDP from the late 2020s. The Australian Government’s public sector defined benefit superannuation liability is expected to decline from around 10 per cent of GDP currently to less than 2 per cent of GDP by 2054-55. This reflects the phase-out of defined benefit superannuation schemes in favour of self-funding accumulation schemes. Around $400 billion of Australian Government superannuation payments between 2020 and the mid-2040s will be funded from the Future Fund.
Page xxi
3. Preparing for the future
Chapter 3 prompts consideration of the policy settings required to build jobs, growth and opportunity and ensure that Australians continue to enjoy higher living standards over the next 40 years.
The annual growth in real GDP is projected to average 2.8 per cent over the next 40 years, compared with 3.1 per cent over the past 40 years.
Continued steps to boost productivity and encourage higher workforce participation will be critical to driving this economic growth. Budget repair must also be delivered to stabilise and reduce debt, and position governments to respond to any future economic shocks.
To enhance both productivity and participation, Australia will need a better tax system to deliver taxes that are lower, simpler and fairer. A well-structured tax system can assist in making Australia a more attractive place to invest, boost economic growth and create new jobs. The forthcoming review of the tax system will provide a longer-term, considered approach to tax reform.
To ensure government expenditure is sustainable and better targeted, particularly as we face major demographic change, governments need to focus their efforts on achieving the efficient provision of services.
Different levels of government need to work together as efficiently and effectively as possible. The Government is working with the States and Territories to produce a White Paper on the Reform of the Federation to clarify roles and responsibilities. The objective is to reduce and end, as far as possible, waste, duplication and second-guessing between different levels of government.
It will be critical to continue to support workforce participation, and there are many opportunities to do so. A number of existing policy measures are designed to support the participation of mature age job seekers, people with disability, youth, women, prospective parents, and parents. Other measures are designed to assist the unemployed into work. Encouraging higher participation requires constant and ongoing reform commitment from the Government and all Australians.
Australia’s future productivity performance will be influenced by technological developments, both domestically and abroad, which create new possibilities for production. As a net importer of technology, the pace of global innovation and Australia’s ability to absorb technological advances from abroad and convert them into new business opportunities will be particularly important.
It is also important that government policies facilitate the development of new markets, and allow businesses and the public sector to harness innovation. The Government’s policy agenda will support productivity growth by helping to position Australian
Page xxii
businesses to be flexible, competitive and robust in the face of dynamic global conditions. To this end, the Government is:
• making and facilitating investments in critical aspects of Australia’s infrastructure;
• delivering three new free trade agreements with South Korea, Japan and China, and negotiating other agreements, including negotiations with India and the Gulf States;
• reducing the complexity and scale of the compliance burden on business through a continued focus on red and green tape reduction;
• establishing the Digital Transformation Office with the objective of delivering government services digitally from start to finish to better serve the needs of citizens and businesses;
• undertaking a comprehensive review of Australia’s workplace relations framework to ensure the existing laws are meeting their objectives and contributing to productive, rewarding, competitive, and harmonious workplaces;
• considering its response to the final report of the inquiry into the performance of the Australian financial system (the Murray Inquiry); and
• expecting to receive the final report of the review of competition policy in March 2015.
The fiscal projections in this report show that progress has been made to repair the budget. However, the task is incomplete.
Without the Government’s proposed policies, or alternative savings measures, the budget will not return to surplus at any point over the next 40 years and net debt will rise to almost 60 per cent of GDP by 2054-55, or $2,609 billion in today’s dollars.
The projections highlight the importance of placing the budget in the strongest possible position to meet whatever challenges the future may bring. Continued budget discipline together with policies that promote growth will help to avoid the need for a sharper adjustment in the future and to afford quality government services in the years to come.
The 2015 Intergenerational Report shows that we can have a positive and more prosperous future if we plan for tomorrow, today.
What is the Intergenerational Report?
Every five years, the Australian Government is required to produce an Intergenerational Report. These reports assess the long-term sustainability of current Government policies and how changes to Australia’s population size and age profile may impact economic growth, workforce and public finances over the following 40 years.
Each report provides projections adopting a ‘point-in-time’ format—that is, using the assumption that current government policies will continue over the next 40 years, without change.
The 2015 Intergenerational Report is the fourth intergenerational report (previous reports were released in 2002, 2007 and 2010). It provides important information and analysis that can help everyone consider what policies Australia needs going forward.
The 2015 Intergenerational Report presents what could happen to Australia over the next 40 years based on a detailed analysis of recent trends and existing policy settings. The report is broken up into a number of sections which consider different aspects of the outlook—Australia’s population, our labour force, the economy, the budget, the environment and what governments can do to address the challenges of the next 40 years.
These stories are interlinked, because what is happening to Australia’s population will affect the economy, the economy will affect the budget, and so on. The chart below shows how the different chapters of the document relate to each other.
Chart 1:
The structure of this report
Chapter 1 contains projections for the economy over the next 40 years. There are five main parts to this story:
Section 1.1 focuses on the outlook for the population over the next 40 years. Section 1.2 explains what is expected to happen to the labour force, workforce participation and jobs.
Section 1.3 focuses on productivity, how much more efficient we are expected to get at producing goods and services and creating value.
Section 1.4 brings all these elements together to examine the outlook for the economy, and how incomes will grow along with it.
Section 1.5 is about the environment, and how it might change over the next 40 years.
Chapter 2 focuses on how the Australian Government’s budget will adjust over the next 40 years. There are four parts to this story.
Section 2.2 looks at Australian Government spending, and the important components including health, assistance to older Australians and payments to individuals.
Section 2.3 shows how revenue is projected to change over the next 40 years. Section 2.4 looks at the balance sheet of the Australian Government, and how the major liabilities such as debt and public sector superannuation are expected to change.
Finally, Chapter 3 looks at the different options for responding to the challenges and opportunities of the next 40 years.
Understanding long-term projections
All projections are inherently uncertain, particularly over long timeframes. This report presents projections based on current stated policy settings, assumptions and historical trends, using the 2014-15 Mid-Year Economic and Fiscal Outlook (MYEFO) as the base for the first four years of the projections.
Over the rest of the report’s 40 year projections, various simplifying assumptions are used, which reflect the long-term averages of key variables like growth and productivity, or the long-term trends of variables like participation.
The projections of the budget position take into account how spending per person is likely to change for different age groups based on current policy, and then use the expected age structure of the population to work out total spending, which in turn can be used to work out the overall budget position over the next 40 years.
The projections in this report are very unlikely to unfold over the next 40 years exactly as outlined. Things will happen that are not anticipated in the report’s assumptions, and government policy will change. The projections are not intended to be a prediction of the future as it will actually be, rather they are designed to capture some of the fundamental trends that will influence economic and budgetary outcomes should policies remain similar to current settings. They help to inform us about where there are opportunities to be seized, and where there are challenges to be overcome.
Successive intergenerational reports have been important in focusing public attention on some of Australia’s longer term challenges and spurring some significant policy adjustments even as other long-term challenges have developed.
Chapter 1:
How will Australia change over
the next 40 years?
Key facts
The number of Australians aged 65 and over is projected to more than double by 2054-55, with 1 in 1,000 people projected to be aged over 100. In 1975, this was 1 in 10,000.
Australians will live longer and continue to have one of the longest life expectancies in the world. In 2054-55, life expectancy at birth is projected to be 95.1 years for men and 96.6 years for women, compared with 91.5 and 93.6 years today.
The average annual rate of growth in the population is projected to be 1.3 per cent, compared with 1.4 per cent over the past 40 years.
By 2054-55, the participation rate for people aged over 15 years is projected to fall to 62.4 per cent, compared to 64.6 per cent in 2014-15.
The number of people aged 15 to 64 for every person aged 65 and over has fallen from 7.3 people in 1975 to an estimated 4.5 people today. By 2054-55, this is projected to nearly halve again to 2.7 people.
Female employment is projected to continue to increase, following on from strong growth over the past 40 years. In 1974-75, only 46 per cent of women aged 15 to 64 had a job. Today around 66 per cent of women aged 15 to 64 are employed. By 2054-55, this is projected to increase to around 70 per cent.
During the 1990s, Australia’s productivity grew at an estimated average rate of 2.2 per cent per year. Today, Australians produce twice as many goods and services for each hour worked as they did in the early 1970s.
The economy and incomes are projected to continue to grow, but at a slightly slower rate than over the past 40 years.
This chapter explains the long-term demographic projections underpinning the analysis in this report. It also outlines the long-term projections for key drivers of the economy: population, participation and productivity, and illustrates how projected changes would impact on our economy.
Economic growth is the increase in the quantity of goods and services a country produces (often referred to as Gross Domestic Product or GDP). Three main factors determine the quantity of goods and services that a country produces: population, participation and productivity.
While other variables, including natural disasters such as cyclones, can influence a country’s GDP in the short term, intergenerational reports have used changes to population, participation and productivity to help explain the impact of government policies on GDP over 40 year timeframes. Chart 1.1 provides a framework for this analysis.
In the context of economic growth, the key component of population is considered to be the number of people over the age of 15 who may be available to work.
Participation is made up of three elements: how many people choose to seek work (the workforce participation rate), how many of them can get jobs when they do seek work (the unemployment rate) and the average number of hours worked by individuals who have jobs. Improvements in participation happen as more people choose to look for work, and more of them are able to find work.
Productivity is a measure of how much is produced, on average, for every hour that is worked. Over the long-term, technological developments are a key contributor to improvements in efficiency, as people and businesses find better ways to do their work. For example, the adoption of information and communications technologies in the 1990s helped workers undertake existing tasks more quickly and cheaply by enabling more efficient products, processes and organisational structures.
When combined, projections for population and participation give the number of hours worked in the economy. Combining this figure with productivity gives the total quantity of goods and services produced in the economy.
The future size and structure of the Australian economy are key determinants of the living standards of all Australians. These factors will have a strong influence over governments’ ability to continue to afford to provide services and deliver community support into the future.
Chart 1.1
Population, participation and productivity
Source: Treasury.
1.1
Demography
1.1.1
Population projections
Australia’s population over the next 40 years is, to a large extent, determined by the current population. Most of the likely future population is already living in Australia today. But the actual course that the Australian population takes will also depend on the particular interplay of future patterns and trends in fertility, mortality and migration. Each of these factors will have implications for both the size and the age structure of the population. Births clearly add to the younger cohorts of the population, deaths are concentrated in the older cohorts, and migrants tend to be concentrated in younger to middle age ranges.
Australia’s population is projected to grow and change over the next 40 years. A growing population means greater demand for goods and services from businesses, and also more people available to work in businesses to produce those goods and services. The changing population means that the types of goods and services being consumed will be different, on average, from what they are today.
Under the central projection covered in this report, the average annual rate of growth in the population is 1.3 per cent, slightly slower than the annual average population growth rate of 1.4 per cent over the past 40 years. This growth rate would see Australia’s population rise to 39.7 million by 2054-55. However, population projections are particularly sensitive to assumptions about the rate of net overseas migration. Australia’s permanent migration intake is determined by government policy and is
subject to review each year as part of the Budget process to reflect evolving economic and social circumstances, as discussed further below.
1.1.2
Factors that influence population projections
Fertility
In 2013 the total fertility rate was 1.9 births per woman. This report assumes that the total fertility rate remains at 1.9 over the next 40 years, which is consistent with the observed trend in fertility over the past 35 years.
While the total fertility rate has remained steady since the late 1970s (Chart 1.2), a larger proportion of women are having their first child in their late 20s and early 30s, which is later than previous generations. This trend has been evident since the 1990s, and influences the structure of the population. This led to a lower total fertility rate in the 1990s, followed by a temporary period of higher fertility in the mid-2000s.
Over a period in the 2000s there was a short-term increase in fertility rates, with a particularly high number of births to women aged 30 to 39 years. The causes of this upswing in fertility are widely debated. A range of reasons has been put forward in this debate including favourable economic conditions, more flexible working arrangements, and increased levels of government support, including the baby bonus and Family Tax Benefit. Changing social expectations around parenting, particularly supporting the role of fathers may also have been influential. Finally, delayed fertility in a large cohort of women may have led to higher fertility rates in the short term.
Chart 1.2
Australia’s historical and projected total fertility rate
0.0 0.5 1.0 1.5 2.0 2.5 3.0 3.5 4.0 0.0 0.5 1.0 1.5 2.0 2.5 3.0 3.5 4.0 1921 1941 1961 1981 2001 2021 2041
Total fertility rate Total fertility rate
Assumption
Note: The total fertility rate is the number of children a woman would bear during her lifetime if she experienced the current age-specific fertility rates at each age of her reproductive life.
Mortality and life expectancy
This report assumes continuing overall decline in mortality rates and improvement in life expectancies. Life expectancy at birth is projected to increase from 91.5 years in 2015 to 95.1 years in 2055 for males, and from 93.6 years in 2015 to 96.6 years for females (Table 1.1).
Table 1.1
Australian’s projected life expectancy (years)
2015 2025 2035 2045 2055
Life expectancy at birth
Men 91.5 92.6 93.6 94.4 95.1
Women 93.6 94.5 95.3 96.0 96.6
Further life expectancy at age 60
Men 26.4 27.9 29.3 30.5 31.5
Women 29.1 30.3 31.5 32.4 33.3
Further life expectancy at age 70
Men 16.9 18.2 19.3 20.4 21.3
Women 19.3 20.4 21.4 22.3 23.1
Note: Cohort life expectancy at a given age takes into account known or projected changes in mortality over the remainder of the person’s lifetime.
Source: Treasury projections.
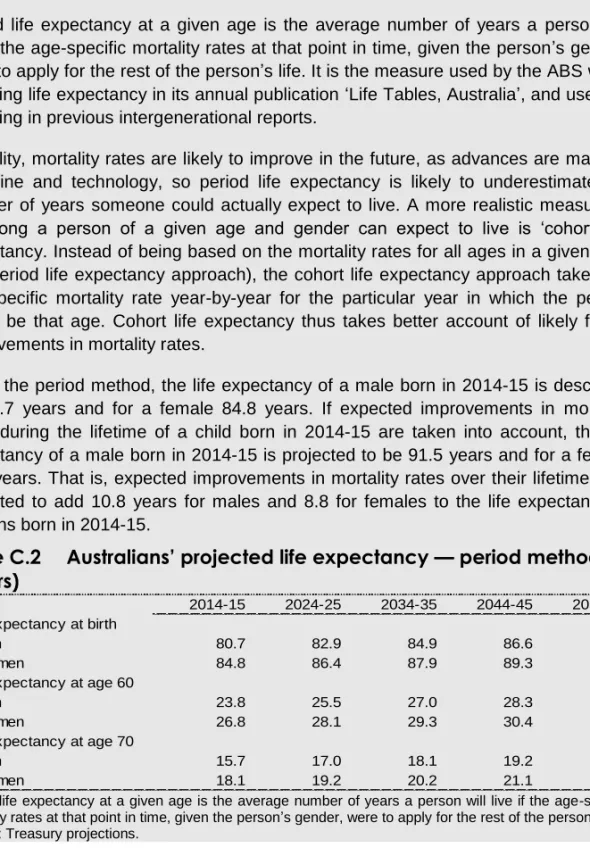
There are two methods of measuring life expectancy: the ‘period’ method and the ‘cohort’ method.
The period life expectancy method measures life expectancy as the average age to which a person is likely to live given the mortality rates prevailing in that year. This method of measuring life expectancy does not take into account the advances in life expectancy that could reasonably be assumed during a person’s lifetime.
Previous reports have used the period method to report life expectancy. In this report, life expectancy is reported using the cohort method unless otherwise indicated. The cohort life expectancy method takes into account assumptions of improvements in mortality rates over people’s lifetimes, and therefore takes a better account of increasing life expectancy trends over time. These projections assume ongoing changes in lifestyles and advances in medicine and technology will continue to improve life expectancy in the future. By capturing these effects, the cohort life expectancy measure provides a more realistic estimate. Further discussion of this method is at Appendix C.
Australian life expectancies have risen over the past few decades (Chart 1.3) as a result of improvements in health, education, and public safety. For example, improvements in road safety such as seat belt laws and random breath testing during the 1970s contributed to increased life expectancy following their introduction. Significant health developments have also been influential, for example, widespread availability of heart by-pass surgery and reduction in smoking prevalence. These influences are further discussed in Box 1.1.
There is a notable difference between life expectancies at birth for Indigenous Australians and the Australian community more broadly. Based on data from 2010 to 2012, Indigenous life expectancy was estimated to be 69.1 years for males and 73.7 years for females (period method). A major policy objective for the Council of Australian Governments is to close the gap between Indigenous and non-Indigenous life expectancy within a generation, that is, by 2031.
Chart 1.3
Male and female life expectancy, 1905 to 2055
50 55 60 65 70 75 80 85 90 95 100 50 55 60 65 70 75 80 85 90 95 100 1905 1915 1925 1935 1945 1955 1965 1975 1985 1995 2005 2015 2025 2035 2045 2055 Year Year
Note: these figures are period life expectancies.
Source: ABS cat. no. 3105.0.65.001 and Treasury projections.
Life expectancies at birth in Australia for both males and females remain among the highest in the world. According to UN data for the period 2010-15, Australia ranks equal first with Iceland in male life expectancy. For females, Australia ranks only behind Japan, Spain, France and Italy.
Box 1.1:
Life expectancy improvements
This report assumes that life expectancy continues to improve over the projection period, reflecting recent trends.
The projections, however, cannot take into account all of the improvements in life expectancy that might happen over the next 40 years.
A projection of life expectancy for 2015 made in 1975 would not necessarily have fully taken into account the significant changes that have contributed to the life expectancy improvement of the past 40 years. For instance, since the 1970s we have seen dramatic improvements in health care for older people. In 1975, a 65 year old could expect to live another 13 years on average, while in 2015 this has improved to 19 years, thanks to better cardiac care and many other improvements in health care.
Similar breakthroughs could well be possible in the next 40 years. Medical research underway today in areas such as stem cell therapy, new medicines and other biotechnology has the potential to provide further dramatic improvements in life expectancy. It is for this reason that some experts have suggested that life expectancy may reach in excess of 140 years. The projections assume that the improvements from medical research continue at the same rate as the past.
There is also considerable scope for particular improvements in life expectancy in some specific age groups. Despite improved medical technology, life expectancy for people aged over 80 has changed by much less over the past century than for younger age groups. As there is a growing population in this age group it is expected to become an increased focus for medical research over the next 40 years.
According to the Australian Institute of Health and Welfare there have also been substantial ongoing increases in the length of time for which Australian men and women can expect, on average, to live without disability — so-called healthy life expectancy (Box 1.2).
Box 1.2:
Healthy life expectancy
Australians are living longer, and importantly the increases in life expectancy are matched by increases in healthy life expectancy.
To measure this, the Australian Institute of Health and Welfare (AIHW) has estimated ‘health expectancies’ for Australians. A male born in 2012 could expect to live 79.9 years (period method) and an average of 62.4 of those years without disability. A female could expect to live 84.3 years, and an average of 64.5 of those years without disability. Of the years spent living with disability, an estimated 11.8 were without severe or profound core activity limitation for men, and 12.0 for women; that is, not needing help with activities of self-care, mobility or communication.
Recent improvements in life expectancy have been met or exceeded by improvements in these health expectancies. That is, not only are Australians’ lives getting longer, they are enjoying good health for an increasing number of those extra years. Between 1998 and 2012, the AIHW has estimated that life expectancy at birth for males has increased by 4 years, while the number of years without disability increased by 4.4 years — that is, all of the additional life expectancy was in years without disability. For women, this was an increase of 2.8 years of life expectancy, with 2.4 in years without disability. For Australians at age 65, more of their increase in life expectancy has been for years without any severe disability.
The World Health Organisation publishes estimates of ‘healthy life expectancy’ at birth. This measures the average number of years that a person can expect to live in ‘full health’ by taking into account years lived in less than full health due to disease and/or injury. By this measure, in 2012 Australians had the equal fourth highest healthy life expectancy at birth in the world (73 years for both sexes combined), along with Spain, South Korea, Switzerland, Italy and San Marino.
Source: Australian Institute of Health and Welfare Bulletin 126, Healthy Life Expectancy in Australia: Patterns and Trends 1998 to 2012; World Health Organisation, Healthy Life Expectancy at Birth.
Box 1.3:
Australia’s demography — an international perspective
Australia’s current total fertility rate of 1.9 births per woman is below the replacement level.1 Still, Australia’s fertility rate is well above many European countries and countries in Australia’s region such as China and Japan, although below that of New Zealand and the United States.Table 1.2
International comparison of Australia’s demographic
indicators
Annual
Total Total average
fertility Population dependancy population
rate Median age 65+ ratio (a) Population growth
2005-10 (years) (per cent) (per cent) (millions) (per cent)
Children per 2005 to woman 2010 2010 2010 2010 2010 Australia 1.9 36.8 13.4 48 22.4 1.80.0 Canada 1.6 39.7 14.2 44 34.1 1.1 China 1.6 34.6 8.4 36 1,359.8 0.6 France 2.0 40.0 16.8 54 63.2 0.6 Germany 1.4 44.3 20.8 52 83.0 -0.2 Greece 1.5 41.8 19.0 50 11.1 0.1 Hungary 1.3 39.9 16.7 46 10.0 -0.2 India 2.7 25.5 5.1 54 1,205.6 1.4 Indonesia 2.5 26.9 5.0 53 240.7 1.4 Italy 1.4 43.3 20.3 52 60.5 0.6 Japan 1.3 44.9 23.0 57 127.4 0.1 Netherlands 1.7 40.8 15.4 49 16.6 0.4 New Zealand 2.1 36.6 13.0 50 4.4 1.1 Poland 1.3 38.0 13.5 40 38.2 0.0 Spain 1.4 40.2 17.1 47 46.2 1.3 Sweden 1.9 40.7 18.2 53 9.4 0.8 United Kingdom 1.9 39.8 16.6 52 62.1 0.6 United States 2.10.0 37.10.0 13.10.0 490 312.20.0 0.90.0 WORLD 2.5 28.5
0
7.7 52 6,916.2 1.2(a) Total dependency ratio is the ratio of population aged 0-14 and 65+ per 100 population aged 15-64. Source: United Nations, Population Division, 2012 Revision.
1 The replacement rate is the level of fertility where each woman gives birth to enough children to sustain the population at its current level. It is around 2.1 for Australia and other developed countries.
Australia’s population, although ageing, is neither as aged nor ageing as fast as some other countries. Japan’s median age is almost 45 years and many European countries have a median age in the forties. By contrast Australia’s median age is 36.8. The proportion of the Australian population aged 65 years and over is smaller than many OECD countries, including Canada, France, Germany, Italy, Japan and the United Kingdom. On the other hand Australia has a much larger proportion of its population aged 65 years and above than China, India and Indonesia.
Japan and a number of European countries have experienced either very low population growth (for example Greece and Poland) or negative population growth (for example Germany and Hungary). This has been the result of a combination of low fertility rates and very low migration. According to the UN population projections, Japan’s population is projected to decline to 105 million by 2055, and then to 84.5 million by 2100.
Migration
Net overseas migration is the net gain or loss of population through immigration to Australia and emigration from Australia. For the central scenario presented in this report, net overseas migration is assumed to be 215,000 per annum from 2018-19, consistent with the assumption used in the 2014-15 Mid-Year Economic and Fiscal Outlook (MYEFO).
Net overseas migration has varied substantially over recent decades. During the decade to 2005, it averaged around 105,000 per annum. Over the period since 2005, net overseas migration was much more rapid, averaging around 220,000 per annum, and reaching a peak of 300,000 in 2008-09.
Consistent with this, there has been significant variation in the levels of net overseas migration underpinning population projections across the series of intergenerational reports. In the 2002 report, the long-term net overseas migration assumption was 90,000 persons per annum. In the 2007 report, the assumption was 110,000 persons per annum, and in the 2010 report, the assumption was 180,000 persons per annum. Variation in net migration outcomes reflects changes in both out-migration, influenced by economic circumstances domestically and overseas, and in government policy regarding immigration into Australia. Australia’s permanent migration intake is determined by government policy (including the mix between skilled and family reunion places) and is subject to review each year as part of the Budget process to reflect evolving economic and social circumstances.
As such, actual population outcomes over coming decades will depend upon the future immigration policy settings of successive governments, as well as Australia’s relative economic performance. By way of illustration, if net overseas migration were instead to