SWIGS: A Swift Guided Sampling Method
Victor Fragoso
Matthew Turk
University of California, Santa Barbara
1
Introduction
This supplement provides more details about the homography experiments in Section 4.3 of the submission, comparing our SWIGS method with four other approaches with respect to inliers and number of iterations required.
2
Homography Experiment: Extended Figures
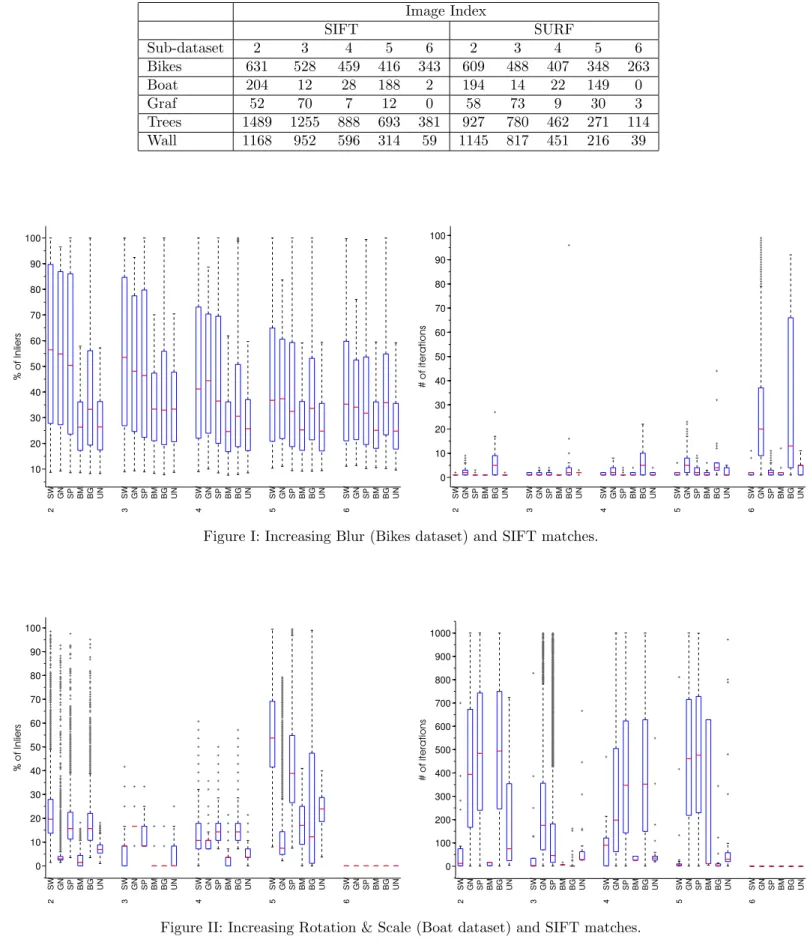
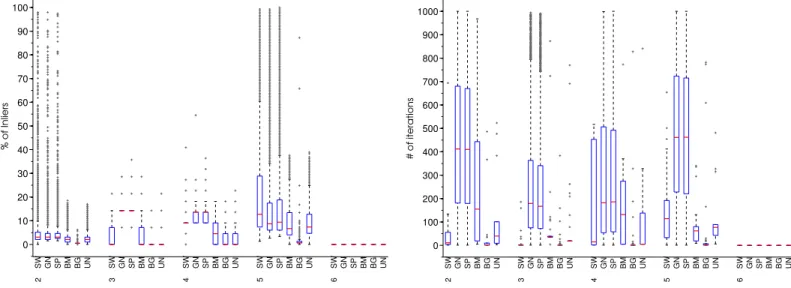
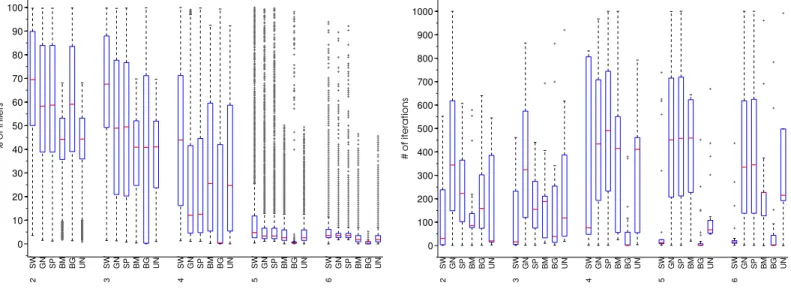
The boxplots below (Figures I through X) show the percentage of inliers (left) and number of iterations (right) obtained from the homography estimation experiments (see Sec. 4.3). The homography estimation was executed 5000 times with a maximum number of 1000 iterations for each estimation. The algorithms reported are represented as follows:
1. SW: SWIGS (Our approach) 2. GN: GEN
3. SP: SPEC 4. BG: BLOGS 5. UN: UNIFORM
The number below the labels of the algorithms indicates the image index as in Fig. 9 in the main submission.
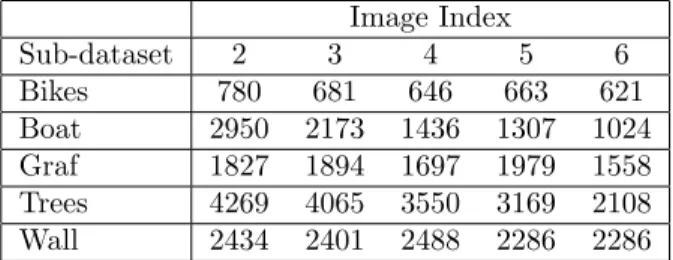
The feature matcher assigns a single reference keypoint for every query feature. Therefore, the number of image corre-spondences is exactly the number of query features. Table A presents the number of image correcorre-spondences while Table B presents the number of correct image correspondences (i.e., inliers) per sub-dataset and per descriptor. Note in Table B that SIFT produces more inliers (overall) than SURF, confirming that SIFT is a better descriptor.
Overall, observe how SWIGS (SW) performs comparable or better than the other methods, requiring fewer iterations than the other methods. Moreover, note that the plots show that there exist rare cases where the algorithms detected higher percentage of inliers. There exist cases where the plots show that the algorithms were not able to find the low number of inliers on image 6 of Boat and Graf datasets (see Figs. II, III, VII, VIII and compare with Table B). SWIGS maintains a more consistent and low number of iterations in comparison with the other methods, confirming that our approach can be fast.
Table A: Number of image correspondences. Image Index Sub-dataset 2 3 4 5 6 Bikes 780 681 646 663 621 Boat 2950 2173 1436 1307 1024 Graf 1827 1894 1697 1979 1558 Trees 4269 4065 3550 3169 2108 Wall 2434 2401 2488 2286 2286
Boat 204 12 28 188 2 194 14 22 149 0 Graf 52 70 7 12 0 58 73 9 30 3 Trees 1489 1255 888 693 381 927 780 462 271 114 Wall 1168 952 596 314 59 1145 817 451 216 39 10 20 30 40 50 60 70 80 90 100 2 3 4 5 6 SW GN SP BM BG UN SW GN SP BM BG UN SW GN SP BM BG UN SW GN SP BM BG UN SW GN SP BM BG UN % of Inliers 0 10 20 30 40 50 60 70 80 90 100 2 3 4 5 6 SW GN SP BM BG UN SW GN SP BM BG UN SW GN SP BM BG UN SW GN SP BM BG UN SW GN SP BM BG UN # of iterations
Figure I: Increasing Blur (Bikes dataset) and SIFT matches.
0 10 20 30 40 50 60 70 80 90 100 SW GN SP BM BG UN SW GN SP BM BG UN SW GN SP BM BG UN SW GN SP BM BG UN SW GN SP BM BG UN % of Inliers 0 100 200 300 400 500 600 700 800 900 1000 SW GN SP BM BG UN SW GN SP BM BG UN SW GN SP BM BG UN SW GN SP BM BG UN SW GN SP BM BG UN # of iterations
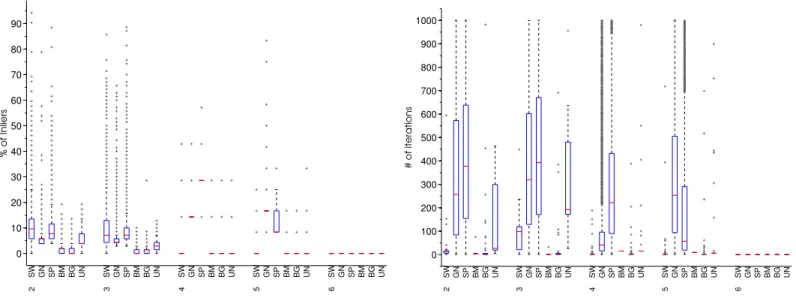
0 10 20 30 40 50 60 70 80 90 2 3 4 5 6 SW GN SP BM BG UN SW GN SP BM BG UN SW GN SP BM BG UN SW GN SP BM BG UN SW GN SP BM BG UN % of Inliers 0 100 200 300 400 500 600 700 800 900 1000 2 3 4 5 6 SW GN SP BM BG UN SW GN SP BM BG UN SW GN SP BM BG UN SW GN SP BM BG UN SW GN SP BM BG UN # of iterations
Figure III: Increasing Viewpoint (Graf dataset) and SIFT matches.
0 10 20 30 40 50 60 70 80 90 100 2 3 4 5 6 SW GN SP BM BG UN SW GN SP BM BG UN SW GN SP BM BG UN SW GN SP BM BG UN SW GN SP BM BG UN % of Inliers 0 100 200 300 400 500 600 700 800 900 1000 2 3 4 5 6 SW GN SP BM BG UN SW GN SP BM BG UN SW GN SP BM BG UN SW GN SP BM BG UN SW GN SP BM BG UN # of iterations
0 10 20 30 40 50 2 3 4 5 6 SW GN SP BM BG UN SW GN SP BM BG UN SW GN SP BM BG UN SW GN SP BM BG UN SW GN SP BM BG UN % of Inliers 0 100 200 300 400 500 2 3 4 5 6 SW GN SP BM BG UN SW GN SP BM BG UN SW GN SP BM BG UN SW GN SP BM BG UN SW GN SP BM BG UN # of iterations
Figure V: Increasing Viewpoint (Wall dataset) and SIFT matches.
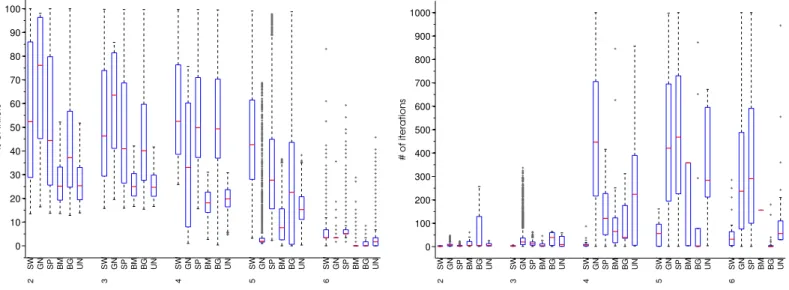
10 20 30 40 50 60 70 80 90 100 2 3 4 5 6 SW GN SP BM BG UN SW GN SP BM BG UN SW GN SP BM BG UN SW GN SP BM BG UN SW GN SP BM BG UN % of Inliers 0 10 20 30 40 50 60 70 80 90 2 3 4 5 6 SW GN SP BM BG UN SW GN SP BM BG UN SW GN SP BM BG UN SW GN SP BM BG UN SW GN SP BM BG UN # of iterations
0 10 20 30 40 50 60 70 80 90 100 2 3 4 5 6 SW GN SP BM BG UN SW GN SP BM BG UN SW GN SP BM BG UN SW GN SP BM BG UN SW GN SP BM BG UN % of Inliers 0 100 200 300 400 500 600 700 800 900 1000 2 3 4 5 6 SW GN SP BM BG UN SW GN SP BM BG UN SW GN SP BM BG UN SW GN SP BM BG UN SW GN SP BM BG UN # of iterations
Figure VII: Increasing Rotation & Scale (Boat dataset) and SURF matches.
0 10 20 30 40 50 60 70 80 90 2 3 4 5 6 SW GN SP BM BG UN SW GN SP BM BG UN SW GN SP BM BG UN SW GN SP BM BG UN SW GN SP BM BG UN % of Inliers 0 100 200 300 400 500 600 700 800 900 1000 2 3 4 5 6 SW GN SP BM BG UN SW GN SP BM BG UN SW GN SP BM BG UN SW GN SP BM BG UN SW GN SP BM BG UN # of iterations
0 10 20 30 40 50 2 3 4 5 6 SW GN SP BM BG UN SW GN SP BM BG UN SW GN SP BM BG UN SW GN SP BM BG UN SW GN SP BM BG UN % of Inliers 0 100 200 300 400 500 2 3 4 5 6 SW GN SP BM BG UN SW GN SP BM BG UN SW GN SP BM BG UN SW GN SP BM BG UN SW GN SP BM BG UN # of iterations
Figure IX: Increasing Blur (Trees dataset) and SURF matches.
0 10 20 30 40 50 60 70 80 90 100 2 3 4 5 6 SW GN SP BM BG UN SW GN SP BM BG UN SW GN SP BM BG UN SW GN SP BM BG UN SW GN SP BM BG UN % of Inliers 0 100 200 300 400 500 600 700 800 900 1000 2 3 4 5 6 SW GN SP BM BG UN SW GN SP BM BG UN SW GN SP BM BG UN SW GN SP BM BG UN SW GN SP BM BG UN # of iterations