Topology Discovery & Service Classification for Distributed-Aware Clouds
Jinho Hwang∗, Guyue Liu†, Sai Zeng∗, Frederick y Wu∗, Timothy Wood† ∗IBM T.J. Watson Research Center †George Washington University
Yorktown Heights, NY, USA Washington D.C., USA {jinho, saizeng, fywu}@us.ibm.com {guyue, timwood}@gwu.edu
Abstract—Cloud data centers are difficult to manage because providers have no knowledge of what applications are being run by customers or how they interact. As a consequence, current clouds provide minimal automated management func-tionality, passing the problem on to users who have access to even fewer tools since they lack insight into the underlying infrastructure. Ideally, the cloud platform, not the customer, should be managing data center resources in order to both use them efficiently and provide strong application-level per-formance and reliability guarantees. To do this, we believe that clouds must become “distibuted-aware” so that they can deduce the overall structure and dependencies within a client’s distributed applications and use that knowledge to better guide management services. Towards this end we are developing a light-weight topology detection system that maps distributed applications and a service classification algorithm that can determine not only overall application types, but individual VM roles as well.
Keywords-cloud computing; resource management; topology discovery;service classification
I. INTRODUCTION
Cloud Computing has radically changed how businesses run their applications by simplifying deployment and lower-ing the cost of massively scalable applications. A key prin-ciple in many cloud computing platforms is their reliance on server virtualization to provide an isolated resource partition for a user to run her applications in. Using virtualization grants the cloud a convenient abstraction since the virtual machines (VMs) of all customers can be treated identically. However, this leaves the cloud provider with little or no knowledge about what is running inside a VM or how different VMs interact.
The applications running inside both public and private data centers are growing in size and complexity. Even a relatively straightforward web application is likely to be composed of multiple interacting service components: a front-end web server, a cache, an application server, and a database, each of which may be replicated to support higher demand or reliability. The result is a complicated distributed application that may exhibit performance bottlenecks or consistency requirements between components.
The tendency of current cloud providers to treat each VM as a black box ignores this complexity, which can easily lead to inefficient resource allocations or worse, dangerous reliability issues. A client may create three VMs: one for a
NameNode & JobTracker DataNodes & TaskTrackers Load Balancer Web Server Storage Cache Database Proxy SQL Web Service Hadoop Service Online Gaming Service
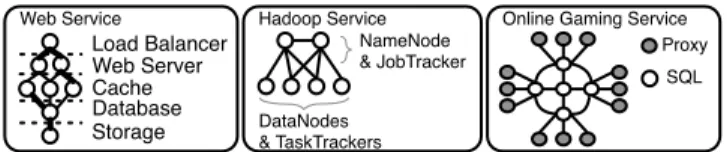
Figure 1:TopClass attempts to classify applications based on their topology characteristics.
web front-end and two for a replicated database. The cloud, not knowing anything about what these VMs are doing, may make decisions such as placing the VMs several network hops away from each other even though their performance would be improved by placing them nearby. Alternatively, the cloud might blindly place the two database replica VMs together on the same physical server, not realizing that the customer’s goal was to use redundancy to limit the effect of a server crash. These issues arise because cloud platforms are unaware of how VMs are interconnected. Instead, we believe that cloud platforms need to be designed to be ap-plication agnostic, yetdistributed-aware—they must be able to understand the structure and dependencies of distributed applications without requiring application-specific support.
As a step towards the goal of distributed-aware cloud platforms, we are developing TopClass. TopClass employs a hypervisor-based network monitoring system to track the connections between different VMs and automatically determine their network topologies. While topology alone provides some useful information about how components of a distributed application interact, TopClass takes this a step further to also classify each VM based on the type of service it is most likely running. The intuition behind our approach is that different classes of data center applications have very different topologies. For example, Fig. 1 illustrates possible topologies for three types of applications found in a data center: a web application, a Hadoop cluster, and an online gaming server. Each of these services has distinct topology characteristics. While there are many different web applications with slight variations on this basic topology (e.g., more web caches or database replicas), a multi-tier web application still should appear more similar to other web applications than to an application of a completely different type. TopClass uses graph similarity algorithms to group together applications based on their similarity to a service class template [1–5]. TopClass can then provide this information to performance or reliability management
Management Controller Topology
Discovery
Data Center Data
Processing Service Discovery 0 9 1 9 0 9 1 9 0 Network & Performance Information Web Service data files 1 09 1 = Web Service VM VM VMM
Collector Load BalancerWeb Server
Storage Cache Database users 0 9 1 9 0 9 1 9 0 0 1 2 3 45 1 0 0.5
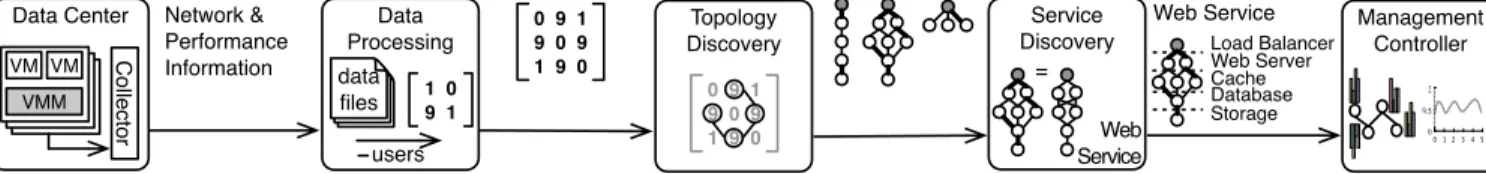
Figure 2:TopClass uses network flow information to build a graph representing each application. The graphs are represented as adjacency matrices, which can be compared to service templates to characterize the components that make up each application.
systems.
In this paper we describe our vision of distributed-aware cloud platforms and present our preliminary work on building TopClass. We have built a prototype system that can monitor network traffic in the Xen hypervisor without modifying hypervisor itself and have devised a set of efficient algorithms that can determine network topology and classify distributed applications based on their structure. We believe that this type of information system will be crucial for developing more automated cloud platforms that can provide application-level guarantees without requiring application-specific knowledge.
II. THENEED FORDISTRIBUTED-AWARECLOUDS
Today’s clouds simply rent VMs with fixed sets of resources, and leave individual customers responsible for managing and protecting their applications. Some clouds offer simple auto-scaling tools, but these can have limited use for multi-tier or distributed applications. Here we present the limitations of current approaches and then describe our vision of distributed-aware clouds that use inferred knowledge of application characteristics to better manage both cloud resources and customer performance.
One of the largest cloud resource automation tools is Amazon EC2’s Auto Scaling feature that can automatically add or remove instances based on any of the metrics pro-vided by its CloudWatch monitoring service. For example, it is possible to set rules such as “create a new VM if the average CPU utilization of a group of VMs exceeds 70% or the average latency exceeds 5 seconds”. While this can be effective for some simple applications, these types of rules only make sense for applications that are composed of replicated VMs all performing the same task— if a customer is running a multi-tier web application they will need to carefully configure such rules for each tier individually. Prior research has shown that this type of ad-hoc resource management is far less effective than a cohesive resource manager that can detect bottlenecks across tiers and attempt to resolve them in an unified way [6, 7]. As a further limitation, Amazon only supports latency based rules for tiers that are directly connected to an instance of their Amazon Load Balancing service, which typically will only be the front-end of the application.
Research prototypes have brought us closer to the goal of a fully automated cloud, but they typically require support from applications [8], or they fail to account for
the distributed nature of modern data center applications. As a result, there is a large gap between state-of-the-art cloud platforms and the flexible, but self-managing cloud infrastructures that companies would like to use.
Fig. 1 illustrates three sample classes of data center applications: a multi-tier web service, hadoop, and an online game. Each has a distinct set of performance and reliability requirements, but each also has a fairly unique network topology. Current clouds would view each of the VMs that make up these applications individually, or focus on the hosts they reside on when doing resource management. Instead, a distributed-aware cloud should be able to understand the relations between tiers to determine, for example, whether a web server’s performance could be better improved by adding a new caching node or a new database replica. Research has demonstrated that such bottleneck detection and “what-if” analysis can be performed if the management layer has access to overall topology and server characteris-tics [6, 7], but current clouds do not have this information. Fig. 2 shows a high level picture of how TopClass tries to provide clouds with the information they need to make these decisions. We first monitor network traffic to build an adjacency matrix of links between VMs. This is then fed to a topology discovery system that determines how VMs are connected as a graph. From this connectivity information, TopClass can classify applications based on their overall service type. Finally, the nodes within an application are annotated with a guess of what service they are running.
The alternative to automatically mapping applications is to require individual cloud customers to specify more details about their applications [9]. We believe this is a poor substitute for a purely automated solution, which would not only reduce sysadmin duties, but could also dynamically update itself as applications change. Further, giving direct placement control to users may expose proprietary infor-mation about the cloud’s architecture and limits the cloud provider’s own ability to maximize efficiency.
III. DISCOVERINGAPPLICATIONTOPOLOGIES
We are developing TopClass, a system that provides cloud platforms with information about the applications running within them by monitoring VM communication to map application topology.
A. Monitoring Network Flows
TopClass’s first task is to passively observe network traffic to determine the topology of distributed applications running
VM
HW VMM
Frontend Driver Dom-0 (Kernel Space)
Device Driver NF_IP_PRE _ROUTING Routing NF_IP_FORWARD NF_IP_POST _ROUTING Backend Driver TX RX
Figure 3: All sent or received network packets pass through the NF IP FORWARD filter, allowing TopClass to monitor traffic.
in the data center [10]. Towards this end we have built a low-overhead network monitoring system that resides in the hypervisor of each data center server. Since the hypervisor is typically involved in all network operations performed by a VM, we are able to intercept incoming and outgoing packets to each VM and track what other VMs in the data center it is communicating with.
Our prototype of TopClass monitors this network traf-fic by using the Linux netfilter callbacks provided by Xen’s Domain-0. Fig. 3 shows the network packet flow in the Xen architecture with netfilter interfaces for both sent and received messages. By examining the packets that pass through the forward netfilter table we can capture all packets sent to or from any guest VM on the host, including traffic between co-located VMs. Top-Class can record information about each packet as a tuple:
(timestamp, src IP, src port, dest IP, dest port), or it
can aggregate this information over a time period and report the volume of traffic sent over each connection. While we only use the graph connectivity in this work, all other information should also be used to increase the reliability of the results.
Fig. 4 shows the level of overhead added by our network monitoring system. To demonstrate the worst case overhead, we have our system intercept all packets; in practice we expect that we can get a similar level of information while sampling only a small fraction of the total traffic. Fig. 4(a) shows that the time to transfer a 1GB file has only a small increase when sending to a VM on a different server (exter-nal) or to another VM on the same host (inter(exter-nal). Fig. 4(b) shows the extra system CPU time spent on monitoring, and the reduction in network throughput. We believe that these overheads are reasonable since TopClass will only need to periodically enable the monitoring system to gather data.
Traffic to or from IPs that are external to the cloud data center is ignored by TopClass because our focus is on under-standing the topology of VMs that make up the cloud-based distributed application. However, we do annotate nodes that are actively communicating with external IPs because this allows for an important optimization in our graph similarity algorithm discussed in Section IV.
0 5 10 15 20 25 30 35 40 45 External Internal
Transmission Time (sec)
Communication Path Base TopClass
(a) Transmission Overhead 0 1 2 3 4 5 6
CPU In-Network Out-Network
Overheads (%)
TopClass
(b) CPU and Network Overheads Figure 4:(a) Data Transmission Overhead when sending 1GB file; (b) CPU, and In- and Out-Network Performance when total number of packets is 354,620, and peak memory size used in TopClass module is 369KB.
B. Mapping Application Topology
TopClass attempts to map the data center as a directed graph G= (V, E), where V is a set of vertices (nodes or virtual machines) andEis a set of edges (number of packets sent between two VMs). Within this graph, a maximal induced subgraph (a.k.a. strongly connected component)
si= (Vi, Ei)represents application groupi, a set of virtual machines collaborating together to provide a service.
We want to find all distributed application groups S =
{s1, s2, ..., sn}, where n is the number of groups, each of which is a set of at least two strongly connected nodes. To do this, TopClass uses Tarjan’s algorithm [11], which is based on depth first search (DFS). The vertices are indexed as they are traversed by DFS procedure. While returning from the recursion of DFS, every vertexV gets assigned a vertexLas a representative.Lis a vertex with the least index that can be reached fromV. Nodes with the same representative must be located in the same strongly connected component. Tarjan’s algorithm is a modified depth first search, hence it can ef-ficiently map the data center with asymptotic complexity of onlyO(|V|+|E|). We currently gather this data and compute these topologies on a centralized server; however, we are also considering a distributed approach where the physical servers hosting VMs with links between them collaborate to determine the topology graphs of their applications in a distributed fashion.
IV. SERVICECLASSIFICATION
After mapping the topologies of distributed applications running within the cloud, TopClass next attempts to classify each application and component VM. The simplest way to determine a service type for a VM would be to examine the port numbers it uses and match them against a list of common applications. However, this approach will not work if customers use custom port numbers, and it requires the cloud administrators to keep track of all common applica-tions and their typical ports. Further, one server may often use multiple ports for a variety of services, so it is non-trivial to determine an overall application type based purely on ports. Therefore, we propose a graph similarity based
1 2 3 4 1 2 3 g t 5
(a) Two Example Graphsgandt
0.4563 0.1021 0.0000 0.0923 0.4045 0.2934 0.2945 0.4045 0.0932 0.2342 0.0597 0.2116 0.0000 0.1134 0.4545
(b) Similarity Score Matrix Figure 5:Example graphs and their similarity score matrix
algorithm which can classify applications even without this information.
A. Classifying Services
In graph theory, the graph isomorphism problem deals with determining if two graphs are structurally equivalent. In order to classify graphs based on their similarity (rather than equality) to other applications, we need to relax this problem because the topologies of multi-tier web applications, for example, are not always isomorphic: scalability or reliability issues might affect the overall structure by replicating a sub-set of the graph’s nodes. The Maximum Common Subgraph (MCS) algorithm provides a way to calculate “distances” between graphs by finding a maximum possible isomorphic graphs from two graphs [3]. Intuitively, by finding the MCS of an unknown distributed application and several known templates, we can determine which of the templates the service is most similar to.
However, the MCS problem is known to be NP-Hard [3], so the complexity of measuring the similarity of many different graphs in a data center may become intractable. Fortunately, TopClass is able to optimize this problem by exploiting annotations made to each graph about the gate-way nodes that communicate with external IPs. Using this information allows us to “orient” each graph based on where incoming requests arrive, simplifying MCS to a polynomial time algorithm.
Definition 1. Given two graphsg1andg2, and the gateway
nodes of each graph wg1 = {w
1 g1, ..., w ¯ g1 g1} and wg2 = {wg12, ..., w ¯ g2
g2}, where g¯1andg¯2 are the number of gateway
nodes of g1 and g2, respectively, graph g is a MCS of g1
and g2, denoted as g = mcs(g1, g2), if and only if the
gateway nodes match [wi
g = wig1 = w i g2] ¯ g i=1 and there
is no other common subgraph g0 of g1 and g2 such that
|E(g0)|>|E(g)|.
Definition 2. The distance between two graphs g1 and g2
isd(g1, g2) =|E(g1)|+|E(g2)| −2× |E(mcs(g1, g2))|.
To determine the service type graph, t∗, that is most similar to unknown application graph g, TopClass simply must find the template with the smallest distance score:
t∗= argmin
t∈T
{d(g, t)}. (1)
(a) Star (b) 1-D Star
(c) Star w/off shoot (d) Chain
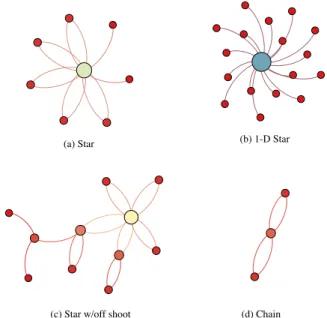
Figure 6: Four sample topologies from a public university data center network.
Currently, TopClass assumes access to a set of repre-sentative service type graphs, T = {t1, t2, ..., tM}, where
M is the number of representative service types. These graphs represent distributed application classes (e.g., those in Fig. 1) that the cloud provider would like to manage in a particular way. In our ongoing work we hope to remove this assumption so the cloud can automatically determine a set of template service classes by clustering application graphs. B. Labeling Components
Now that each distributed application has a service type assigned, each VM in the application needs to be labeled. We assume that the service template graphs have been labeled with the name or characteristics of each vertex; the task of TopClass is to correlate the vertices in the new application graph with the selected service template. The base idea of this solution is that a node is characterized by its neighboring nodes, so that the score of a pair is reinforced by the scores of its neighbor’s pairs.
As an example, Fig. 5(a) shows the two graphs to com-pare. The similarity between the nodeg3from the distributed
application and the node t2 from the service template is
calculated ass(t2, g3) =s(t1, g1) +s(t1, g4) +s(t3, g2) + s(t3, g5); the similarity of two nodes recursively depends
on the similarities of the neighbors on incoming edges (g1, g4, t1) and those on outgoing edges (g2, g5, t3). Note that
since our focus is on graph structure, we use the adjacency matrix representation of each graph in these calculations to prevent differences in edge weights from biasing the results [4].
TopClass attempts to estimate the similarity score matrix M that represents the similarity between each pair of nodes in the two graphs:
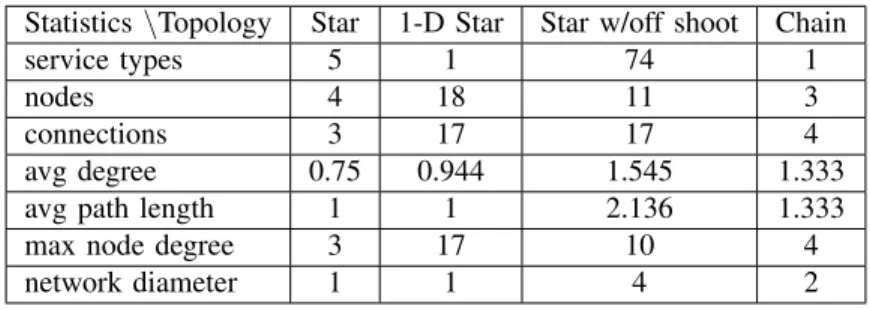
Table I: Statistics of Sample Topologies
Statistics\Topology Star 1-D Star Star w/off shoot Chain
service types 5 1 74 1
nodes 4 18 11 3
connections 3 17 17 4
avg degree 0.75 0.944 1.545 1.333
avg path length 1 1 2.136 1.333
max node degree 3 17 10 4
network diameter 1 1 4 2 M = s(t1, g1) ... s(t¯t, g1) .. . ... ... s(t1, gg¯) ... s(tt¯, gg¯) (2)
where¯gandt¯are the number of nodes ingandt. Since this cannot be calculated directly, we use an iterative algorithm that is a matrix analogue to the classical power method [12] to compute a dominant eigenvector of a matrix.
Mk+1=
(at⊗ag+atT ⊗aTg)Mk+d
||(at⊗ag+atT ⊗aTg)Mk+d||
. (3)
We start with a random initial similarity matrix M1 and
the adjacency matrix at⊗ag of the product graph t×g, we iterate Equation (3) an even number of times until it converges. When d >0, it is guaranteed to converge [13]. When the similarity matrix M converges, each element of the matrix tells how strong the relationship between two nodes from two different graphs. Therefore, we map each node fromt to g to find an application type of each node. Fig. 5(b) shows a converged similarity matrix from the graphs in Fig. 5(a). As expected, it shows high similarity between node 3 ing and node 2 int.
V. SAMPLETOPOLOGIES
In order to see what real data center applications look like, we have begun analyzing the data center network packet traces released by Benson et al. [10]. We consider a 5 minutes 45s portion of the trace and determine the connectivity between hosts, ignoring links that send less than 345 packets. We use the algorithm described in Section III to break the full data set into a set of subgraphs.
Fig. 6 shows four of the resulting subgraphs, and statistics about each are shown in Table I. Each of these topologies has its own characteristics. In our ongoing work we are investigating how we can use clustering type algorithms to determine which subgraphs in the trace make good templates, and then how our service classification algorithms can be used to identify overall topologies and individual service components.
VI. RELATEDWORK
Previous work has investigated the complexity of data center networks and through in depth measurement
stud-ies [10]. We seek to expand on this by allowing data center administrators to automatically determine topologies and application types. Several related projects have used network monitoring systems to find communication paths within a distributed application. vPath [14] provides path discovery by monitoring and recording thread and network activities at runtime, such as which thread performs a send or recv system call over certain TCP connection. vPath can be implemented in either the OS kernel or a hypervisor. Similarly, Sang et. al [15] deploy a TCP Tracer inside each VM to track their fine grained interactions and report performance statistics. Net-Cohort [16] uses a two-step ap-proach for finding links between VMs: correlation of coarse grained metrics and packet sniffing. Once the topology of an application is determined, the system can place VMs to more efficiently use network resources. Our work differs from these projects because we focus on scalable algorithms for not only determining how virtual machines are connected, but also for classifying them based on the type of application they are most likely running.
VII. CONCLUSIONS ANDFUTUREWORK
We are developing the TopClass system to determine a virtual topology of cloud data centers without requiring application-specific knowledge of the systems running on each host. TopClass uses a simple network monitoring module that can be deployed inside several popular hyper-visors to track the communication links between different VMs. This information is then aggregated, and the resulting communication graphs analyzed to determine the network topology of each distributed application in the data center. TopClass then uses an optimized graph similarity algorithm to classify each distributed application and correlate the similarity of its VMs with a template service. We believe that the combination of high level topology information and VM-level service labels provided by TopClass will allow automated cloud platforms to manage groups of VMs far more efficiently.
In our ongoing work, we are analyzing the scalability of our algorithms and testing their accuracy on real data center traces. We are developing enhancements that will use not only connectivity information, but traffic rates and port information to further annotate nodes in the graph and
help with service classification. We are also considering several enhancements to our monitoring system such as using packet data to infer application-level performance metrics like response time. Our goal is to provide system administrators and automated control systems a low-cost data center inspection service that gives insight into how distributed groups of black-boxes interact.
ACKNOWLEDGMENTS
We thank the reviewers for their help improving this paper. This work was supported in part by NSF grant CNS-1253575.
REFERENCES
[1] M. Pelillo, “Replicator equations, maximal cliques, and graph isomorphism,” Neural Comput., vol. 11, no. 8, pp. 1933–1955, Nov. 1999. [Online]. Available: http://dx.doi.org/10.1162/089976699300016034 [2] R. Ambauen, S. Fischer, and H. Bunke, “Graph
edit distance with node splitting and merging, and its application to diatom identification,” in Proceedings of the 4th IAPR international conference on Graph based representations in pattern recognition, ser. GbRPR’03. Berlin, Heidelberg: Springer-Verlag, 2003, pp. 95–106. [Online]. Available: http://dl.acm.org/citation.cfm?id=1757868.1757880 [3] M.-L. Fern´andez and G. Valiente, “A graph distance
metric combining maximum common subgraph and minimum common supergraph,” Pattern Recogn. Lett., vol. 22, no. 6-7, pp. 753–758, May 2001. [Online]. Available: http://dx.doi.org/10.1016/S0167-8655(01)00017-4
[4] V. D. Blondel, A. Gajardo, M. Heymans, P. Senellart, and P. V. Dooren, “A measure of similarity between graph vertices: Applications to synonym extraction and web searching,” SIAM Rev., vol. 46, no. 4, pp. 647–666, Apr. 2004. [Online]. Available: http://dx.doi.org/10.1137/S0036144502415960 [5] R. Z. Albert and A. lszl Barabsi Director, “Statistical
mechanics of complex networks,” 2001.
[6] C. Stewart and K. Shen, “Performance modeling and system management for multi-component online services,” in Proceedings of the 2nd conference on Symposium on Networked Sys-tems Design & Implementation - Volume 2, ser. NSDI’05. Berkeley, CA, USA: USENIX Association, 2005, pp. 71–84. [Online]. Available: http://dl.acm.org/citation.cfm?id=1251203.1251209 [7] B. Urgaonkar, P. Shenoy, and T. Roscoe,
“Resource overbooking and application profiling in a shared internet hosting platform,” ACM Trans. Internet Technol., vol. 9, no. 1, pp. 1:1–1:45, Feb. 2009. [Online]. Available: http://doi.acm.org/10.1145/1462159.1462160
[8] A. Gulati, G. Shanmuganathan, A. Holler, and I. Ahmad, “Cloud-scale resource management: challenges and techniques,” inProceedings of the 3rd USENIX conference on Hot topics in cloud computing, ser. HotCloud’11. Berkeley, CA, USA: USENIX Association, 2011, pp. 3–3. [Online]. Available: http://dl.acm.org/citation.cfm?id=2170444.2170447 [9] C. Raiciu, M. Ionescu, and D. Niculescu,
“Opening up black box networks with cloudtalk,” in Proceedings of the 4th USENIX conference on Hot Topics in Cloud Ccomputing, ser. HotCloud’12. Berkeley, CA, USA: USENIX Association, 2012, pp. 6–6. [Online]. Available: http://dl.acm.org/citation.cfm?id=2342763.2342769 [10] T. Benson, A. Akella, and D. A. Maltz, “Network
traffic characteristics of data centers in the wild,” in Proceedings of the 10th ACM SIGCOMM conference on Internet measurement, ser. IMC ’10. New York, NY, USA: ACM, 2010, pp. 267–280. [Online]. Avail-able: http://doi.acm.org/10.1145/1879141.1879175 [11] R. Tarjan, “Depth-first search and linear graph
algo-rithms,” inSwitching and Automata Theory, 1971., 12th Annual Symposium on, Oct., pp. 114–121.
[12] R. A. HORN and C. R. JOHNSON, “Matrix analysis,” Cambridge University Press, 1985.
[13] S. Melnik, H. Garcia-Molina, and E. Rahm, “Similarity flooding: A versatile graph matching algorithm and its application to schema matching,” inProceedings of the 18th International Conference on Data Engineering, ser. ICDE ’02. Washington, DC, USA: IEEE Computer Society, 2002, pp. 117–. [Online]. Available: http://dl.acm.org/citation.cfm?id=876875.879024 [14] B. C. Tak, C. Tang, C. Zhang, S. Govindan,
B. Urgaonkar, and R. N. Chang, “vpath: precise discovery of request processing paths from black-box observations of thread and network activities,” in Proceedings of the 2009 conference on USENIX Annual technical conference, ser. USENIX’09. Berkeley, CA, USA: USENIX Association, 2009, pp. 19–19. [Online]. Available: http://dl.acm.org/citation.cfm?id=1855807.1855826 [15] B. Sang, J. Zhan, G. Lu, H. Wang, D. Xu, L. Wang,
Z. Zhang, and Z. Jia, “Precise, scalable, and online request tracing for multitier services of black boxes,” Parallel and Distributed Systems, IEEE Transactions on, vol. 23, no. 6, pp. 1159 –1167, june 2012. [16] L. Hu, K. Schwan, A. Gulati, J. Zhang, and C. Wang,
“Net-cohort: Detecting and managing vm ensembles in virtualized data centers,” inICAC, 2012.