With which countries do tax havens
share information?
Katarzyna Bilicka and Clemens Fuest
Oxford University Centre for Business Taxation
Said Business School, Park End Street,
Oxford, Ox1 1HP
With which countries do tax havens share information?
Katarzyna Anna Bilicka and Clemens Fuest
Oxford University Centre for Business Taxation
yThis version: March 22 , 2012
Abstract
In recent years tax havens and o¤shore …nancial centres have come under increasing political pressure to cooperate with other countries in matters of taxation and e¤orts to crowd back tax evasion and avoidance. As a result many tax havens have signed tax information exchange agreements (TIEAs). In order to comply with OECD standards tax havens are obliged to sign at least 12 TIEAs with other countries. This paper investigates how tax havens have chosen their partner countries. We ask whether they have signed TIEAs with countries to which they have strong economic links or whether they have systematically avoided doing this, so that information exchange remains ine¤ective. We analyse 555 TIEAs signed by tax havens in the years 2008-2011 and …nd that on average tax havens have signed more TIEAs with countries to which they have stronger economic links. Our analysis thus suggests that tax havens do not systematically undermine tax information exchange by signing TIEAs with irrelevant countries. However, this does not mean that they exchange information with all important partner countries.
JEL: H26, H77, H87
Key Words: tax havens, tax information exchange agreements, tax evasion
We would like to thank Mike Devereux, Niels Johannesen, Anzhela Yevgenyeva and participants of the Oxford University Centre for Business Taxation Research Seminar for very helpful comments and suggestions. The usual disclaimer applies.
yOxford University Centre for Business Taxation, Said Business School, Park End Street, Oxford OX1 1HP, United Kingdom;
1
Introduction
In recent years, tax havens have been put under increasing political pressure to cooperate with high tax countries in e¤orts to reduce tax evasion and tax avoidance. One particular area of concern is the exchange of information for tax purposes. A recent example for this trend is a statement made by the G20 at its London summit in April 2009:
“We call on countries to adopt the international standard for information exchange...
We stand ready to take agreed action against those jurisdictions which do not meet international standards in relation to tax transparency.” G20 (2009), p.4
The fact that the G20 has put the issue of tax havens and o¤shore …nancial centres at the top of the international political agenda is the result of various developments. Firstly, the G20 initiative re‡ects that the …nancial crisis and the worldwide recession which started in 2008 has placed a huge burden on government …nances, so that e¤orts to crowd back tax evasion and collect revenue are necessary. At the same time, tax havens and o¤shore …nancial centres are seen to have contributed to the crisis by allowing …nancial institutions to escape …nancial regulation and supervision. Transparency in taxation and regulation are widely considered as mutually reinforcing.
Secondly, there is an ongoing debate about the implications of international tax competition for govern-ment …nances. Starting with a report launched in 1998, the OECD has argued that certain forms of tax
competition are harmful for the world economy as a whole because they undermine government …nances.1
Cases where countries seem to attract investors by o¤ering bank secrecy and protection against information exchange in tax matters are seen as one important form of harmful tax competition. The reason is that this practice allows investors residing in high tax countries to evade taxes.2 In order to encourage the
ex-change of tax information between countries the OECD has created the ‘Global Forum on Transparency and Exchange of Information for Tax Purposes’. The Forum includes both OECD member countries and non OECD countries. Its role is to provide a framework for international cooperation in the area of exchange of tax information.3
Many tax havens4 have reacted to this political pressure by changing their policies with regard to bank
secrecy and information exchange. Between 2000 and 2002 most of them made formal commitments to comply with the standards developed by the OECD. In 2002 the OECD published a ‘black list’of seven jurisdictions
which refused to make these commitments.5 Since then all of these jurisdictions have agreed to comply
with the standards. As part of these standards countries are expected to sign tax information exchange 1The EU has also launched an initiative against tax practices which are seen as harmful, which has led to a ‘code of conduct’ in business taxation, see of the European Union (1999). The focus of this code of conduct is on special tax regimes o¤ered to multinational …rms. For a critique of this approach see Keen (2001).
2Along similar lines the EU has taken initiative for more e¤ective enforcement of taxes on capital income by introducing automatic information exchange for tax purposes and source taxes within the European Union through its directive for the taxation of savings (Council Directive 2003/48/EC). For assessments of the impact of the directive see Hemmelgarn and Nicodeme (2009), Johannesen (2009) and Klautke and Weichenrieder (2010).
3There are at least two additional important factors driving the move towards more information exchange. Firstly, after the terrorist attacks on the United States on September 11, 2001, the US started to take action against o¤shore …nancial centres in order to make sure that these centres implement e¤ective measures against terrorism …nancing and money laundering. Secondly, various spectacular cases of tax evasion were detected because employees of banks stole data from their employers and passed it on to tax authorities in various countries. This has drawn the attention of the public to the issue of bank secrecy and tax evasion.
4When we refer to ‘tax havens’ in this paper we do so based on the list of countries classi…ed as tax havens by the OECD, to which we add Switzerland, Luxemburg, Hong Kong and Singapore. The list we use is provided in appendix A.
5These included Andorra, Liechtenstein, Liberia, the Republic of the Marshall Islands, Monaco, the Republic of Nauru and the Republic of Vanuatu.
agreements (TIEAs) with other countries. TIEAs are particularly important in cases where no double taxation agreements exists because double taxation agreements often include arrangements for information exchange. Currently tax havens are required to sign a minimum of 12 TIEAs in order to avoid being put on the list of uncooperative jurisdictions. Figure 1 illustrates the expansion in the number of TIEAs since the
year 2000. The total number of TIEAs signed in this period was 590.6 Among these agreements, 555 are
cases where at least one of the two partners is a tax haven.
Figure 1: Cumulative number of all TIEAs, 2000 - 2011.
0 100 200 300 400 500 600 01 /1 2/2 00 0 01 /0 4/2 00 1 01 /0 8/2 00 1 01 /1 2/2 00 1 01 /0 4/2 00 2 01 /0 8/2 00 2 01 /1 2/2 00 2 01 /0 4/2 00 3 01 /0 8/2 00 3 01 /1 2/2 00 3 01 /0 4/2 00 4 01 /0 8/2 00 4 01 /1 2/2 00 4 01 /0 4/2 00 5 01 /0 8/2 00 5 01 /1 2/2 00 5 01 /0 4/2 00 6 01 /0 8/2 00 6 01 /1 2/2 00 6 01 /0 4/2 00 7 01 /0 8/2 00 7 01 /1 2/2 00 7 01 /0 4/2 00 8 01 /0 8/2 00 8 01 /1 2/2 00 8 01 /0 4/2 00 9 01 /0 8/2 00 9 01 /1 2/2 00 9 01 /0 4/2 01 0 01 /0 8/2 01 0 01 /1 2/2 01 0 01 /0 4/2 01 1 01 /0 8/2 01 1 01 /1 2/2 01 1 nu m ber o f T IE A s
Figure 1. Cumulative number of all TIEAs, 2000 - 2011.
The large number of TIEAs suggests that the OECD initiative to foster tax information exchange is a big success. However, it cannot be excluded that tax havens formally comply with the requirement to have 12 TIEAs but choose partner countries other than those where tax evaders are likely to reside. A rather blunt way of doing so would be to choose other tax havens as partners. However, our database only includes 33 agreements where both partners are tax havens. A more subtle way of strategically choosing countries as partners would be to focus on countries which are not tax havens but which are unlikely to be residence countries of relevant investors in a tax haven.
This paper focuses on the question of how tax havens choose their partners for the signing of TIEAs and, as a consequence, whether the network of TIEAs develops so that it can be e¤ective in …ghting tax evasion. The e¤ectiveness of TIEAs in addressing tax evasion depends on whether TIEAs are signed in cases where they are actually relevant. With whom should we expect tax havens to sign TIEAs? Two hypotheses come to mind. Firstly, if tax havens host investments from residents of a particular set of countries, and if the tax haven wanted to avoid providing information about these investors to their residence countries, it could systematically avoid these countries as partners in TIEAs (hypothesis 1). Secondly, if a residence country knows that its residents favour a particular tax haven, it will try to achieve a TIEA precisely with this tax haven, rather than with other tax havens (hypothesis 2). Hypothesis 1 would imply that tax havens can actually decide freely whether or not they want to sign a TIEA with another country. Hypothesis 6This information is based on data on TIEA provided by the OECD. More information on our dataset is provided in section 5 of this paper.
2, in contrast, would suggest that residence countries can e¤ectively impose TIEAs on tax havens even if tax havens would prefer not to sign the agreement. It is our objective to investigate empirically whether hypothesis 1 or hypothesis 2 holds.
This raises various issues. We are interested in cases where residents try to conceal their assets from the tax authorities in their countries of residence. Unsurprisingly, no data is available to observe these asset holdings directly. Instead, we use a number of observable indicators for economic links which are likely to be related to these asset holdings. We focus on three indicators: foreign direct investment, foreign portfolio investment, and trade. These indicators are far from being ideally suited for our purposes, but they are the best available. The underlying assumption is that stocks of observable foreign investment and trade ‡ows will be positively correlated to activities involving tax evasion. We will discuss this issue further below.
Our main …ndings are as follows. On average stronger economic links increase the likelihood of signing agreements. This e¤ect is quite robust regarding foreign direct investment and trade. It is not very large, though. The average predicted probability of a tax haven signing a TIEA with a non-US country is 38%, while for the US it is 43.5%, given that FDI is used as a proxy for economic links between country pairs. Quantitatively, an extra $US 1 billion of FDI into a tax haven from a given country increases the likelihood of an agreement between the pair by 0.55%; the e¤ect for trade is stronger and equal to 1.7%. When it comes to portfolio investment data we …nd a coe¢ cient which is positive but not signi…cant.7 If we focus on the 5
partner countries which are most important in terms of economic links in the form of foreign direct investment for each haven, we …nd that on average tax havens have agreements on information exchange, either in the form of TIEAs or enshrined in double taxation agreements (DTAs), with 2.36 of those …ve countries. Moreover, only 21 (31) tax havens have concluded TIEA (TIEAs+DTAs) with their most important economic partner country. These results suggest that tax havens do not systematically avoid signing TIEAs with countries to which they have strong economic links. But the fact that, on average, tax havens only have agreements with roughly half of the …ve most important partner countries illustrates that not all important and potentially relevant countries are covered. Moreover, our analysis suggests that the threshold of 12 TIEAs might play a role. It seems that the activity of signing TIEAs slows down after countries have signed 12 of them. However, it is not clear how robust this …nding is because TIEAs are a rather recent phenomenon, so that studying dynamic aspects of their signing is di¢ cult.8
The rest of the paper is organized as follows. Section 2 summarizes the key principles and standards for international exchange of tax information suggested by the OECD as well as the content of the OECD model treaty for exchange of tax information. In section 3 we brie‡y review the relevant literature. In section 4 we discuss the main hypotheses which guide our empirical analysis. In section 5 we describe and take a …rst look at the data. Section 6 includes our regression analysis, a discussion of the results, and robustness checks. In section 7 we discuss whether the threshold of 12 TIEAs plays a role. Section 8 concludes.
2
The OECD principles for information exchange and the content
of TIEAs
As an important part of its initiative to promote international exchange of information for purposes of taxation the OECD has launched a model ‘arrangement on exchange of information on tax matters (OECD, 7One should note that the available portfolio investment data does not report portfolio investment of residents of one country in another country. It reports holdings of securities by residents of one country which are issued in another country. As we will discuss further below it is not clear how relevant this type of economic link is to our analysis.
2002).9 This model treaty aims at establishing information exchange which is guided by the following
principles:10
1. Information is exchanged upon request, not automatically.
2. Information is provided if this information is ‘foreseeably relevant’to the administration and enforce-ment of the tax laws of the requesting country.
3. Bank secrecy laws or domestic tax interest requirements should not restrict exchange of information for tax matters.
4. Countries should make sure that their administration has the power to obtain information and that the information acquired is reliable.
5. Taxpayer’s rights should be respected. This implies in particular that information exchanged is strictly con…dential.
These principles have been broken down into 10 ‘essential elements’of tax information exchange, which address the implementation of information exchange. Of these 10 elements, three apply to the availability of information, two are about access to information and …ve are related to the exchange of information.11 Based on these elements, the Global Forum has established a review process to make sure that all jurisdictions do provide tax information in a way which is compatible with the principles and standards described above.12
The taxes covered by the OECD model treaty include taxes on income and pro…ts, taxes on capital, taxes on net wealth and, …nally, estate, inheritance and gift taxes (Article 3.1.). The model treaty also foresees the possibility to extend the coverage of the agreement to indirect taxes (Article 3.2). Furthermore, the OECD model treaty includes rules regarding more detailed aspects of the information exchange (Article 5), speci…es conditions under which a request for information may be denied (Article 7) and foresees an arrangement about the sharing of the cost of providing information (Article 9).
The OECD model treaty for tax information exchange is not binding for OECD countries or other countries. It has the purpose to set standards for the exchange of tax information, so that countries designing and negotiating TIEAs have a benchmark to which they can refer. Most TIEAs that have been signed between countries since 2002 are very similar to the OECD model treaty. One should note that provisions for the exchange of tax information are also included in many double taxation agreements (DTAs). The OECD model double taxation treaty foresees arrangements for the exchange of tax information (Article 26) based on the same principles as those which apply to TIEAs.13 This implies that separate TIEAs are particularly relevant for cases where no double taxation treaties exist, where these treaties do not include provisions for information exchange or where the information exchange provisions fail to comply with OECD standards.
9Information exchange for tax matters is also foreseen by article 26 of the OECD model double taxation convention (OECD (1977)) as well as article 26 of the United Nations double taxation convention (UN (2001)).
1 0See OECD (2011), The Global Forum on transparency and exchange of information for tax purposes, Information Brief, 15 December 2011, p.7.
1 1The elements can be found in OECD (2011) p.7-8
1 2For more detailed information on the peer review process see OECD (2011), Annex V, pp 17-19. 1 3A similar article is included in the United Nations Model taxation treaty, see UN (2001), Article 26.
3
The Literature
This paper is related to a small but growing theoretical and empirical literature which explores various
aspects of the exchange of information for tax purposes.14 The studies most closely related to our paper
are Ligthart and Voget (2008) and Johannesen and Zucman (2012). Ligthart and Voget (2008) analyse the empirical determinants of information sharing for income taxation between the Netherlands and other countries. The paper uses data on cases of tax information sharing between the Dutch government and other countries. These cases include requests from other countries to the Dutch government and vice versa, in the time span between 1992 and 2005. The authors …nd that the level of the domestic income tax rate, the size of the marginal cost of public funds, and the share of a country’s interest-bearing deposits held abroad increase a country’s willingness to engage in information sharing. Foreign non-resident withholding taxes do not seem to a¤ect the amount of information that is provided to the Netherlands. The authors also …nd that size and distance are correlated with the information provision by partner countries, which is in line with a basic gravity pattern. In addition, reciprocity turns out to be important; if the Dutch authorities supply more information to a foreign government, the likelihood that the foreign government will also provide information increases.
The present paper di¤ers from Ligthart and Voget (2008) in various respects. Most importantly, we look at what determines the signature of tax information exchange agreements, not the number of information requests. Moreover, we focus on agreements between tax havens and non-haven countries.
Johannesen and Zucman (2012) investigate the impact of TIEAs on bank deposits in tax havens. Using con…dential data about bank deposits in tax havens provided by the Bank for International Settlements (BIS), they …nd that the signing of TIEAs has led to a modest relocation of bank deposits between tax havens but no signi…cant repatriation of funds. The di¤erence to our paper is that we focus on the determinants of TIEAs, not on the impact of TIEAs on bank deposits.
There are various other empirical studies which are related to our analysis. Huizinga and Nicodeme (2004) investigate the impact of tax policy on international depositing. They …nd that international patterns of bank deposits across 19 industrialized countries in 1999 were signi…cantly a¤ected by tax rates. But they …nd little evidence that international information exchange (for 1999 data) has an impact on bilateral depositing. This is relevant for our investigation in so far as it suggests that there is no reverse causality problem between information exchange and portfolio investment or bank deposits.
Our paper is also related to the literature on the empirical determinants of double taxation agreements. In a recent paper Ligthart and Voget (2011) analyse the determinants of double tax treaty formation. Our paper is complementary to their work. They …nd that countries enter into bilateral tax treaties primarily to reduce the double taxation of income and to provide legal instrument for the exchange of taxpayer speci…c information between national tax authorities. More speci…cally, personal tax rates, non-resident withholding tax rates (on dividends and interest), and stocks of foreign direct investment positively a¤ect the probability of DTA formation. Country pairs with a more asymmetric allocation of foreign direct investment are less likely to conclude a DTA, whereas a common language makes it more likely to enter into a DTA.
Their study uses a sample of 189 countries, of which only 15 are tax havens. It considers information exchange agreements as one of the determinants of double tax treaties formation. We do exactly the reverse of that, by including a double tax treaties dummy as one our explanatory variables. The empirical method
they use is a dynamic probit approach which controls for unobserved regional heterogeneity.15 The data
1 4Keen and Ligthart (2006a) o¤er an introduction to the key issues in the debate on information exchange.
used by Ligthart and Voget (2011) spans a long time period. TIEAs, in contrast, are a recent development. This is why we do not use the same dynamic panel approach in our paper.
Another strand of the empirical literature related to our topic focuses on the analysis of the EU Savings Taxation Directive. For example, Hemmelgarn and Nicodeme (2009) review the economic e¤ects of the directive using con…dential data on bilateral international bank deposits and …nd that the directive had no signi…cant e¤ects on international savings or on the development of di¤erent investments that fall under the scope of the Directive. Klautke and Weichenrieder (2010) investigate the impact of the directive by comparing the returns on bonds which are exempt from the directive to bonds which are not exempt. They …nd no signi…cant di¤erence and conclude that, due the existing loopholes, the impact of the directive is negligible. Johannesen (2009) investigates the e¤ects of the directive by comparing Swiss bank deposits of residents from EU countries to deposits of residents from non-EU countries and …nds that deposits from EU residents have declined, which suggests that the directive has had an e¤ect.
The theoretical literature mostly investigates whether countries competing for international investors have incentives to provide information for tax matters to other governments (see Bacchetta and Espinosa (2000), Bacchetta and Espinosa (1995), Eggert and Kolmar (2002), Huizinga and Nielsen (2003), Keen and Ligthart (2006b) and Elsayyad and Konrad (2011)). Bacchetta and Espinosa (1995) consider a two stage model where the degree of information sharing is set at stage 1 and tax rates are determined at stage 2. This approach leads to the result that incentives for countries to voluntarily transmit information to other countries may arise if this information provision mitigates tax rate competition. But it may very well be that countries do not share information. In this framework small countries are more likely to provide information than large countries. Bacchetta and Espinosa (2000) look at repeated interaction between countries and analyse the role of tax information exchange clauses in double taxation treaties. Among other things, they …nd that small countries are less likely to cooperate in tax information exchange than large countries. The reason is that small countries worry less about being able to tax their own residents and are more interested in attracting foreign investors, either because this generates rents for domestic banks or because they levy a source based tax.
Eggert and Kolmar (2002) analyse the incentives of tax authorities to voluntarily provide information. Speci…cally, they show that voluntary information exchange is an equilibrium in a standard small-country model of tax competition, whereas it may not be an equilibrium when the size of the …nancial sector has positive impact on the wage structure of an economy.
Huizinga and Nielsen (2003) analyse the sustainability of information exchange and source taxes in a model with repeated interaction. They derive conditions under which information exchange can be sustained as a cooperative equilibrium. Keen and Ligthart (2006b) build on the approach by Huizinga and Nielsen (2003) and add revenue sharing to the model. They emphasize that revenue sharing between the host and the residence country may intensify tax rate competition, but revenue sharing may be required to induce the source countries to agree to information exchange. Finally, Elsayyad and Konrad (2011) develop a model with multiple tax havens. They compare a process where tax havens are drawn into cooperation for tax purposes sequentially to a big bang solution, where all tax havens decide whether or not to participate in a cooperation agreement. The analysis leads to the result that the sequential solution is more costly than the big bang solution and less likely to succeed. The reason is that, as the number of uncooperative tax havens declines, competition between tax havens becomes less intense, so that the bene…t from being a tax haven increases.
4
The hypotheses guiding our empirical analysis
For purposes of our paper the most important hypothesis emerging from the theoretical literature is that small countries with low residence based taxes on capital income have few incentives to engage in information exchange.
An aspect less well explored in the theoretical literature is whether large countries with high residence based taxes can exert pressure on tax havens, either indirectly through institutions such as the OECD and its ‘naming and shaming’ of jurisdictions which deny information exchange, or directly, for instance by threatening to disrupt economic relations. One example for the latter would be the threat of the United States to e¤ectively ban Swiss banks from operating in the US if they do not provide information on bank accounts of US residents.
In the following we will take into account this aspect as well and focus on two rather simple hypotheses. The …rst hypothesis states that tax havens will avoid signing TIEAs with countries if they think that they attract a lot of investment from these countries that escape taxation in the residence countries and are therefore sensitive to the exchange of tax information. The second hypothesis is that, to the contrary, tax havens are more likely to sign TIEAs with the residence countries of the investors the tax havens attract. This is because residence countries will have a strong interest to sign TIEAs exactly with those tax havens where their domestic residents are most likely to locate investment which escapes residence based taxation. If the residence countries cannot force tax havens to sign TIEAs if they do not want to, the …rst hypothesis is likely to hold. In contrast, if the residence countries can put enough pressure on tax havens, they may be able to impose TIEAs on them, which would mean that the second hypothesis is supported.
For obvious reasons it is impossible to directly observe investment which escapes residence based taxation. Many international investments are fully disclosed to the residence countries of the investors, so that they should be una¤ected by information exchange. In our empirical analysis we will focus on three variables as proxies for the volume of economic activity which is likely to escape residence based taxation without information exchange: foreign direct investment, trade, and foreign portfolio investment.
We will consider the following two hypotheses:
Hypotheses: The likelihood that a TIEA between a tax haven i and a country j exists is decreasing (hypothesis 1) or increasing (hypothesis 2) in the volume of relevant economic links between i and j.
Relevant economic links are measured by the following three variables: the stock of FDI country j holds in tax haven i, the volume of exports from country j to tax haven i, and the stock of portfolio investment country j holds in tax haven i. The data we use will be described in greater detail in the next section.
5
Data and descriptive analysis
5.1
Data
We use data from various sources. Our dependent variable, the existence of bilateral TIEAs, is taken from the information on TIEAs provided by the OECD, on its website on tax information exchange (http://www.eoi-tax.org/). We have taken into account all TIEAs reported in this database and signed before January 1st, 2012. In our analysis we also take into account cases where double taxation agreements exist and include provisions for information exchange. The OECD has established a review process which checks whether double taxation agreements comply with the OECD standards for information exchange. The results are publicly available, and we use them in our analysis as speci…ed further below.
Our key explanatory variables are foreign direct investment, trade and foreign portfolio investment. FDI data comes from two sources: OECD and Eurostat. The OECD compiles a dataset on bilateral observations of foreign direct investment stocks from OECD countries into tax havens and vice versa. Eurostat compiles a very similar dataset to the OECD one. We use it as a complement to the OECD database, as it spans slightly di¤erent set of countries - European Union. Thus we merge the two datasets and convert the amounts into $US dollars.
The portfolio investment data comes from the Coordinated Portfolio Investment Survey (CPIS), which is conducted on an annual basis since 2001 by IMF. The …rst pilot survey data was collected in 1997 and the latest available data is for 2010. As de…ned on the IMF website the purpose of the CPIS is to “collect information on the stock of cross-border holdings of securities-equity securities and long- and short-term debt securities-valued at market prices prevailing at end-December of the reference year”.
Portfolio investment is de…ned as the purchase of stocks or bonds by foreigners for the purpose of realizing a …nancial return, which does not result in active foreign ownership. The CPIS data we use is broken down by the economy of residence of the issuer of the securities. There are around 75 countries reporting their portfolio investment positions into the full subset of tax havens; the reporting countries also include 13 tax havens.
It is important to emphasize that the portfolio investment holdings in this dataset do not measure investments where residents of one country necessarily hold bank accounts in other countries. Rather, portfolio investments of country A in country B mean that residents of country A hold securities issued in country B. For instance, if a resident of the Netherlands holds a bond issued in Cayman Islands in his brokerage account in the Netherlands, this will be classi…ed as a portfolio investment going from the Netherlands to the Cayman Islands. Therefore the portfolio investment data cannot be used to directly measure portfolio investment in bank accounts located in tax havens and held by residents of other countries. Given, this, one could argue that FPI is probably the least relevant indicator for economic links in the context of our paper. The fact that residents of a high tax country buy securities issued in a tax haven does not necessarily imply that they ever go to that tax haven, know anyone there or have a bank account there.
Finally, trade data comes from the OECD and IMF databases. Both report bilateral exports and imports from reporting countries into tax havens.
5.2
Descriptive Analysis
Before the OECD model treaty for information exchange in tax matters was launched in 2002, separate bilateral agreements for tax information exchange were the exception. Usually information exchange was regulated by double taxation agreements. As illustrated by Figure 1 in the introduction, the spreading of TIEAs started rather slowly in the early 2000s and accelerated drastically in the years 2009 and 2010.
Given that the motivation for introducing TIEAs is to prevent tax evasion by residents of high tax countries, we are particularly interested in the TIEAs where tax havens are at least one of the partners. This applies to 555 out of 590 TIEAs in our database. Figure 2 shows how the TIEAs signed by tax havens on at least one side are distributed across groups of partner countries. We distinguish between tax havens, OECD countries, and non-OECD-countries. The …gure shows that most agreements with tax havens on one side have been signed by OECD countries on the other side.
Among the 44 tax havens in our sample, 34 have signed at least one TIEA. 6 tax havens have not signed TIEAs because they have information exchange clauses in their DTAs. 4 tax havens (Maldives, Tonga, Niue and Nauru) have not signed any TIEAs yet but have committed to doing so. Figure 3 illustrates the number
of TIEAs signed by the individual tax havens and the structure of partner countries for each tax haven. The tax havens in our sample have signed TIEAs with OECD- as well as non-OECD-countries. 19 tax havens have also signed TIEAs with other tax havens.
A closer look at the countries which have signed TIEAs with tax havens reveals a striking pattern. Table 1 shows the number of TIEAs signed by tax havens, per partner country. We …nd that seven of the ten countries with the largest number of agreements are Nordic countries: they include Greenland, The Faroe Islands, Norway, Sweden, Iceland, Finland and Denmark. It seems natural to suggest that Greenland and The Faroe Islands are cases where tax havens try to sign TIEAs with small countries of limited relevance, while the other Nordic countries are countries with high taxes and strong institutions for tax enforcement and therefore have a strong interest to get access to tax information.
However, the reason for the presence of these countries at the top of the list is much simpler. In 2006 and in response to the OECD e¤ort to curb tax evasion the Nordic Council of Ministers decided to start a project of Nordic co-operation in the area of tax enforcement. The objective of that co-operation is to coordinate the Nordic approach for entering into TIEAs with tax havens. The Nordic countries also expected that the cooperation will strengthen their negotiation position and keep costs down.16 The co-operation is
scheduled to last until 2012, resulting in more agreements in 2012. As a result all Nordic countries sign the same TIEAs. This explains why Greenland and Faeroe Islands, in spite of their small size, have such a large number of agreements.
Our main interest is to investigate whether tax havens have signed TIEAs with countries to which they have strong economic links. To give a …rst impression, we have checked whether tax havens have signed TIEAs with the …ve countries to which they have the strongest economic links, measured by inward foreign direct investment into the tax haven from this country, inward foreign portfolio investment, and exports to the tax haven from the partner country. In the following, we refer to these countries, which may di¤er for each individual tax haven, as the top 5 FDI, FPI and trade countries, respectively. Figures 4-6 illustrate the results for foreign direct investment, foreign portfolio investment and trade. One important issue in this context is that some tax havens have DTAs that include information exchange provisions, rather than
TIEAs. Therefore we report TIEAs with the top 5 partners as well as TIEAs plus DTAs.17 Figure 4 focuses
on the top 5 FDI countries.18 No tax haven has signed TIEAs with all 5 countries. But some tax havens
which use DTAs do cover all …ve partner countries. The same applies to the top 5 trade countries. 38 out of 44 tax havens in the sample have signed a TIEA or a double taxation agreement with at least one of the top 5 FDI countries. On average, tax havens have signed agreements (TIEAs or DTAs) with 2.36 of the top 5 FDI countries. This is signi…cant but maybe less than one might expect. For the top 5 FPI partners the coverage is slightly lower with an average of 1.91 TIEAs, while for trade slightly higher: 2.5.
1 6For details on how the procedure looks see: http://www.norden.org/en/nordic-council-of-ministers/councils-of-ministers/council-of-ministers-for-…nance-mr-…nans/tax-information-exchange-agreements
1 7It is important to distinguish between ordinary DTAs and the ones that OECD lists as meeting the standards of information exchange. Here we only include DTAs that meet the standards set by the OECD.
Figure 2: Cumulative number of TIEAs signed by tax havens on at least one side, 2008 - 2011. 0 100 200 300 400 500 600 0 1 /0 1 /2 0 0 8 0 1 /0 3 /2 0 0 8 0 1 /0 5 /2 0 0 8 0 1 /0 7 /2 0 0 8 0 1 /0 9 /2 0 0 8 0 1 /1 1 /2 0 0 8 0 1 /0 1 /2 0 0 9 0 1 /0 3 /2 0 0 9 0 1 /0 5 /2 0 0 9 0 1 /0 7 /2 0 0 9 0 1 /0 9 /2 0 0 9 0 1 /1 1 /2 0 0 9 0 1 /0 1 /2 0 1 0 0 1 /0 3 /2 0 1 0 0 1 /0 5 /2 0 1 0 0 1 /0 7 /2 0 1 0 0 1 /0 9 /2 0 1 0 0 1 /1 1 /2 0 1 0 0 1 /0 1 /2 0 1 1 0 1 /0 3 /2 0 1 1 0 1 /0 5 /2 0 1 1 0 1 /0 7 /2 0 1 1 0 1 /0 9 /2 0 1 1 0 1 /1 1 /2 0 1 1 n u m b er o f T IE A s
Figure 2. Cumulative number of TIEAs signed by tax havens on at least one side, 2008 - 2011.
cum no total cum no with OECD cum no with tax havens
Figure 3: Number of TIEAs signed by each tax haven, ranked by number of TIEAs with other tax havens.
0 5 10 15 20 25 30 35 Gu er n sey B ah am as B er m u d a Jer sey Is le o f Ma n C ay m an I slan d s San Ma rin o Neth er lan d s A n till es Vir g in I slan d s B ritis h A ru b a L iech ten stein Vin ce n t an d th e Gr en ad in es A n d o rr a A n tig u a an d B ar b u d a Mo n ac o St Kitts an d Nev is Gib raltar A n g u illa St L u cia Do m in ica T u rk s an d C aico s Is lan d s C o o k I slan d s Gr en ad a B elize Sam o a Van u atu L ib er ia Ma rs h all Is lan d s Mo n ts er rat Sey ch elles B ah rain Ma u ritiu s B ar b ad o s P an am a
Figure 3. Number of TIEAs signed by each tax haven, ranked by number of TIEAs with other tax havens.
Table 1: Number of TIEAs each country signed with tax havens
OECD country # TIEAs tax haven # TIEAs non OECD non tax
haven
# TIEAs
Denmark 34 Aruba 8 Faroe Islands 34
Finland 33 Netherlands Antilles 7 Greenland 34
Iceland 33 San Marino 6 Argentina 8
Australia 32 Liechtenstein 5 China 6
Norway 32 Monaco 5 India 6
Sweden 31 Bahamas 4 South Africa 6
Netherlands 27 Guernsey 4 Indonesia 4
France 24 Andorra 3 Romania 1
Germany 21 Antigua and Barbuda 3
United Kingdom 21 Cayman Islands 3
Ireland 19 St Kitts and Nevis 3
New Zealand 18 St Vincent and the
Grenadines
3
Portugal 16 Bermuda 2
Belgium 14 Samoa 2
Canada 14 St Lucia 2
United States 13 Vanuatu 2
Mexico 8 British Virgin Islands 2
Czech Republic 6 Grenada 1
Japan 6 Seychelles 1 Spain 5 Austria 4 South Korea 2 Poland 2 Slovenia 2 Greece 1 Italy 1 Turkey 1
Figure 4: Number of TIEAs and TIEAs+DTAs with the top 5 FDI importers - OECD countries. 0 4 10 6 10 14 2 6 18 4 8 6 0 2 4 6 8 10 12 14 16 18 20 5 4 3 2 1 0 nu m ber o f tax hav en s
number of TIEAs & DTAs
Figure 4a. Number of TIEAs and TIEAs+DTAs with the top 5 FDI importers - OECD countries
number of TIEAs number of TIEAs+DTAs
Figure 5: Number of TIEAs and TIEAs+DTAs with the top 5 FPI importers.
0 2 5 8 10 19 0 5 11 11 9 8 0 2 4 6 8 10 12 14 16 18 20 5 4 3 2 1 0 nu mb er o f tax hav en s
number of TIEAs & DTAs
Figure 4b. Number of TIEAs and TIEAs+DTAs with the top 5 FPI importers.
number of TIEAs number of TIEAs+DTAs
Figure 6: Number of TIEAs and TIEAs+DTAs with the top 5 trade importers.
0 3 9 10 5 13 4 4 13 11 3 5 0 2 4 6 8 10 12 14 5 4 3 2 1 0 nu m ber o f tax h av en s
number of TIEAs & DTAs
Figure 4c. Number of TIEAs and TIEAs+DTAs with the top 5 trade importers.
number of TIEAs number of TIEAs+DTAs
Note: Jersey, Isle of Man, Guernsey and Monaco are excluded from this …gure. We do not have any trade data for those countries.
Figure 7: Number of TIEAs and TIEAs+DTAs with the bottom 5 trade importers. 0 0 4 8 12 16 0 0 6 12 11 11 0 2 4 6 8 10 12 14 16 18 5 4 3 2 1 0 nu mb er of tax hav en s
number of TIEAs & DTAs
Figure 5. Number of TIEAs and TIEAs+DTAs with the bottom 5 trade importers.
number of TIEAs number of TIEAs+DTAs
Note: Jersey, Isle of Man, Guernsey and Monaco are excluded from this …gure. We do not have any trade data for those countries.
Moreover, we …nd that tax havens not always sign the TIEA with their most important economic partner. In case of FDI only 21 (31) tax havens have signed TIEAs (TIEAs+DTAs) with their most important economic partner. The numbers are even smaller for FPI and trade.
These …ndings suggest that tax havens do not seem to face an overwhelming pressure to sign TIEAs with the countries to which they have the strongest economic links. Does this imply that the tax havens focus on signing agreements with countries to which they have no or negligible economic links? Figure 5 illustrates the number of TIEAs tax havens have with the bottom 5 trade countries. The results for the bottom FDI and FPI countries are given in the appendix. Here we …nd that no tax haven has signed TIEAs with more than three out of …ve bottom trade partners.19
6
Regression results and robustness checks
6.1
The model
To test the hypothesis described above we estimate a model where dependent variable is a dummy which
takes value 1 if there is a TIEA between tax haveni and reporting countryj, and 0 otherwise. A pair of
countiesiandj adopts a TIEA if and only if: T IEAij =f
1ifT IEAij 0 0ifT IEAij<0;
where T IEAij denotes a latent variable:
T IEAij= + Fij+ Xi+ Xj+ Xij+"ij:
Here Fij describes the economic link between tax haven i and reporting country j, Xi the vector of tax haven characteristics, Xj is a vector of reporting country characteristics, Xij is a vector of country pair 1 9Note that the data we use has a lot of missing observations. When we look at the bottom 5 partners we do not consider missing observations but only the ones where zero value was reported. It may well be that when the missing value is reported there is no investment either. Thus the results in Figure 7 and in Table 1A in the Appendix might be underestimating the true number of TIEAs signed with bottom 5 partners. The same could also hold for top 5 partners.
characteristics and"ij is normally distributed error term. The parameter describes the e¤ect of economic link on the probability of a TIEA, whereas ; ; are the vectors of coe¢ cients of country and country pairs characteristics. This simple binary choice model is estimated using a probit model.
In our baseline regression we use TIEAs signed after 1st January 2007 as the dependent variable. To evaluate the impact of economic links, we use stocks of FDI and FPI at the end of 2007 as well as the sum
of exports from j to i in the period from 2001 to 2007. We use year 2007 for two reasons: Firstly, most
of the agreements were signed in 2009-2010. Leaving a lag of two years from the signature to the start of negotiations seems plausible. Secondly, 2007 is the last year before the …nancial crisis, so that the economic link variable we use is not a¤ected by the crisis.
The result tables include 5 speci…cations. Each of these uses a di¤erent variable to proxy for the economic links between country pairs:
1. FDI: bilateral FDI stock from reporting country (OECD country only) into tax haven
2. FDI_total: bilateral FDI stock from reporting country (OECD+EU only) into tax haven
3. OECD_trade: exports from reporting country (OECD country only) into tax haven
4. IMF_trade: exports from reporting country into tax haven
5. FPI: portfolio investment, de…ned as purchase of shares and bonds issued by tax haven, by reporting
country residents
Due to data limitations, we only have OECD countries in the reporting countries group for FDI and
OECD_trade. Therefore the conclusions drawn for those two variables apply only to the formation of TIEAs
with OECD countries. For the other three regressions the sample is larger and includes European Union
countries forFDI_total and the whole world forIMF_trade and FPI.
Each of these speci…cations includes a US dummy and an interaction variable between the economic link proxy and US dummy to control for a di¤ering impact of links to the US for the likelihood of treaty formation.
Importantly, to account for the lack of many non-OECD countries in some of the samples, each regression includes the total number of non-OECD TIEAs each tax haven has and interacts this variable with the economic link proxy. The idea behind that is that the larger the number of non-OECD TIEAs, either existing or under negotiation, the smaller the pressure on a tax haven to sign an additional TIEA. This would suggest that there is a simple substitution e¤ect between TIEAs with OECD and non-OECD countries.
In turn, the interaction term accounts for the fact that as the number of non-OECD TIEAs grows, the importance of the economic links variable might decline. Again, this is because pressure from OECD countries with strong economic links may be less e¤ective if a tax haven has a number of TIEAs with other countries or is in the process of negotiating them.
Additionally, since some of the tax havens on the OECD list have not signed any TIEAs, we drop those from the sample and use only the ones that have at least 1 TIEA signed. This means we do not include Cyprus, Hong Kong, Luxembourg, Maldives, Malta, Nauru, Niue, Singapore, Switzerland, Tonga and the U.S. Virgin Islands. Moreover, since we are using only post 2007 TIEAs, we drop the country pairs that signed an agreement before 2007. Otherwise they would show as observations with large ‡ows and no treaty and bias our coe¢ cients. As a result country pairs such as US and Cayman Islands or UK and Bermuda are
not considered here. Finally, we exclude TIEAs signed before 2000 such as the one between US and Marshall Islands.20
6.1.1 Control variables
We use a number of control variables suggested as determinants of the information exchange agreements in the theoretical literature discussed above. As such, we include gravity equation measure for the distance between countries and country size measures approximated by the population sizes and GDPs. We expect distance to be negatively related to the likelihood of the TIEA signature and population size and GDP to be positively related to the analyzed probability. We also have GDP per capita as a control variable.
We include an OECD membership dummy for reporting countries. We expect it to positively impact the probability of signing a TIEA. Intuitively, since harmful tax practices was an OECD initiative we would expect that the probability of signing TIEA with an OECD country is higher than with a non-OECD country. This is clearly in line with the summary statistics presented in Figure 2.
The presence of a common colonial origin is likely to have a positive impact on the analysed probabil-ity. The presence of a double taxation agreement that meets OECD standards of information exchange is supposed to negatively a¤ect the probability of an agreement. Those DTAs include an information sharing clause. Therefore they are a substitute for TIEAs.
We also take into account corporate and personal tax rate di¤erences. The higher the corporate or personal tax rate di¤erence between a reporting country and a tax haven, the larger the scope for tax evasion and avoidance. Whether a larger di¤erence makes a TIEA more or less likely depends on whether the interests of the high tax country or the tax haven dominate.
We also include an institutional measure which is supposed to control for the institutional quality of the partner and reporting countries. As suggested by Dharmapala and Hines Jr. (2009) evidence from US …rms shows that low tax rates o¤er much more powerful inducements to foreign investment in well-governed countries than do low tax rates elsewhere. Here, we use the control of corruption measure assembled by the World Bank.
Moreover, we control for non-resident withholding tax rates on interest.21 More precisely, we include the
di¤erence between the top tax rate on interest income of residents and the withholding tax on interest income of non-residents. The literature refers to this measure as the ‘tax gap’. If this tax gap is large, a country will be interested in exchanging information for tax purposes and vice versa (Bacchetta and Espinosa (2000),
Huizinga and Nielsen (2003)). The measure is also used by Ligthart and Voget (2011).22 The tax gap is
included for both reporting and partner countries.
Finally, we include the total number of tax information exchange agreement signed by tax haven as well as reporting country.
2 0Clearly, all this implies that we drop important tax havens from our sample. In the robustness checks we therefore run our regressions with data from 2001 and for all agreements after 2001. The results are similar.
2 1From 2008 the EU Savings Directive applied in some countries, but the withholding taxes applicable under this rate have not been taken into the account, since we include the information for the 2007 year only. The data on withholding taxes comes from E&Y Worldwide Corporate Tax Report 2007.
2 2Intuitively, the additional revenue a country collects from the foreign savings of its own residents (which are brought into tax due to tax information sharing) exceeds the loss of revenue from non-resident savings (which will be relocated to ’information free’ places).
6.2
Regression results
6.2.1 Baseline regression
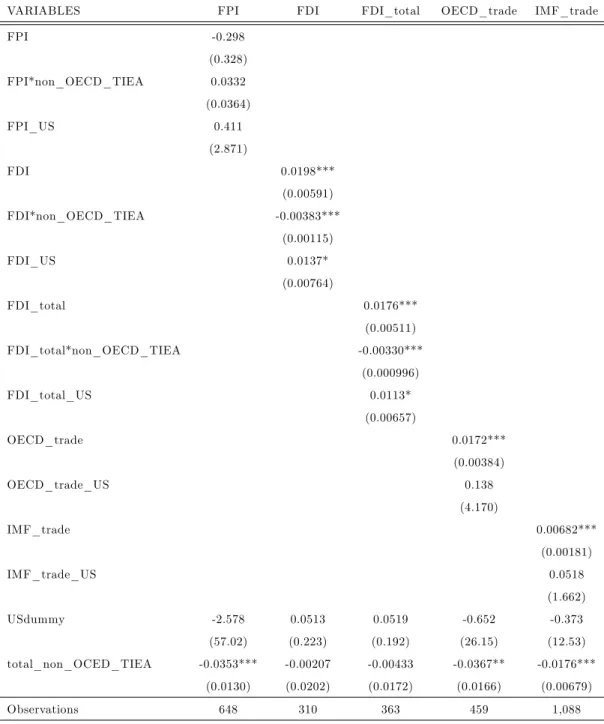
In our baseline regression we …nd that economic links have a positive impact on the likelihood of tax information exchange treaty formation (see Table 2).23 The e¤ect is strong and positive for FDI and trade.
For FDI an average marginal e¤ect is 0.55% for non US investment and 1.7% for US investment.24 For
OECD trade the average marginal e¤ect is much stronger - namely 1.74% - for non-US investment and insigni…cant for US investment. The e¤ect of FPI is not signi…cant. The average predicted probability of tax haven signing TIEA with non-US country is 38%, while for US it is 43.5% when FDI is used to proxy for economic links between country pairs.
This is in line with the results from Figures 4-6, which show that on average tax havens sign the largest proportion of TIEAs with their top 5 trade importers, followed by FDI and then FPI importers.
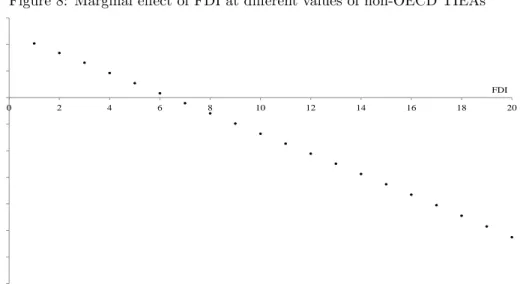
Our hypothesis that the likelihood of the treaty formation declines with the number of non-OECD TIEAs is con…rmed. More importantly, the impact of economic links is weaker, the larger the number of non-OECD TIEAs signed, turning negative at large values of these. This is especially true for FDI, while for trade the number of non-OCED TIEAs does not change the result. For example, the positive impact of economic links on the likelihood of an OECD treaty formation turns negative at more than 6 non-OECD TIEAs for FDI (see Figure 8).
However, at the mean value of non-OECD TIEAs (3.6), the e¤ect is positive: 0.7% and comparable to the average marginal e¤ect.
Figure 8: Marginal e¤ect of FDI at di¤erent values of non-OECD TIEAs
-7% -6% -5% -4% -3% -2% -1% 0% 1% 2% 3% 0 2 4 6 8 10 12 14 16 18 20 m ar gin al ef fec t FDI Figure 6. Marginal effect of FDI at different values of non-OECD TIEAs
It is important to note that the results presented here are robust to the inclusion of the US dummy and US investment. Thus, we are con…dent that these results are not driven by the relationship between the US and tax havens.
2 3The coe¢ cients reported in the tables are average marginal e¤ects.
2 4This means that extra $US 1 billion of investment increases the likelihood of an agreement by 0.55%; the standard deviation for FDI is $US 13 billion and for trade is $US 7.8 billion.
Table 2: Marginal e¤ects from baseline Probit models with non-OECD treaties; post 2007 TIEAs.
VARIABLES FPI FDI FDI_total OECD_trade IMF_trade
FPI -0.298 (0.328) FPI*non_OECD_TIEA 0.0332 (0.0364) FPI_US 0.411 (2.871) FDI 0.0198*** (0.00591) FDI*non_OECD_TIEA -0.00383*** (0.00115) FDI_US 0.0137* (0.00764) FDI_total 0.0176*** (0.00511) FDI_total*non_OECD_TIEA -0.00330*** (0.000996) FDI_total_US 0.0113* (0.00657) OECD_trade 0.0172*** (0.00384) OECD_trade_US 0.138 (4.170) IMF_trade 0.00682*** (0.00181) IMF_trade_US 0.0518 (1.662) USdummy -2.578 0.0513 0.0519 -0.652 -0.373 (57.02) (0.223) (0.192) (26.15) (12.53) total_non_OCED_TIEA -0.0353*** -0.00207 -0.00433 -0.0367** -0.0176*** (0.0130) (0.0202) (0.0172) (0.0166) (0.00679) Observations 648 310 363 459 1,088
Standard errors in parentheses *** p<0.01, ** p<0.05, * p<0.1
6.2.2 Shares regression
So far we have used absolute values for the economic link variables. In this section we use shares, rather than absolute values. For instance, for the Cayman Islands we sum all the incoming investment and calculate what proportion comes from each reporting country. This gives us a share variable for each country pair. The reason for considering shares is that they may re‡ect the relative importance of a reporting country as an economic partner of a tax haven. Therefore shares might be interpreted as an indicator of leverage a reporting country has, relative to a particular tax haven. This method also controls for the di¤erences between tax havens that receive large values of investment (such as Cayman Islands) and the ones that receive small values of investment (e.g. Vanuatu). In the absolute values speci…cation, Cayman Islands-US pair is more likely to sign the TIEA than Vanuatu-US because the value of investment from US to Cayman Islands is much larger than the one to Vanuatu. However, when considering shares, it may well be that the share of investment into Vanuatu coming from US is much larger than the one coming to Cayman Islands, which might cause the former pair to be more likely to conclude an agreement.
In Table 3 we regress the shares of investment described above on our dependent variable in a similar fashion to the baseline regression. We …nd that the shares regression results con…rm our baseline speci…ca-tions. Again the e¤ect of economic links is positive, with the average marginal e¤ect of FDI being 15.5% for
non US investment and 52.7% for US investment.25
Similar to the baseline regression, the e¤ect of economic links weakens as tax havens have more non-OECD TIEAs and turns negative at larger values of these. The variation in marginal e¤ects of FDI at di¤erent values of non-OECD TIEAs is very similar to the baseline regression case, as the marginal e¤ect again turns negative at 6 non-OECD TIEAs (the range of marginal e¤ects goes from 50% at zero non-OECD TIEAs to -132% at 20 non-OECD TIEAs). The results again are the strongest for FDI and trade, while much weaker for FPI (in terms of average marginal e¤ects).
In case of trade the e¤ect again does not vary with the number of non-OECD TIEAs, however here the US exports are signi…cant in their own right – the average marginal e¤ect of trade is signi…cantly negative for US share of exports and signi…cantly positive for other countries investment. The reason for that is that US doesn’t have a post 2007 TIEA with any of its top 15 largest trade partners (in terms of shares of exports as a percentage of total exports into a tax haven); even for all TIEAs it does not have an agreement with any of its top 9 partners. That was not the case for the absolute values of investment.
2 5This means that 100% increase in shares of investment in tax haven increases the likelihood of TIEA formation by 15.5% for non-US investment; standard deviation is 17%.
Table 3: Marginal e¤ects for Probit models with non-OECD treaties, using shares; post 2007 TIEAs.
VARIABLES FPI FDI FDI_total OECD_trade IMF_trade
FPI_shares 0.553** (0.219) FPI*non_OCED_TIEA_shares -0.180*** (0.0601) FPI_US_shares 0.116 (0.230) FDI_shares 0.513** (0.221) FDI*non_OCED_TIEA_shares -0.0994** (0.0456) FDI_US_shares 0.438 (1.169) FDI_total_shares 0.410** (0.182) FDI_total*non_OCED_TIEA_shares -0.0811** (0.0380) FDI_total_US_shares 0.315 (0.387) OECD_trade_shares 0.446** (0.180) OECD_trade_shares_US -0.952*** (0.340) IMF_trade_shares 0.325*** (0.124) IMF_trade_shares_US -0.830** (0.363) USdummy -0.181 -0.251 -0.0866 0.300 0.127 (0.170) (0.827) (0.304) (0.189) (0.0889) total_non_OCED_TIEA -0.0386*** 0.00132 -0.00510 -0.0353* -0.0195** (0.0145) (0.0193) (0.0162) (0.0183) (0.00769) Observations 617 310 363 459 1,088
Standard errors in parentheses *** p<0.01, ** p<0.05, * p<0.1
6.3
Robustness checks
Most importantly we check whether the results presented above are robust to the inclusion of double tax agreements that contain information exchange provisions. To do so, we construct a new dependent variable that is equal to 1 if there is a TIEA or DTA that meets OECD standards between a pair of countries. Using this new dependent variable we run the same regressions as in Tables 2 and 3. The results presented in Tables 4 and 5 con…rm our baseline regression. In the case of absolute values the e¤ect of FDI and FPI on the likelihood of an agreement containing information exchange provisions is much stronger than in case of only TIEAs –the average marginal e¤ect for non-US FDI is almost 6% here. The same is true for the shares regressions (21.9% here versus 15.5% in case of TIEAs only).
We check for the e¤ects of investment out of tax havens into reporting countries (see Table 6). The results are far less signi…cant than for the investment coming into tax havens.
We also test the hypothesis proposed by Ligthart et al (2011), according to which country pairs with a more asymmetric allocation of FDI are less likely to conclude a double taxation agreement. In the case of TIEAs a similar reasoning might apply, although what one would expect is likely to depend again on assumptions about which side of the agreement has more leverage. In Table 7 we report the …ndings, which indicate that in case of TIEAs the relationship is, interestingly, reverse. The more asymmetric the allocation of investment, the more likely it is that the countries will conclude a TIEA. This might be interpreted as re‡ecting the pressure of reporting countries on tax havens to sign agreements. However, the result might also arise because in case where economic link variables are larger the absolute values of asymmetries will also be larger.
The results from the baseline regression are robust to the inclusion of all the TIEAs (see Table 8). To test for that, we use 2001 data to approximate for the economic relationship between countries that signed a TIEA before 2007, leaving the post 2007 data unchanged.
The robustness of the results was also tested instrumenting 2007 investment numbers with 2005 values. The marginal e¤ects from maximum likelihood estimation in Table 9 indicate that the positive correlation between economic relations and the existance of a TIEA between countries is a robust one. We show only the results for FPI and FDI as these two were the cases where we detected serious endogeneity problems.
Table 4: Marginal e¤ects from Probit models with non-OECD treaties; post 2007 TIEAs and DTAs meeting information exchange standards.
VARIABLES FPI FDI FDI_total OECD_trade IMF_trade
FPI 0.0350* (0.0188) FPI*non_OECD_TIEA -0.00385* (0.00208) FPI_US -0.00158 (0.00532) FDI 0.101*** (0.0385) FDI*non_OECD_TIEA -0.0114*** (0.00418) FDI_US -0.00138 (0.0104) FDI_total 0.0686*** (0.0265) FDI_total*non_OECD_TIEA -0.00765*** (0.00288) FDI_total_US -0.00198 (0.00734) OECD_trade 0.0186*** (0.00576) oecd_trade_US 0.279 (10.70) IMF_trade 0.00802*** (0.00252) IMF_trade_US 0.112 (2.335) USdummy -0.288 0.00700 0.0102 -1.871 -1.060 (0.471) (0.273) (0.190) (65.87) (19.53) total_non_OCED_TIEA -0.0306** 0.00582 -0.00274 -0.0233 -0.00975 (0.0148) (0.0234) (0.0156) (0.0218) (0.00951) Observations 697 310 457 459 1,088
Standard errors in parentheses *** p<0.01, ** p<0.05, * p<0.1
Table 5: Marginal e¤ects from Probit models with non-OECD treaties; using shares, post 2007 TIEAs and DTAs meeting information exchange standards.
VARIABLES FPI FDI FDI_total OECD_trade IMF_trade
FPI_shares 0.499* (0.255) FPI*non_OCED_TIEA_shares -0.159** (0.0682) FPI_US_shares 0.316 (0.410) FDI_shares 0.622*** (0.221) FDI*non_OCED_TIEA_shares -0.110*** (0.0397) FDI_US_shares 0.318 (0.686) FDI_total_shares 0.409*** (0.144) FDI_total*non_OCED_TIEA_shares -0.0763*** (0.0269) FDI_total_US_shares 0.239 (0.386) OECD_trade_shares 0.339 (0.211) OECD_trade_shares_US -1.359 (1.002) IMF_trade_shares 0.211 (0.192) IMF_trade_shares_US -1.241 (1.344) USdummy -0.265 -0.171 -0.112 0.274 0.0834 (0.298) (0.515) (0.302) (0.272) (0.175) total_non_OCED_TIEA -0.0307* 0.0137 0.00116 -0.0219 -0.00916 (0.0161) (0.0234) (0.0157) (0.0228) (0.00983) Observations 666 310 457 459 1,088
Standard errors in parentheses *** p<0.01, ** p<0.05, * p<0.1
Table 6: Robustness check: marginal e¤ects from Probit models with non-OECD treaties; post 2007 TIEAs; investment out of tax havens.
VARIABLES FPI_out FDI_out OECD_trade_out
FPI_out -0.302 (0) FPI_out*non_OCED_TIEA 0.0337 (0) FPI_out_US -14.33 (0) FDI_out 0.0841** (0.0362) FDI_out*non_OCED_TIEA -0.0103** (0.00445) FDI_out_US 0.0273 (0.0341) OECD_trade_out 0.0213 (0.0423) OECD_trade_US 0.213*** (0.0706) USdummy 34.00 0.0532 -0.0815 (0) (0.211) (0.187) total_non_OCED_TIEA -0.0474 0.0118 -0.0221 (0) (0.0210) (0.0155) Observations 248 322 537
Standard errors in parentheses *** p<0.01, ** p<0.05, * p<0.1
Table 7: Robustness check: marginal e¤ects from Probit models with non-OECD treaties; post 2007 TIEAs; investment assymetries.
VARIABLES FDI_out OECD_trade_out
FDI_di¤ 0.0248*** (0.00677) FDI_di¤*non_OCED_TIEA -0.00592*** (0.00154) FDI_di¤_US 0.0262*** (0.00933) OECD_trade_di¤ 0.0172*** (0.00391) USdummy -0.215 -0.742 (0.241) (25.15) total_non_OCED_TIEA 0.0349 -0.0360** (0.0232) (0.0167) Observations 282 457
Standard errors in parentheses *** p<0.01, ** p<0.05, * p<0.1
Table 8: Robustness check: marginal e¤ects from Probit models with non-OECD treaties, all TIEAs.
VARIABLES FPI FDI FDI_total OECD_trade IMF_trade
FPI 0.0308 (0.0246) FPI*non_OECD_TIEA -0.00343 (0.00273) FPI_US 0.000159 (0.00192) FDI 0.0200*** (0.00599) FDI*non_OECD_TIEA -0.00415*** (0.00114) FDI_US 0.0168** (0.00755) FDI_total 0.0177*** (0.00502) FDI_total*non_OECD_TIEA -0.00334*** (0.000978) FDI_total_US 0.0116* (0.00659) OECD_trade 0.0176*** (0.00439) oecd_trade_US 0.154 (10.90) IMF_trade 0.00689*** (0.00210) IMF_trade_US 0.0602 (3.504) USdummy -0.343 0.0211 0.0305 -0.745 -0.442 (0.561) (0.220) (0.191) (60.44) (27.45) total_non_OCED_TIEA -0.0230* -0.00632 -0.00940 -0.0230 -0.0120 (0.0133) (0.0195) (0.0166) (0.0175) (0.00744) Observations 652 313 365 464 1,093
Standard errors in parentheses *** p<0.01, ** p<0.05, * p<0.1
Table 9: Robustness check: marginal e¤ects from Instrumental Variables Probit models with non-OECD treaties, post 2007 TIEAs (using 2005 values of investment as instruments.)
VARIABLES FPI FDI FDI_total
FPI 0.00267 (0.00436) FDI 0.0865*** (0.746) FDI_total 0.0809*** (0.463) USdummy -0.0313 0.176 0.143 (0.181) (1.552) (0.868) total_non_OCED_TIEA -0.0349** -0.0530 -0.0413 (0.0141) (0.457) (0.237) Observations 629 237 295
Standard errors in parentheses *** p<0.01, ** p<0.05, * p<0.1
7
The 12 TIEAs threshold
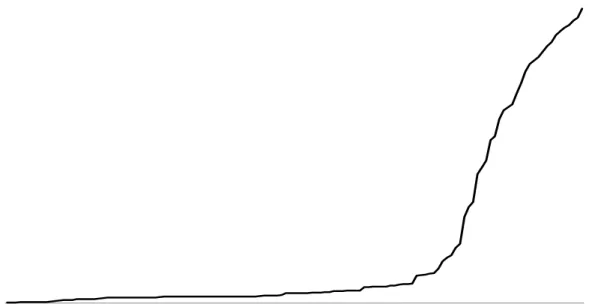
It is interesting to ask whether tax havens become more reluctant to sign additional TIEAs after they have signed the 12 agreements necessary to comply with the threshold de…ned by the OECD. Investigating this empirically is problematic because the signing of TIEAs started just a few years ago. In order to gain some preliminary insight we have compiled data about the number of days between TIEAs signed by each tax haven. The idea is to check whether the expansion of the treaty network slows down after a country has reached the threshold of 12 agreements set by the OECD. Figure 9 illustrates the relationship between the number of days required to reach an additional agreement and the number of existing agreements. The graph suggests that, indeed, the process of signing additional TIEAs slows down above the threshold.
Using this data we have also carried out a simple regression analysis. We regress the number of days required to reach an nth TIEA on the number of TIEAs already concluded at the time of this nth agreement and on the dummy called below_12 threshold. The dummy is 1 when the average of TIEAs a tax haven has is below 12 and 0 otherwise. We also interact those two variables.
We …nd that being below 12 TIEAs threshold decreases the number of days required to reach the nth agreement. In addition the number of TIEAs signed before has a positive impact on the number of days required to reach an nth agreement. In other words the larger the number of TIEAs tax havens have already concluded, the slower is the pace of concluding further agreements. Finally, the impact of the number of existing TIEAs is much larger after the 12 TIEAs were signed than below this threshold.
7.1
First 12 TIEAs
We know that tax havens are still signing new TIEAs therefore it is hard to draw predictions for the full network of TIEAs that will be in place once the OCED initiative is over. However, we can look at the …rst 12 TIEAs that each tax haven signed to get a better understanding of the driving force of the initial agreements.
Figure 9: Average number of days required to reach an nth TIEA. 0 500 1,000 1,500 2,000 2,500 3,000 3,500 2 3 4 5 6 7 8 9 10 11 12 13 14 15 16 17 18 19 20 21 22 23 24 25 26 27 28 29 30 31 32 33 Nu m b er o f d ay s number of TIEAs
Figure 7: Average number of days required to reach an nth TIEA.
To do so, we construct a dependent variable called …rst_12_TIEAs. There is an issue when tax haven
signed various TIEAs on the same day and when that happens around the threshold. For example, when a tax haven has 10 TIEAs and then signs 4 more on one day. We experiment with both including all TIEAs at the threshold and excluding them. The results shown in Table 10 suggest that for the …rst 12 TIEAs FDI matters far more than for all the TIEAs signed by a given tax haven. However, FPI and trade e¤ects are weaker here. What is interesting here is that in case of FDI, US investment has a much larger e¤ect on the likelihood of the TIEA than in the full sample. This suggests that US has been pushing for the TIEAs until the …rst 12 were signed, afterwards its impact got diluted.
Moreover, the e¤ect of FDI is positive and very strong for the case when tax haven has no non-OCED TIEAs. Once the number of non-OECD TIEAs increases the e¤ect of FDI diminishes at a much faster rate than in the full sample (it turns negative at 3 TIEAs with non-OECD countries). Surprisingly, in case of non-US investment the average marginal e¤ect of FDI is negative yet insigni…cant. This would suggest that once a tax haven is involved in the signature of TIEAs with non-OECD countries, the power that large FDI stocks give to the OECD countries diminishes much faster in this limited sample.
Table 10: Marginal e¤ects from Probit models with non-OECD treaties for …rst 12 TIEAs; post 2007 TIEAs.
VARIABLES FPI FDI FDI_total OECD_trade IMF_trade
FPI -0.183 (0.329) FPI*non_OECD_TIEA 0.0193 (0.0365) FPI_US 0.278 (2.542) FDI 0.0287*** (0.00840) FDI*non_OECD_TIEA -0.0101*** (0.00238) FDI_US 0.0614*** (0.0177) FDI_total 0.0251*** (0.00721) FDI*total_non_OECD_TIEA -0.00874*** (0.00205) FDI_total_US 0.0532*** (0.0152) OECD_trade 0.0191*** (0.00659) oecd_trade_US 0.148 (6.155) IMF_trade -0.0129 (0.0180) IMF_trade_US 0.0658 (3.777) USdummy -1.701 -0.149 -0.0989 -0.0366 -0.0536 (51.19) (0.309) (0.263) (34.27) (26.97) total_non_OCED_TIEA -0.00430 0.0234 0.0193 -0.0121 -0.00323 (0.0132) (0.0191) (0.0163) (0.0178) (0.00687) Observations 648 310 363 459 1,088
Standard errors in parentheses *** p<0.01, ** p<0.05, * p<0.1
8
Conclusions
This paper investigates whether tax havens have signed TIEAs with countries to which they have strong and important economic links, or whether they have signed agreements with less relevant countries, possibly in order to avoid tax information exchange in cases where it is relevant. The main …nding of this paper is that the former seems to hold. The countries classi…ed as tax havens have systematically signed more
TIEAs with countries to which they have stronger economic links in the form of foreign direct investment and trade. The results for foreign portfolio investment are weaker, but as we have explained in the paper the portfolio investment data we use is probably less suited for our purposes than the FDI and the trade data, mainly because it does not measure investment located in tax havens. However, an important caveat is that this does not mean treaties for information exchange cover all relevant countries. On average tax havens only have treaties with roughly half of their …ve most important economic partner countries. In so far the network of treaties for information exchange is far from complete.
These results suggests that the OECD initiative for more information exchange in tax matters is successful in that it has induced tax havens, on average, to sign TIEAs with the right countries. Pit di¤erently, we …nd no support for the view that tax havens try to undermine tax information exchange by systematically signing TIEAs with irrelevant countries, where information exchange is unlikely to matter because economic relationships are negligible. However, if the objective is to have information exchange among all countries with signi…cant economic links, there is still some way to go. Another issue raised by our analysis is whether the process of signing TIEAs slows down after the threshold of 12 agreements has been reached. Our …ndings suggest that this may indeed be the case, but more time has to pass before we can see how robust this result really is.
Of course, the spreading of TIEAs will only lead to e¤ective information exchange if countries also set up the administrative and legal infrastructure required to make this exchange practicable. Also, one would expect taxpayers who try to evade taxes in their countries of residence to react to the spreading of TIEAs. In particular in the case of highly mobile portfolio investment one can expect that taxpayers who evade taxes might move their assets to tax havens without TIEAs with their residence countries. Thus, even if it is true, as we have suggested, that investment which evades residence based taxation is currently located in tax havens with economic links to the residence country, that correlation may become weaker as taxpayers react to TIEAs. However, the growing network of TIEAs is likely to make tax evasion more di¢ cult and more costly. Moreover, as the number of TIEAs continues to grow, this relocation of assets may reach its limits.
9
Appendix A
Table 1A. List of tax havens together with the total number of Tax Information Exchange Agreements and Double Tax Agreements signed by each.
reporting country bottom FDI partner, TIEAs bottom 5 FPI partner, TIEAs
zero FDI obs number of TIEAs zero FPI obs or bottom 5 number of TIEAs
Andorra 13 4 26 10
Anguilla 16 9 27 9
Antigua and Barbuda 15 8 19 3
Aruba 15 5 19 4
Bahamas 5 2 5 1
Bahrain 7 3 13 0
Barbados 10 0 17 1
Belize 14 7 16 4
Bermuda 5 2 5 (3 zero obs) 1
British Virgin Islands 2 0 5 (4 zero obs) 0
Cayman Islands 2 0 5 (3 zero obs) 0
Cook Islands 14 7 31 6 Dominica 13 7 28 8 Gibraltar 9 5 13 1 Grenada 16 9 25 6 Guernsey 7 4 7 2 Isle of Man 6 3 19 5 Jersey 6 4 5 2 Liberia 8 3 15 2 Liechtenstein 9 5 16 2 Marshall Islands 13 6 13 1 Monaco - - 27 6 Montserrat 18 7 31 6
Netherlands Antilles 8 3 5 (1 zero obs) 0
Panama 6 0 5 0
Samoa 15 7 33 5
San Marino 18 9 31 9
Seychelles 15 4 23 3
St Kitts and Nevis 14 6 29 8
St Lucia 15 8 27 8
St Vincent and the Grenadines 11 6 29 8
Turks and Caicos Islands 16 9 30 9