ALMA MATER STUDIORUM - UNIVERSITÀ DI BOLOGNA
SCUOLA DI INGEGNERIA E ARCHITETTURA DIPARTIMENTO DI ARCHITETTURA
(DA)
CORSO DI LAUREA IN INGEGNERIA EDILE-ARCHITETTURA
TESI DI LAUREA In
Progettazione Sostenibile
Energy and architectural renovation towards nZEB
The Dutch Scheveningen case in the ABRACADABRA Project
CANDIDATA RELATORE: Maria Sofia Pitulis Chiar.ma Prof.ssa Annarita Ferrante CORRELATORE: Giovanni Mochi CORRELATORE ESTERNO: Nico Nieboer Anno Accademico 2015/2016 Sessione III
Energy and architectural renovation towards nZEB
The Dutch Scheveningen case in the ABRACADABRA Project
Table of contents
1 Introduction ... 9
1.1 Motivation ... 9
1.2 Statement of the problem ... 10
1.3 Methodology ... 11
1.3.1 Literature Review ... 12
1.3.2 Design Case Study ... 12
2 Energy efficiency measures... 12
2.1 Introduction ... 12
2.2 Green building construction and cities' densification ... 13
2.3 The existing housing stock in Europe ... 13
2.4 The existing housing stock in the Netherlands ... 16
2.5 European policies ... 16
2.5.1 Definition of energy renovation in EU legislation ... 19
2.6 The Dutch policies ... 20
2.6.1 Introduction ... 20
2.6.2 Energy labels ... 20
2.6.3 Energiesprong ... 22
2.6.4 The non-profit housing sector ... 23
2.6.5 The private sector ... 25
3 The energy demand of the heating system ... 26
4 Add-ons as a strategy ... 27 4.1 Introduction ... 27 4.2 The strategy ... 27 4.3 ABRACADABRA Project ... 28 5 Examples ... 28 5.1 Introduction ... 28
5.2 The Himmerland Housing Association, Departments 19 & 22 ... 28
5.3 The ‘Bois Le Prêtre’ tower metamorphosis ... 29
5.4 The Giesshübel pile up ... 30
5.5 Tower and line social housing blocks in Bologna ... 31
6.1 Environmental and physical climatic criticalities ... 33
6.1.1 Location ... 33
6.1.2 Road network and permeability ... 34
6.1.3 Sun and temperatures ... 35
6.1.4 Wind Rose ... 37
6.1.5 Sun, wind and rain combination ... 38
6.2 Construction criticalities ... 39
6.2.1 Brief history of the buildings ... 39
6.2.2 Insulation and windows ... 42
6.2.3 Distribution of functions ... 43
6.2.4 Ventilation ... 45
6.2.5 Buildings’ deterioration ... 45
6.3 SWOT Analysis ... 46
6.4 Energy Demand as built ... 48
7 Design phase ... 53
7.1 Energy renovation of the existing ... 54
7.2 Energy Demand as designed ... 58
7.3 Local regulations on physical planning ... 64
7.4 The actual design ... 65
7.5 The parameters ... 65
7.6 Scenarios of feasibility of the investment ... 66
7.6.1 Scenario zero ... 68 7.6.2 First scenario ... 69 7.6.3 Second scenario ... 70 7.6.4 Third scenario ... 71 7.6.5 Fourth scenario ... 72 7.7 Master plan ... 73 7.7.1 Demolition ... 73 7.7.2 Plan ... 74 7.8 Proposal ... 75 7.8.1 Wooden structure ... 75 7.8.2 Winter gardens ... 78 7.8.3 Rooftop additions ... 85 7.8.4 Assistant building ... 101 7.9 Technical details ... 104
8 Conclusions and recommendations ... 110
8.1 Conclusions ... 110
8.1.1 Process summary ... 110
8.1.2 Examples conclusions ... 111
8.1.3 Dutch case study conclusions ... 112
8.2 Recommendations ... 116
8.2.1 Recommendations for further research ... 116
8.2.2 Recommendations for other practices ... 116
9 Bibliography ... 116
10 Sitography ... 117
List of Figures
Figure 2.1 Building in the district of Kypseli, Athens (source: google images) Figure 2.2 1967 Residential building in Scheveningen, The Hague (source: author) Figure 2.3 Brief timeline of European energy policies (source: author)
Figure 2.4 Energiesprong’s business model (source: author)
Figure 2.5 Oud-Vossemeer, example of Energiesprong’s work (source: www.energiesprong.nl)
Figure 2.6 Percentage of dwellings with energy efficiency measures applied and not (source: author)
Figure 2.7 Percentages of energy effciency measures applied (source: author) Figure 3.1 Energy Gains and Dispersions scheme for a house (source: author)
Figure 5.1 Sustainable precautions and pictures of the construction phases (source graphics: author, source pictures: www.cfmoller.com)
Figure 5.2 Sustainable precautions and pictures of the construction phases (source graphics: author, source pictures: www.druot.net)
Figure 5.3 Sustainable precautions, pictures, section and floor plan (source graphics: author, source pictures: www.burkhalter-sumi.ch)
Figure 5.4 Sustainable precautions, renderings and technical detail (source: author) Figure 6.1 Map of The Hague with division of districts and focus on Scheveningen (source: author)
Figure 6.2 Focus on case study buildings (source: author) Figure 6.3 View of Scheveningen’s beach (source: author)
Figure 6.4 Principal transport routes and green areas near the case study buildings (source: author)
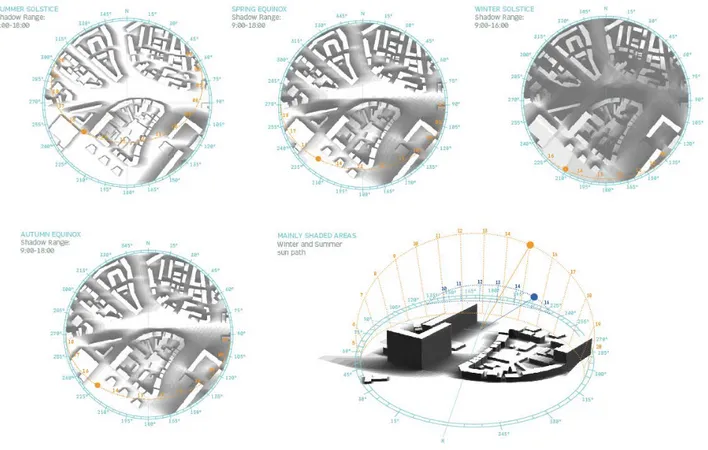
Figure 6.5 Different shading scenarios following the seasons and mainly shaded areas (source: author; software: Autodesk Ecotect Analysis)
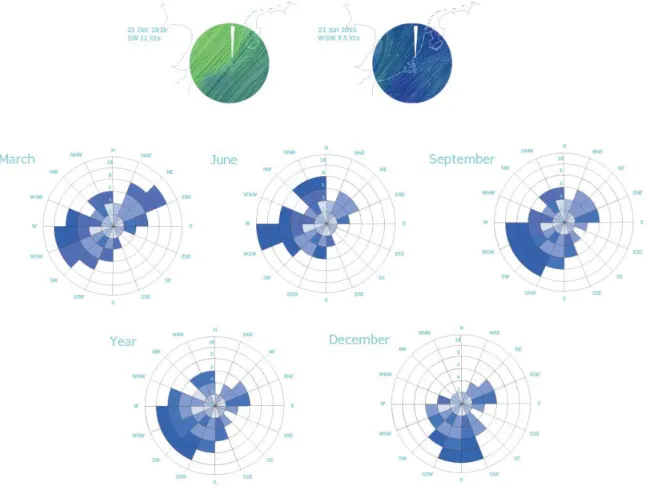
Figure 6.6 Wind directions (source: author)
Figure 6.7 Combination of wind and shading in winter period (source: author; software: Autodesk Ecotect Analysis)
Figure 6.8 Partition in blocks A and B and related civic numbers (source: author)
Figure 6.9 Available documents from the cadastre (1920-1929) (source: Urban Climate Architects)
Figure 6.10 Available documents from the cadastre (1931-1938) (source: Urban Climate Architects)
Figure 6.11 Available documents from the cadastre (1946-1947) (source: Urban Climate Architects)
Figure 6.12 Available documents from the cadastre (1960-1969) (source: Urban Climate Architects)
Figure 6.13 Windows distinction, percentages of windows type per block and ratios between windows area and wall area per orientation (source: author)
Figure 6.14 Partition of dwellings for each floor (source: author) Figure 6.15 Blocks’ dimensions (source: author)
Figure 6.16 Inner ventilation in the dwellings (source: author)
Figure 6.17 Brick types and buildings’ deterioration (source: author) Figure 6.18 SWOT Analysis: strengths
Figure 6.19 SWOT Analysis: weaknesses (source: author)
Figure 6.20 SWOT Analysis: opportunities and threats (source: author)
Figure 6.21 Architectural components’ details: layers, thicknesses and thermal transmittances (U) (source: author)
Figure 6.22 Daily average irradiation on north and south facades during winter period (source: author; software: Autodesk Ecotect Analysis)
Figure 7.1 New roof’s layers (source: author)
Figure 7.2 New ground floor’s layers (source: author) Figure 7.3 New walls’ layers (source: author)
Figure 7.4 Maximum surfaces and heights of rooftop additions on blocks A and B and new constructions in demolition area (source: author)
Figure 7.5 Actual project: Urban Climate Architects (source: Urban Climate Architects) Figure 7.6 Parameters of comparison between the projects (source: author)
Figure 7.7 Economic values for the scenarios (source: author) Figure 7.8 First scenario: adhesions (source: author)
Figure 7.9 Second scenario: rooftop additions (source: author)
Figure 7.10 Third scenario: adhesions, rooftop additions and assistant buildings (source: author)
Figure 7.11 Demolition area (source: author)
Figure 7.12 Master plan: before and after the intervention, percentages of permeable, impermeable and semipermeable soil, type of trees and bushes, evolution of the concept (source: author)
Figure 7.13 Different shading scenarios following the seasons (source: author; software: Autodesk Ecotect Analysis)
Figure 7.14 Cross and Glue laminated timber (source: www.kirhammond.wordpress.com) Figure 7.15 UBC’s tall wood building, Brock Commons (source: www.news.ubc.ca)
Figure 7.16 UBC’s wooden structure and gypsum boards encapsulation (source: www.hermann-kaufmann.at)
Figure 7.17 Thermal coat addition and steel pillars to sustain the rooftop addition: ground, first and second floor (source: author)
Figure 7.18 Scheme of the new volumes: winter gardens (source: author)
Figure 7.19 Scheme of the adhesions to the existing dwellings: before and after dimensions (source: author)
Figure 7.21 First floor plan: before and after the intervention (source: author) Figure 7.22 Composition scheme of the new volumes (source: author)
Figure 7.23 Winter garden module and external stairs for dwelling (f) (block B) (source: author)
Figure 7.24 Location of movable and unmovable brise soleil: ground and first floors (source: author)
Figure 7.25 Renders (source: author)
Figure 7.26 South facade view: winter gardens (source: author)
Figure 7.27 Scheme of the new volumes: rooftop additions (source: author) Figure 7.28 Rooftop additions: structure (source: author)
Figure 7.29 Seismic mapping of the Netherlands and The Hague location (source: Seismic Hazard Harmonization in Europe, 2013)
Figure 7.30 Abacus for different family units combinations (source: author)
Figure 7.31 Chosen facade composition for blocks A1 and A2 rooftop additions (source: author)
Figure 7.32 Second floor plan: rooftop additions blocks A1 and B (source: author) Figure 7.33 Third floor plan: rooftop additions blocks A1, A2 and B (source: author) Figure 7.34 Fourth floor plan: rooftop additions blocks A1, A2 and B (source: author) Figure 7.35 Fifth floor plan: rooftop additions block A2 (source: author)
Figure 7.36 Internal partition of the apartment: elderly couple (source: author) Figure 7.37 Internal partition of the apartment: young couple (source: author) Figure 7.38 Internal partition of the apartment: family (source: author)
Figure 7.39 Internal partition of the apartment: studio (source: author) Figure 7.40 Architectural component: winter garden (source: author) Figure 7.41 Architectural component: balcony (source: author) Figure 7.42 IJburg houses (source: google images)
Figure 7.43 Internal partition of the apartment: rooftop addition on block B (source: author) Figure 7.44 Abacus of the main architectural components: roof, walls and facade (source: author)
Figure 7.45 Rooftop additions: perspective north and south views renders (source: author) Figure 7.46 Rooftop additions: north and south facades renders (source: author)
Figure 7.47 Scheme of the new volumes: assistant building (source: author) Figure 7.48 Assistant building’s structure (source: author)
Figure 7.49 Assistant buildings’ ground and first floor plans (source: author) Figure 7.50 Assistant buildings’ internal partition: ground floor (source: author) Figure 7.51 Assistant buildings’ internal partition: first floor (source: author)
Figure 7.52 Assistant buildings: north and south facade renders and perspective render south view (source: author)
Figure 7.53 Technical detail: connection between pillar and existing brick wall (source: author)
Figure 7.54 Technical detail: existing building’s new roof (source: author)
Figure 7.55 Technical detail: 3D connection between pillar and existing brick wall and existing building’s new roof (source: author)
Figure 7.56 3D detail of the existing buildings’ new wall: thermal transmittance and layers’ thicknesses (source: author)
Figure 7.57 3D details of the architectural components of the assistant buildings, with
Figure 7.58 Photovoltaic panels on rooftop additions (source: author)
List of Tables
Table 2.1 Different Energy labels and Indexes depending on different Primary Energy Consumption, valid until 2014 (source: author)
Table 6.1 Thermal transmittances: roof, ground floor and walls (source: author) Table 6.2 PEI and annual energy cost for block A (source: author)
Table 6.3 PEI and annual energy cost for block B (source: author)
Table 7.1 New thermal transmittances: roof, ground floor and walls (source: author) Table 7.2 PEI and annual energy cost for block A after energy renovation (source: author) Table 7.3 PEI and annual energy cost for block B after energy renovation (source: author) Table 7.4 Photovoltaic surface needed and total cost for blocks A and B (source: author) Table 7.5 PEIs comparison: proposed interventions and national standard interventions Table 7.6 Summary data from the scenarios (source: author)
Table 7.7 PEI, photovoltaic square meters needed and photovoltaic cost: existing refurbished buildings + winter gardens, rooftop additions & assistant buildings (source: author)
Table 7.8 PEI, photovoltaic square meters needed and photovoltaic cost: existing refurbished buildings, rooftop additions & assistant buildings (source: author) Table 8.1 Process summary and objectives (source: author)
Table 8.2 Main characteristics of the add-ons examples (source: author) Table 8.3 Final surfaces: Dutch case study (source: author)
Table 8.4 Summary table about scenarios’ data (source: author)
List of Graphs
Graph 2.1 Age of dwellings in Northern Europe (source: author)
Graph 2.2 Flows of materials, energy and water of consolidation, transformation and new construction (source: author)
Graph 5.1 Temperatures and rain statistics, Rotterdam Airport Meteorological Station (source: author)
Graph 6.1 Cumulative scenarios for block’s A PEI in kWh/sqm year (source: author) Graph 6.2 Cumulative scenarios for block’s B PEI in kWh/sqm year (source: author)
Graph 6.3 Different energy efficiency measures combinations for block A in kWh/sqm year (source: author)
Graph 6.4 Different energy efficiency measures combinations for block B in kWh/sqm year (source: author)
Abstract
The motivation to apply energy efficiency measures to existing buildings is that the built environment is greatly responsible for the CO2 emissions and for the energy use of Europe.
Since that, a strategy must be found that could lead to the creation of a new market for energy renovation of existing buildings. The ABRACADABRA add-ons strategy is one possible solution as it has been thought in order to overtake the feasibility problems related to the energy renovation interventions on buildings. Hence, the major objective of this study is to identify the necessary conditions that could make possible an add-ons strategy intervention for an existing case study, concerning the normative, architectural, economic and technologic issues. For these purposes, a mixed research was carried out, including a literature review, the analysis of existing case studies and the design of add-ons on a Dutch case study. The literature review presents the 'state of the art' of energy efficiency interventions in the existing housing stock in Europe and the European regulation elaborated for this purpose. Then, the analysis of case studies, seen as best practices, was useful in order to investigate the effective feasibility of the add-ons strategy. The central part of this thesis, consists of the investigation of a new case study, an existing block of buildings in The Hague, in the Scheveningen district. Initially, a detailed analysis of the actual state was carried out, by stating the SWOT analysis for the construction. Then, the calculation of the energy demand was carried out in order to state the consequent energy measures to be applied on the existing buildings. Moreover, different scenarios based on the cost-benefit analysis were elaborated in order to check the boundaries of the intervention’s feasibility. Finally, the design process was carried out with details about the technical realization of the new construction. Concluding, this research indicates the conditions that could lead to a feasible add-ons intervention on an existing building in need of energy renovation. As an outcome of the Scheveningen case study, it is suggested to introduce the add-ons strategy as a normal practice in building energy refurbishment, regarding the benefits and perspectives that have been revealed for both owners and tenants on the basis of energy efficiency and construction costs.
1
Introduction
1.1
Motivation
Referring to the latest legislative decisions of the EU community, the definition of a very high energetic performance building refers to its energy demand that has to be very low or null, and has to be covered in a significant way by renewable energies (2010/31/EU). Today only 1.2% of Europe’s existing buildings is renovated per year, which is due to the high investments required for deep renovation and the high degree of risk combined with long payback times. One of the ways to soften this obstacles could be carried on by the design process through an architectural transformation of the building. The technological changes applied to the existing construction in order to reach a nZEB status constitute the aim of the process and consist of several interventions regarding the reduction of energy consumption, the use of renewable energies and a more efficient use of energy in order to reduce the losses. It is clear that a strategy is needed in order to make this transformation process successful. Going deep in the issue, money is required in order to make all this possible and, as the core of the discussion is the building, a plan based on the real estate dynamics could be the solution. In fact, additional volumes to the existing buildings could counterbalance the energy retrofitting costs with their economic value in the housing real estate. Not only, but the addition of
volumes, and more specifically the adhesion of them to the existing constructions thought in the sense of a bioclimatic approach, could also contribute itself to the decrease of the primary energy demand of the building.
The aim of this project is to apply this strategy to a Dutch case study, evaluating its probabilities of success and above all its economic feasibility. It will be clarified whether for private owners this method could be convenient or not and which are the factors that might improve its success.
One of the initial tasks is to elaborate the design of the new volumes that has to be compatible with the existing body in terms of architectural composition, and this will be possible if the design process will be developed following the conditions produced by the initial analysis of the existing building. What is more, another initial issue is to establish the field of action of the project, depending on the parameters and restrictions imposed by the regulation, for what concerns the refurbishment of an existing building. The research questions refer to the economic feasibility of the intervention. Supposed that the private owner wants to invest in the energy retrofitting of the building, is it actually possible to have a return of the money invested in a “short” period? For “short” it is supposed that the owner would have the economic capability to wait for the total return of the money spent and also expect a possible profit from the intervention.
1.2
Statement of the problem
Sustainability in architecture has always been seen as something abstracted and theoretical with difficult practical implementation. Frank Lloyd Wright (1939) was one of the first authors who elaborated ideas about this topic: the architectural design has to build a new balance between the built and the natural environment through the integration of the elements created by men and the natural ones present in the field. One of the main reasons why architecture has to change perspective is strictly related to the actual conditions of the energy supplies on earth. It has been evaluated that there would be enough coal to supply the energy demand for the next two centuries but for what concerns gas, it will be available for other 69 years while oil for only 43 years (Itard, 2012). It is clear that a drastic turnover into renewable resources has to be done. Architecture is one of the disciplines that has the responsibility to act in the foreground for this aim. That is due to the impact of energy consumption of the existing buildings that account for approximately 40% in the European Union. More specifically 30% of the energy of the total building stock on average is consumed by the households. Because of this, the citizens have to change their habits in the perspective of a sustainable way of living and architecture has to provide the appropriate means to success in that purpose.
The answer to this need is to implement energy efficiency measures in the housing sector. To do that economic investments are needed and they represent the crucial aspect of the process. The only way to convert this sporadic phenomenon into a widespread approach to the housing stock sector is to make it attractive in economic terms.
In particular, the thesis analyses the possibility to counterbalance the investment on the energy renovation of a building by the construction of new volumes that would be rented or sold. The main task is to evaluate whether the add-ons strategy could be a feasible approach to convert buildings into nZEB.
Which are the necessary conditions that could lead to the feasibility of the add-ons strategy on the case study, in normative, architectural, economic and technologic terms?
1.3
Methodology
The research method consists of an initial phase of understanding the framework in which the case study is set. It gives a description of the current economic and political Dutch scenarios, before moving to a focus onto the existing housing’s stock situation in the Netherlands and the past and current policies approved by the government in terms of energy efficiency measures. The study is brought forward in relation to the European background. Then it is explained in more detail in what consists the add-ons strategy for the renovation of existing buildings and some examples of this type of intervention are described in order to show the best practices in this field. The example case studies are integrated in the literature review as means to support and validate the literature research. The projects are the following:
• The Himmerland Housing Association, Departments 19 & 22 in Aalborg (Denmark) by C. F. Moller Architects. (2009-2016)
• The ‘Bois Le Pretre’ Tower Metamorphosis in Paris by Frederic Druot Architecture. (2011)
• Giesshübel pile up in Zürich by Burkhalter Sumi Architekten. (2013)
• Tower and line social housing blocks in Bologna by Giulia Fanin, Maria Sofia Pitulis, Fabrizio Ungaro (master students of Architecture and Building Engineering at the University of Bologna). (2016)
The first example is about the renovation of homes by their transformation and rooftop addition. The second example refers to the addition of terraces and winter gardens to the existing block. The third example, as the first one, regards a rooftop addition on an ancient storage building, while the last one regards a proposal for the energy renovation and design of adhesions, rooftops additions and assistant buildings for ‘70s social housing tower and line blocks. All strategies have been carried on to lead to an energy retrofitting of the constructions, made it possible, in economic terms, thanks to the counterbalancing of the investments by the decrease of the energy demand and by the creation of new volumes. The central part of the research is based on the Dutch case study, in particular on the design of volumetric additions in order to go through the add-ons method that has to be evaluated. This phase consists of several steps, beginning with the analysis of the actual state of the building, ending with the technical details of the construction process.
The design case study is used to validate the outcomes of the literature review and to be able to answer to the research question. The case study is composed by a block of neighbouring buildings in the district of Scheveningen in The Hague, owned by an architecture studio. The thesis will develop a proposal for the volumetric addition on the existing and will validate its feasibility highlighting the necessary conditions for it. The existing buildings are analysed in order to verify the current state and state the fundamentals for the following design phase. As last, the research is rounded off by answering to the initial questions that characterised the thesis. As a consequence, a critical evaluation is provided and related suggestions are elaborated.
1.3.1
Literature Review
The literature review is needed to explore the following topics:
• An overview on the actual state of the existing housing stock in Europe concerning the energy demand of dwellings and the eventually energy efficiency measures applied on them.
• An overview on the energy efficiency European policies elaborated and specifically the Dutch approach to these issues, also describing the Energiesprong approach as a developing strategy for existing social housing owned dwellings in the Netherlands.
• A description of the add-ons strategy as a possible solution in order to overtake the economic obstacles connected to the feasibility of energy renovation interventions.
• An explanation of the best practices in energy renovation of buildings and the measures adopted.
1.3.2
Design Case Study
The Design of the Case study considers the following issues:
• An examination of the economic influence of adding storeys to the existing buildings, in order to counterbalance the energy efficiency measures costs with the selling of the new dwellings.
• The identification of the parameters that play the most important role in defining the add-ons intervention for the case.
• A comparison between the several incremental design scenarios.
• The development of useful directives that could be used for owners and investors for the energy renovation of existing buildings using the add-ons strategy.
A.
Literature Review
2
Energy efficiency measures
2.1
Introduction
In 2010 the European Union has stated that, respectively by 2018 and 2020, new public and not public buildings should be nearly zero energy. The European Directive 2010/31 gives the definition for nZEB as a building with a very high energy performance, whose energy demand is very low or null and must be mainly covered by renewable energies; moreover its energy performance must involve the lowest cost during the economic life cycle estimated (art.2). This definition is addressed to new constructions, but what is about the existing buildings? In order to fulfil the energy savings directions stated by the European Union, it is necessary to intervene also on the existing housing stock, which, besides, is responsible for 30% of European CO2 gas emissions.
Following the most recent European normative concerning the reduction of CO2 emissions,
the energy savings and the increase of use of renewable energies (2030 targets), a nearly zero-energy renovation strategy needs to be applied to the existing buildings in order to participate in the European sustainability goals.
Furthermore, the first step to move forward is related to the housing stock as, between the several construction sectors, is the most responsible for fuel consumption.
2.2
Green building construction and cities' densification
The context in which the Green Building approach was born, is the First Energy Crisis (1973), during the Kippur War (Syria, Egypt, Israel), when, for the first time, there was concern about the non-renewable nature of oil. This led to spread more awareness about the instability of the energy production system and new terms, as Ecology and Energy Saving, began to be used. Later on, a second Energy Crisis was stimulated by the Iranian Revolution in 1979. Energy became the very first cause of the related economic crisis and this revealed, once more, the strong dependence of the world upon oil resources. The energy saving was the first answer to the question regarding the solution of the crisis. The most developed countries began to implement architecture discipline with sustainability measures, understanding that the design process was the very first step that could lead to an energy saving construction. This awareness did not find real concrete application, as today the majority of the buildings in need of energy retrofitting are those built in the 70s and 80s, but at least theoretically reflections were elaborated upon this issues.
Talking about the housing sector, an overview about the cities in which we live must be done. The approach that coherently should be attributed to the government of the cities need to be strictly related to the aim of the renovation of the existing buildings. As the main concern is to fix the existing constructions in order to make them environmentally compatible, the same behaviour must be followed, at a larger scale, while managing the city. As Jaime Lerner (Brazilian architect and Mayor of Curitiba) suggests, it must be applied an Urban Acupuncture that fixes the “ill” parts of the cities through circumscribed interventions in the more needy contexts. The general idea is that specific and effective renovation has always to be preferable than demolition and loss of permeable soil. Moreover, using the Life Cycle Assessment method, it is clearly revealed that renovation and interventions on the existing are always preferable than demolition and reconstruction, in terms of materials and energy savings.
2.3
The existing housing stock in Europe
Most of the existing housing stock in Europe was built after WW II with a mass production on a huge scale approach. These buildings largely satisfy the housing needs, nevertheless they are characterised by poor quality of the construction that is connected to the high energy demand of these buildings and consequently to the pollution caused by them. (Itard, 2008)
Graph 2.1 Age of dwellings in Northern Europe (source: author)
In the European Union existing buildings are responsible for 30% of the CO2 emissions and
because of their life cycle, they will represent the dominant part of the housing stock for the next 50 years. What is more, they account for around 40% of total final energy use. Because of these reasons it is important to reduce the use of energy in the buildings and increase the use of energy from renewable sources in order to reduce European Union’s dependency from fossil fuels energy imports that cause greenhouse gas emissions.
The energy renovation of the existing buildings is the key to achieve sustainability goals, not only in Europe but all over the world. Since the building sector, for what concerns new constructions, is temporarily stationary due to the crisis, the solution is to work on the existing cities and to renovate them starting from the housing sector, the most responsible for fuel consumption. In addition, the lack of permeable soil due to the over occupation of land is another issue related to the sustainability of the anthropic context in which we live, as it contributes to flooding and unbalance of the cities’ microclimate.
According to the Life Cycle Assessment method, used to evaluate the environmental impact of a product depending on its entire life, from the extraction of raw materials to the discard of them, it has been calculated that the energy and materials required for a transformation of a building are widely less than those needed for a demolition and new construction. (Graph 2.1)
Graph 2.2 Flows of materials, energy and water of consolidation, transformation and new construction (source: author)
Figure 2.1 Building in the district of Kypseli, Athens (source: google images)
The building sector, is one of the milestones of the European Union’s economy. This sector is also known for its lack of attraction towards investments, and because of this, only by increasing the size of the energy renovation market it would be possible to have more expenditures in research, innovation and modernisation of the segment.
One of the most popular suggestions in this last years, is the creation of an industrialised mechanism connected to the energy retrofitting of the buildings, in order to improve the feasibility of the interventions, making them more affordable and simple by a standardisation of the process. This would require the creation of an EU energy renovation industry that could unleash the 4th industrial revolution in Europe.
The conversion of the EU building stock from being an energy waster to being energy efficient and energy producer, would make citizens active “prosumers” (professional-consumer) and increase equality between them. This would lead to a sustainable economic recovery and ensure a healthy infrastructure for future generations.
2.4
The existing housing stock in the Netherlands
In the Netherlands the construction of residential buildings increased after the end of the WW I. For what concerns the type of external walls, the buildings constructed after 1925 were mainly made of brick cavity walls in order to improve moisture protection. Concrete elements were introduced in 1966. Moreover, from 1970 dwellings are composed by thick facades and concrete-brick construction walls. For what concerns the floors, the pre-war ones are mainly made of wood, while from 1970, concrete began to be used. Moreover, until 1970 roofs were made of beams and planking and only after, concrete tile roofs were implemented. About glass systems, the double glass was introduced in new dwellings from 1980. Before 1976, wood and sometimes steel were used for the windows’ frames, while, after 1976, PVC, aluminium or wood were implemented. (Klunder, 2005)
Figure 2.2 1967 Residential building in Scheveningen, The Hague (source: author)
2.5
European policies
In 1992, during the Rio de Janeiro’s Earth Summit, the UNFCCC (United Nations Framework Convention on Climate Change) was elaborated by 192 member states, including the EU. They met again in 1997 to sign the Kyoto Protocol, an international treaty to reduce GHG emissions. The document stated that the production of pollution elements had to be reduced at least at 8.65% in relation to the 1985 levels.
In 2002, the EU approved the first EPBD, Energy Performance of Buildings Directive, that proposed energy certifications, stimulating the Member States to apply several energy
measures. In particular, the goal was to reduce the European energy consumption of 22% before 2010 and a reduction of the CO2 production of 100 millions of tons.
The European Energy Performance of Buildings Directive (2008), specifies that when a dwelling is constructed, rented or sold, it needs a certification that states its energy performance, CO2 emissions and advices for energy performance improvements. The
calculations needed take into account different characteristics: thermal characteristics, heat and hot water systems, location and orientation, ventilation, air conditioning and indoor climate. In 2009, the EU created the Renewable Energy Directive RED, to ensure the renewables target will be met. After that, based on the data provided by EUROSTAT (the European statistics service), the share of renewables increased from 12.35% to 15.96%, respectively in 2009 and 2014.
In 2010, the EU approved another EPBD, stating that by the end of 2020, all new buildings should be nearly zero-energy, while all new public buildings should achieve this by 2018. The energy mix of the building sector is composed by: electricity (33.8%), gas (33%), oil (12%), renewables (11%) and heat (7.31%); in the last years the gross final electricity production was characterised by an increased share of renewables and this states that already renewables represent an important share of buildings’ energy consumption. (Laurent, 2013)
Later, the EU approved the Europe 2020, the ten-year growth strategy in which one of the 5 targets to achieve concerns climate change and energy sustainability. It was put into effect through the 2009 climate and energy package and the 2012 Energy Efficiency Directive (EED). It states that, within year 2020:
• Greenhouse gas emissions have to be reduced by 20% than the values of 1990,
• The use of renewable energies has to be Increased with a rate of 20%,
• Energy efficiency has to be increased with a rate of 20%.
The second meeting of the UNFCCC member parties took place in Doha, Qatar, in 2012, but unfortunately, the most involved member states, as Russian Federation and Canada, did not submit the target planned for the second commitment period, 2013-2020 (20% reduction of gas emissions).
In October 2014, the European Council signed an agreement on the climate and energy policy structure and endorsed targets for 2030, this foresees:
• A target of 40% GHG emissions reduction compared to 1990 levels,
• A target of at least a 27% share of renewables in total final energy consumption for 2030,
• A target of at least 27% energy savings of primary energy consumption compared to 2007 projections.
Actually, there are three different scenarios elaborated by the EU, the EE27 and the EE30 are related to the 2030 climate objective to reduce GHG emissions by 40% as compared to the 1990 levels, while the EE40 scenario would lead to 44% of reduction and 40% of energy saving. In order to achieve business leaders’ confidence to invest in energy renovation, it is necessary to create a stable framework that foresees a sufficient volume of buildings to be renovated every year. Because of this, the 40% energy savings target could drive the large-scale renovation projects needed to gain private investments in energy renovation. It is expected
that the building stock will lead the decarbonisation of the EU energy system and, compared to 2005 levels, GHG emissions are planned to fall by 33.8% in the residential sector and by 50.5% in non-residential buildings, considering the 27% energy savings target by 2030. (EE30 scenario). It seems that EU is on track to meet its 2020 goals in emissions’ reduction , but the 40% energy saving target seems unlikely to be met without additional measures.
In order to control the diligence of EU Member States, it was created a Regulation (No 525/2013) about a mechanism for monitoring and reporting GHG emissions. It divides the building sector in other two sub-sectors, on the one hand the households and on the other hand the commercial and institutional. For what concerns the households, they are characterised by the specific CO2 emissions, calculated as a ratio between CO2 emissions from
fossil fuel consumption and the stock of permanently occupied dwellings.
Later, in December 2015, 174 countries (Russian Federation and Canada included also with the participation of the United States) agreed to the Paris Climate Agreement in order to hold the increase in the global average temperature to below 2°C and to pursue efforts to limit temperature increase to 1.5°C. In 2016 the EC has been undertaking a review of EU legislation related to these climate and energy policies.
The possibility for the EU building stock to become energy efficient and an energy producer leading to net zero energy consumption, could enable it to play a positive and imperative role in the EU energy system. The more energy efficient the EU building stock will be, the more important the energy savings and renewables would be in the EU energy mix and as a consequence the role of buildings in the EU energy system.
In these latest years, the main concern about the energy retrofitting of the buildings was to improve the layering of the existing walls in order to reduce the energy losses during the winter period. Nevertheless, for what concerns the construction of new buildings, attention must be paid during the design process in order to avoid the overheating effect during the summer period. The issue was introduced for the first time in the 2010 EPBD (2010/31/EU).
Figure 2.3 Brief timeline of European energy policies (source: author)
2.5.1
Definition of energy renovation in EU legislation
The EED, the Directive on energy efficiency (2012/27/EU), explained the concepts of deep renovation, cost-effective deep renovation, substantial and comprehensive refurbishment, while the 2010 EPBD (2010/31/EU), introduced the concept of major renovation. The definition of Deep Renovation is described as follows in the EED:“cost-effective deep renovations which lead to a refurbishment that reduces both the delivered and the final energy consumption of a building by a significant percentage compared with the pre-renovation levels leading to a very high energy performance..” . For what concerns the definition of Substantial Refurbishment, it is defined as a “refurbishment whose cost exceeds 50% of the investment cost for a new comparable unit”. Furthermore, for what concerns the Comprehensive Refurbishment, it has to be considered “the building as a whole, including the building envelope, equipment, operation and maintenance”. For what concerns the term significant percentage, it is required an improvement of at least 75% after the building has been renovated.
In the EPBD (Energy Performance of Buildings Directive, 2002), a major renovation is defined as a renovation of a part of the building that will achieve the same energy performance targets as new buildings:
• The total cost of the renovation relating to the building envelope or the technical building systems is higher than 25% of the value of the building, excluding the value of the land upon which the building is situated; or
• More than 25% of the surface of the building envelope undergoes renovation.
Later, it has been stated that, according to guidelines published by the European Commission in 2014, there are three types of energy renovations: the implementation of single measures, the combination of single measures (standard renovation) and the deep or major energy renovation.
2.6
The Dutch policies
2.6.1
Introduction
The concept that environmental impact of the buildings has to be quantified and calculated, finds its roots in a manner of thinking related to the ‘Factor 20’. This was a theory elaborated by Commoner (1971) and later completed by Ehrlich and Ehrlich (1990). The former thought that the global environmental impact depends on the population size, the average prosperity per person and the environmental impact per unit of prosperity. The latter put this statements in a formula:
𝐼𝐼𝐼𝐼=𝑃𝑃𝑃𝑃×𝑃𝑃𝑃𝑃×𝐼𝐼𝐼𝐼 Where:
It = global environmental impact Po = population size
Pr = average prosperity per person
Ip = environmental impact per unit of prosperity
So if, for example, a halving of the global environmental impact is required for the period from 1990 to 2040, a doubling of the population is considered and average prosperity 5 times higher than in 1990. Consequently, it is needed to reduce the environmental impact per unit of prosperity by a factor of 20. This is equal to a reduction of the environmental impact by 95%. This statement is helpful in order to understand the importance of thinking in factors and look for quantitative information, rather than using a more intuitive approach without exact results. This is a well-known slogan in Dutch Science and Policy in terms of sustainability for the built environment.
2.6.2
Energy labels
In 1995 the Netherlands created a list of energy labels for houses, described by the Energy Performance Advice (EPA), that were later on substituted by the 2006 regulation.
In 2008 the Netherlands put into effect the EU Energy Performance of Building Directive (EPBD) that established minimum energy performance requirements for new and existing buildings, assured the certification of building performance and required the regular inspection of boilers and air-conditioning systems in buildings. For what concerned the new buildings it included the aims of achieving a Nearly Zero Energy Buildings standard for 2020. In order to put into effect this directive, earlier in 2006, the Dutch government published a Decree (BEG) and a Regulation (REG) on the energy performance of buildings followed up by the definition of the calculation for the energy performance of residential buildings ’ISSO82‘. Further, a
definition for large-scale renovations, related to the nZEB, is intended to be explained in the Building Decree Regulation. The Dutch Standardisation Institute and the Dutch Building Services Knowledge Centre describe the calculation for the Energy Index EI as follows:
𝐸𝐸𝐼𝐼= 𝑄𝑄𝑡𝑡𝑜𝑜𝑡𝑡𝑜𝑜𝑜𝑜
�155 ×𝐴𝐴𝑓𝑓𝑜𝑜𝑜𝑜𝑜𝑜𝑓𝑓+ 106 ×𝐴𝐴𝑜𝑜𝑜𝑜𝑙𝑙𝑙𝑙+ 9560�
This index is a value ranging from 0 (extremely good performance) to 4 (extremely bad performance). These values are categorised in order to make the owners aware of the thermal quality of their dwellings. (Table 2.1)
Table 2.1 Different Energy labels and Indexes depending on different Primary Energy Consumption, valid until 2014 (source: author)
Qtotal refers to the theoretical yearly primary energy use of a dwelling, while the corrections
in the denominator include: Afloor that refers to the total heated floor area of the dwelling and
Aloss that refers to the areas that are not heated in the dwelling.
Since the 2015 the method to calculate the EI changed and is now based on a point system that allocate a score of points to each dwelling that correspond to an energy label after the registration to the Netherlands Enterprise Agency(RVO).
In a study on the effect of the Dutch Energy Performance Coefficient (EPC) values about new dwellings, it has been found that the energy demand is influenced primarily by the building envelope and the type of dwelling but also occupant habits and behaviour significantly affect energy use (4.2% of the variation in energy use for heating).
The Netherlands are deeply involved in trying to achieve energy retrofitting goals, and because of that, Dutch legislation allows landlords to include retrofitting costs in the rents. Furthermore, the Netherlands, are one the countries that foresee penalties in case of non compliances with energy performance requirements. What is more, regional and local regulations establish a minimum threshold for the mandatory communication of changes in energy performance in the buildings. Finally, the Dutch government has also provided grants for demonstration projects for nearly zero-energy buildings.
In September 2013 the Dutch government concluded the Energy Agreement (Energieakkoord) for sustainable growth. The goal is to bring the yearly energy efficiency improvement until 2020 at a level of 1.5 % per year. Regarding dwellings, 400 million euro of subsidies have been fixed to stimulate investments for savings with social housing corporations.
Moreover, it has been seen that energy efficient office buildings are characterised by higher rents then less efficient ones. This seems to be a positive signal, that something in the real estate market is changing and, maybe, the conditions for an energy redevelopment market are slowly being built on.
2.6.3
Energiesprong
Energiesprong is a Dutch program that has developed energy renovation kits for the social housing stock built between 1950 and 1970 in the Netherlands. The project involves several actors, Energiesprong plays the role of an Energy Renovation Facilitator, as it succeeded in bringing together different stakeholders as the Social Housing Associations with private housing and commercial property sectors. The Social Housing Associations are widely involved in this process as they take the financial risk because of the bank’s loan, they invest in the energy refurbishment of the houses and they receive the rent and energy bills paid by the tenants until the loan is repaid. Moreover, there is a private company that has the assignment to rate the projects submitted by energy renovation companies as these latter have to guarantee: a 3-day delivery timetable, aesthetic attractiveness of the project and a 30-years insurance-backed energy performance. For what concerns the intervention, the changes interest the roof, the floor, the heating plant, the façade and the walls’ insulation. Till now it has been possible to operate on at most 3-4 floors buildings. The process is characterised by the use of prefabricated components and the heating plant is always put outside the house in order to gain internal space and avoid annoying noises. The principal aim is to try to sell to people something they have never been interested to, in other terms, try to create a business model as there is still very little demand for nZEBs. However, for private owners it has been stated that other 3 years, at least, are needed in order to set up the conditions for them to invest in such interventions. What is more, till now this approach has been operated only on Dutch typical homes, but in order to apply it on other realities it will be necessary to find different solutions and adapt the market transition model. Finally, this method does not foresee a free field of action for the architect, as it is basically based on prefabrication and industrialisation models, that for their nature do not take into account a free architectural composition approach. (Figure 2.3)
Figure 2.4 Energiesprong’s business model (source: author)
Figure 2.5 Oud-Vossemeer, example of Energiesprong’s work (source: www.energiesprong.nl)
2.6.4
The non-profit housing sector
The European Social Housing Organisations (SHO) are dealing with the economic crisis that has affected both their finances and the finances of their tenants. This represents an obstacle to the housing renovation projects and application of energy efficiency measures. Currently, SHOS own around 9.4% of the total housing stock in Europe and only in Austria and
In the Netherlands non-profit housing associations own the 31% of the total housing market, that is the highest percentage in Europe and they are considered autonomous and self-financing organisations since 1995 because they do not receive any subsidies from the national government. Since the maintenance of the dwellings is one of their main concerns, the sustainability and energy savings issues play a role in their choices. Moreover the non-profit housing sector has a collective nature and central way of policy and decision making that could make it an example in terms of energy efficiency goals. This approach has been encouraged also by the increase of the European awareness in this field that has led to the creation of the Energy Saving Covenant for the Rental Sector in 2012, which main purpose is to achieve an average EI of 1.25 by the end of 2020 (label B) for the Dutch social housing sector. This Covenant was signed by Aedes (Dutch association for housing organisations), Woonbond (Dutch tenants’ union), Vastgoed Belang (Dutch association of real estate investors) and the national government, andit leads to the introduction of the energy labels as one of the parameters of the regulated rents in social housing.Part of the Energy Covenant was the total housing costs guarantee that ensured tenants that rent increases, needed for the investments in energy efficiency measures, would be balanced by decreased housing costs due to the energy savings.
Unfortunately it has been found that the the pace of change is too slow to reach the 2020 energy efficiency purpose. Because of this, in 2008, Aedes started a monitoring system, called SHAERE, that is the official tool for monitoring the progress in the field of energy saving measures for the social housing sector. Thanks to this implement it is now clear that, the more the energy efficient solutions applied, the more the impact is on the EI. In addition it has been noticed that there is a tendency for conventional rather than innovative maintenance measures; furthermore when energy improvements do take place, usually only one or two measures are carried on per dwelling. Finally it is revealed that when municipal support is offered, it results in more concrete energy renovation plans. (Filippidou, 2016)
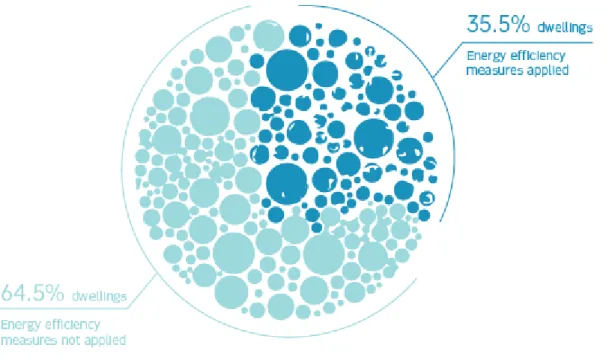
More specifically, it has been conducted a survey about the actual measures applied between 2010 and 2013. It has been found out that the tendency was to change the conventional boilers (𝜂𝜂< 0.8) into condensing high efficiency ones. Generally the change into more sustainable plants as heat pumps was not so common and the substitution of the heating plants, within the energy efficiency measures applied, was one of the most applied with a total percentage of 17.6%. For what concerns the domestic hot water system, a total percentage of 15.5% was the change from tankless gas water heaters into high efficiency combi-boilers to a µCHP system. It has been also verified that there was a change from heat pumps into condensing high efficiency boilers, probably because of the slowness in generating hot water. Going forward, the change of the ventilation system had a percentage of 8.7%. One of the most popular energy saving measures was the change of the type of windows with a percentage of 10%, and it was revealed that the change into more ambitious energy efficiency measures, such as a triple insulation glass, was a rarity. In general, this type of intervention was more common in the non-profit housing sector due to the fact that old uninsulated windows were being replaced on a national scale. About the change for wall insulation, it has been calculated as a 7.06% of the total measures, underlining that the majority of the non-profit building stock had been built before the 1970s without wall insulation. Finally, the change in roof and floor
insulation were respectively 6.64% and 9.42% of the total modifications. In conclusion, analysing the 2010-2013 range of years, it has been noticed that 64.5% of dwellings had no
change, while for the rest 35.5%, the majority of them had one measure performed and only the 3% had more than three measures implemented. (Filippidou, 2016) (Figure 2.4 and 2.5)
Figure 2.6 Percentage of dwellings with energy efficiency measures applied and not (source: author)
Figure 2.7 Percentages of energy effciency measures applied (source: author)
2.6.5
The private sector
Within the private housing sector, a division must be made between owner-occupied and private rented. In the first case the investor and the one who gains from the investment are the same figure, and because of this, it is common a lack of financial means to invest. While for the private rented sector, even if the one who profits from the investment is the occupant and not the owner, this may be solved by increasing the rent in order to repay the owner’s investment, whenever this is possible. Moreover, owner-occupiers’ barrier to the application of energy efficiency measures is the lack of knowledge and information, as these questions are not significant issues for them.
The number of homeowners that possess an EPC when selling a house is very low. More specifically, there are 2.1 million EPCs logged, but only 10% of these are for private dwellings,
while the remaining are for rented social housing. In fact, the theoretical calculated energy consumption obtained with the EPC does not represent the actual consumption of a dwelling and one of the causes is that it does not take into account the potential variations in occupants’ behaviours.
3
The energy demand of the heating system
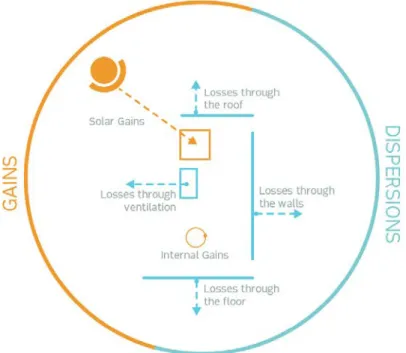
In order to calculate the Thermal Balance of a building it is important to consider both Dispersions and Gains. The former take place through the shell and the openings (windows, doors), while the latter are referred to Solar or Internal Gains:
𝐷𝐷𝐷𝐷𝐷𝐷𝐼𝐼𝐷𝐷𝑃𝑃𝐷𝐷𝐷𝐷𝑃𝑃𝐷𝐷𝐷𝐷 − 𝐺𝐺𝐺𝐺𝐷𝐷𝐷𝐷𝐷𝐷=𝑇𝑇𝑃𝑃𝐼𝐼𝐺𝐺𝑇𝑇𝑃𝑃𝑃𝑃𝐷𝐷𝑃𝑃𝐺𝐺𝑃𝑃𝑃𝑃𝐸𝐸𝐷𝐷𝐷𝐷𝑃𝑃𝐸𝐸𝑃𝑃𝐷𝐷𝐷𝐷𝑃𝑃𝐺𝐺𝐷𝐷𝐷𝐷
Generally the Energy Index EI of a building is calculated as a ratio between the Energy Demand and the Useful Computation Surface:
𝐸𝐸𝐼𝐼𝐸𝐸𝐷𝐷𝐷𝐷𝑃𝑃𝐸𝐸𝑃𝑃𝐼𝐼𝐷𝐷𝐷𝐷𝐷𝐷𝐼𝐼 =𝑄𝑄𝐴𝐴𝑇𝑇𝑃𝑃𝐼𝐼𝐺𝐺𝑇𝑇𝑈𝑈𝐷𝐷𝐷𝐷𝑈𝑈𝑈𝑈𝑇𝑇𝑃𝑃𝑃𝑃𝐷𝐷𝑃𝑃𝐺𝐺𝑃𝑃𝑃𝑃𝐶𝐶𝑃𝑃𝑃𝑃𝐼𝐼𝑈𝑈𝐼𝐼𝐺𝐺𝐼𝐼𝐷𝐷𝑃𝑃𝐷𝐷𝐸𝐸𝐷𝐷𝐷𝐷𝑃𝑃𝐸𝐸𝑃𝑃𝑆𝑆𝑈𝑈𝑃𝑃𝑈𝑈𝐺𝐺𝑆𝑆𝐷𝐷𝐷𝐷𝐷𝐷𝑃𝑃𝐺𝐺𝐷𝐷𝐷𝐷
It is well verified that there is a wide gap between normative theoretical calculations made following the Energy Performance Certificate (EPC) approach and real energy consumption evaluated on the base of what the tenant pays at the end of the month. Not only, also the energy savings evaluated, after the energy efficiency measures to be applied, are obtained with the use of a theoretical approach that doesn’t always reflect the real expectations. For what concerns the Netherlands, it has been elaborated a research in order to quantify this gap and understand the reasons of it. Based on The WoON 2006 survey, conducted by the Dutch Ministry of Housing, Spatial Planning and the Environment, containing information for more than 4,700 Dutch households, the study has compared the real energy consumption of the dwellings, based on energy bill data, with the theoretical one and has used the Heating Factor as score. It is the ratio between the real energy demand and the calculated one. A Heating Factor of 1 means that the theoretical energy demand is equal to the real one, while a Heating Factor higher than 1 means that the real consumption is higher than expected, and the opposite situation happens for a Heating Factor lower than 1. The results show that there is a consistent over prediction in space heating energy use and in many cases this is due to the fact that EPC refers to well heated properties, which several are not. What is more, the lower the energy efficiency of the housing is, the higher the overestimation of the consumption is. This over estimation is also known as the “prebound effect”. There are some possible causes to this wrong evaluation: the simplicity of the models, the uncertainty in technical and climatic model data inputs, the uncertainty in the measurement of domestic energy consumption and behavioural issues. Moreover, there is also another effect due to the uncertainty of this method, that is the so called “rebound effect”, related to the overestimation of energy savings after the energy efficiency measures to be applied. Generally this is caused by a change of tenants’ behaviour of increasing the level of their thermal comfort after retrofitting.
In order to quantify the gap between the predicted energy savings and the real ones, the so called “intensity curves” can be used, as they relate the Theoretical Heating Cost to Intensity of Use, since it has been discovered that the former influences the latter and more specifically, the lower the theoretical cost, the higher the intensity of use by the households. (Figure 3.1)
Figure 3.1 Energy Gains and Dispersions scheme for a house (source: author)
4
Add-ons as a strategy
4.1
Introduction
A strategy needs to be elaborated in order to let the energy refurbishment of buildings become a common practice all over Europe. The add-ons option gives the possibility to overcome the economic obstacle represented by the lack of interest in investing on dwellings’ energy retrofitting. What have to be stated are the conditions that could effectively allow the feasibility of these interventions and, although each building has its own characteristics and needs, only by experimenting this process it could be stated whether this approach could be successful or not.
4.2
The strategy
As the main obstacle to energy redevelopment interventions is the economic factor, the first step to be done in order to prepare the field of action for the investment is towards the feasibility of it. Why private or public owners should spend money to apply energy saving measures on their properties? The actual environmental awareness is an important issue but certainly is not regarded as a fruitful moneybox to put savings yet. This is the main issue. The energy renovation intervention needs to be matched with something that could, at the same time, make it possible and attractive. What is more, as the context is the real estate market, only economic actions made on the properties could satisfy the requests. As a consequence, the answer is easy to be obtained: new floor area means possibility to sell. Selling new properties implicates gaining money that could be partly invested in energy saving measures on the existing constructions. More specifically, this theory is put into effect by the addition of new volumes to the existing buildings; these volumes have a high economic value as they are nZEB, satisfying the latest regulations on sustainable constructions. Sometimes the modifications on the existing are so considerable that a new detached building is needed in
order to repay the investment, the Assistant Building, and if possible, making it the renewable energy distributor for the surrounding existing buildings.
4.3
ABRACADABRA Project
ABRACADABRA is the acronym of a title that explains the project’s strategy:
Assistant Buildings’ addition to Retrofit, Adopt, Cure And Develop the Actual Buildings up to zeRo energy, Activating a market for deep renovation.
It has received funds from the European Union’s Horizon 2020 Research and Innovation program. This latter has nearly €80 billion funding available over 7 years (2014-2020) and its aim is to stimulate discoveries and ideas to be inserted in the market.
ABRACADABRA is based on the assumption that transformations and adaptions on the existing buildings must be accompanied by the creation of new useful floor areas in order to counterbalance the economic investments for energy saving measures. The goal is to state new tools, concerning the market, the policies and the social context, in order to make this approach feasible. The objective is to create a concrete real estate market characterized by the Nearly Zero Energy Buildings target.
As a consequence, ABRA focuses on demonstrating to stakeholders and financial investors the attractiveness of a new renovation method also based on AdoRe, that is one or more Assistant Building unit(s), like aside or façade addictions, rooftop extensions or even a new building construction – that adopts the existing buildings (the Assisted Buildings).
5
Examples
5.1
Introduction
In this chapter, three already completed add-ons examples are presented and analysed. The sources of information were, not only the websites of the architects’ studios, but also their presentations in occasion of the 24th of June ABRACADABRA Kick-off meeting that took place
in Bologna in 2016. In addition, a proposal project by three students of the University of Bologna is presented as an example of add-ons on Italian social housing buildings. The goal of this chapter is to evaluate some of the best practices in the field of energy refurbishment of dwellings in order to show the feasibility of this practice and highlight the conditions in which the building processes occurred.
5.2
The Himmerland Housing Association, Departments 19 & 22
The Himmerland Housing Association owns the 1977 prefabricated dwellings estate composed by 370 homes. These have been converted and renovated into a sustainable garden city complex by the architects’ studio between 2009 and 2016. Light has been added to the existing by the construction of large windows, French balconies and bay windows. Some houses have been combined into larger flats, while others are being expanded with rooftop additions of open spaces combined with full-height glazing. The new cladding is a timber façade which, as well as the rooftop flats, are designed as prefabricated units hosted in place. As a result, the constructions now meet the strict requirements of the Danish low-energy class 2020. The departments 19 & 22 were typical examples of public housing dating from 1970s. The unwelcoming appearance of the small windows and monotonous and dilapidated concrete facades also showed heat loss in critical areas. Thanks to conversions and extensions, new housing types have been introduced that were not previously present among
the flats in these two sections of the housing association in order to bring a wider diversity of residents. The project is based on a sustainability strategy applied with low maintenance costs and all energy savings achieved only by means of passive measures. Sustainable urban drainage systems and permeable surfaces were created, besides a wetland with rain beds to handle precipitation and collect rainwater.
Figure 5.1 Sustainable precautions and pictures of the construction phases (source graphics: author, source pictures: www.cfmoller.com)
5.3
The ‘Bois Le Prêtre’ tower metamorphosis
The 100 residences of the building situated in 5 Boulevard du Bois Le Prêtre (Paris 17ème) have been radically transformed in their conditions of comfort and habitability. The tower was built in 1962 by the architect Raymond Lopez, it is 50 meters high with 16 levels serving each one 4 or 8 residences. With the addition of winter-gardens and balconies the surface has been carried from 8,900 sqm to 12,460 sqm. Winter-gardens are closed balconies surrounded by glass in order to receive sunlight during the day. Mainly by the addition of the winter-gardens, the energy consumption has been decreased of at least 50%, and thanks to this, the rental offer has remained the same. In fact, even if the energy demand has been decreased, the rents have been fixed at the same original values in order to finance the building process. More specifically, the existing structures have been preserved and by opening the bays, the prefabricated balconies of three meters depth have been juxtaposed with the existing frontages. The surface of winter-gardens is about 25 sqm for each 42 sqm of existing housing.
Figure 5.2 Sustainable precautions and pictures of the construction phases (source graphics: author, source pictures: www.druot.net)
5.4
The Giesshübel pile up
The Giesshübel pile up in Zürich, or the urban densification in wood as the architects call it, consists of a rooftop addition of four floors of apartments on an ancient storage building and the renovation of the existing complex hosting the SZU Headquarters at the ground floor. Different timber prefabricated walls have been used with different dimensions of 5x2.7 m, 4.7x3.1 m, 5.1x3.1 m and 8.7x2.9 m. In order to set up the prefabricated floors and walls, the concrete lift and stairs structures have been continued in height over the existing ones.
Figure 5.3 Sustainable precautions, pictures, section and floor plan (source graphics: author, source pictures: www.burkhalter-sumi.ch)
5.5
Tower and line social housing blocks in Bologna
The intervention area is located in Bologna, in a suburban site not far from the city center and well connected through the main mobility infrastructures. More specifically, it consists of three tower blocks and a line block along Via Torino, built for social housing in the ‘70s. About these topics a detailed executive project on each building has been developed. The energy refurbishment of existing buildings has begun with a check on buildings’ thermal behavior in terms of thermal transmittance and renewable energy systems following the recent dispositions about buildings’ energy certifications. Moreover, the above mentioned check has been accompanied, not only by volumetric additions on them, but also by the creation of new assistant buildings in order to provide a profitable investment for the intervention. The cost-benefit analysis has represented the essential stage of this process. In fact, in order to achieve an energy renovation an economic investment is needed. Not only the annual energy consumption of the buildings has been converted into an annual saving, but also the market value of them has increased thanks to the overall improvements. For a total useful floor area of 25.500 sqm, the remaining thermal consumption after renovation has been covered by the installation of photovoltaic panels. Different progressive incremental scenarios have been imagined in order to widen the range of action for the intervention. In order to obtain a total balance between costs and benefits, or an immediate return time, it has been required to build around 10.504 sqm of new useful floor area. This intervention provides a tower adhesion combined with a line block adhesion of new housing units and the ground floor saturation of the line block with retail units, the attic saturation of the line block and the cellars saturation in the tower blocks. As a result it gives a small immediate profit of
925.000 euros. In order to obtain a significant profit opportunity 11.664 sqm had to be built for a profit of 2.898.000 euros.
For what concerned the tower block’s surfaces there are two types of wall cross sections: the concrete structural part is layered with perforated bricks in the inner part, while the curtain wall was composed by layers of polystyrene, perforated brick and plaster. Furthermore, the floor’s cross section is composed by lean concrete subfloor, cork, concrete and plaster. This configuration gives a primary energy demand of 237 kwh/sqm. With the intervention a layer of wood fiber is added to each component to provide insulation and decrease the energy demand of the building. As a result, the primary energy demand reaches the level of 28 kwh/sqm. The line block has a similar configuration to the tower block with an energy demand of 286 kwh/sqm, and after the retrofitting it reaches the level of 21 kwh/sqm. In both cases it has been assumed that the windows’ fixtures are replaced with a double glass system.
A prefabricated technology, realized in factory and just assembled on site, has been thought for the new construction process. In order to maximize the transportable dimensions, two units having the same sizes as the shipping containers (20’- 40’) have been used. These could be composed together in a plenty of solutions (on one or two floors) and, most of all, able to satisfy the needs of many types of possible users: families, couples or singles. The boxes are made of a steel frame of box sections 20x10 reinforced with angle brackets 80x8. The floor is layered with a floating floor, a wooden planking, a filling of mineral wool and an insulation panel of wood fiber covered by an outer finish. The primary energy index of a housing unit is 18 kwh/sqm.
B.
Scheveningen Case Study
6
Analysis of the actual state of the Case Study
6.1
Environmental and physical climatic criticalities
6.1.1
Location
The case study is located near to the port of The Hague and are situated in the district of Scheveningen. The Hague is located in the west part of The Netherlands in South Holland and is part of the Randstad, with Rotterdam, Dordrecht, Leiden and Delft. The construction is composed by some buildings being part of a block surrounded by three roads: Zeesluisweg Road, Westduinweg Road and Schokkerweg Road. The total area of interest of the case study is 2,229 sqm and the constructions being part of it consist of: five neighbouring buildings (block A) and one other detached (block B), all facing a road called Zeesluisweg, and another complex of buildings situated in the inner part of the block, behind those facing the road. The inner buildings will not be evaluated during the SWOT analysis because, following the design decisions, they will be demolished and only the cost for this intervention will be taken into account during the cost- benefit analysis. The buildings are owned by an architecture studio, the Urban Climate Architects. The entire block is directed following approximately an ENE-WSW orientation.
Scheveningen is a seaside resort with a long and sandy beach with a pier and a lighthouse near to The Hague’s port that was dug starting from the beginning of 20th century and
nowadays it can host medium tonnage merchant ships. Moreover, the closest park is the south east located Doornpark, while the bigger Scheveningse Bosjes (Scheveningse Wood) is located in the east part of the district.
The buildings not only host dwellings but also a bar and a kindergarten at the ground floor.