PeerRush: Mining for Unwanted P2P Traffic
Babak Rahbarinia1, Roberto Perdisci1 Andrea Lanzi2, and Kang Li1 1
Dept. of Computer Science, University of Georgia, Athens, GA 30602, USA,
babak,perdisci,kangli@cs.uga.edu 2
EURECOM Institute, Sophia Antipolis, France,
lanzi@eurecom.fr
Abstract. In this paper we present PeerRush, a novel system for the identification ofunwanted P2P traffic. Unlike most previous work, Peer-Rush goes beyond P2P traffic detection, and can accuratelycategorize the detected P2P traffic and attribute it to specific P2P applications, including malicious applications such as P2Pbotnets. PeerRush achieves these results without the need of deep packet inspection, and can accu-rately identify applications that use encrypted P2P traffic.
We implemented a prototype version of PeerRush and performed an extensive evaluation of the system over a variety of P2P traffic datasets. Our results show that we can detect all the considered types of P2P traffic with up to 99.5% true positives and 0.1% false positives. Furthermore, PeerRush can attribute the P2P traffic to a specific P2P application with a misclassification rate of 0.68% or less.
Keywords: P2P, Traffic Classification, Botnets
1
Introduction
Peer-to-peer (P2P) traffic represents a significant portion of today’s global In-ternet traffic [13]. Therefore, it is important for network administrators to be able to identify and categorize P2P traffic crossing their network boundaries, so that appropriate fine-grained network management and security policies can be implemented. In addition, the ability to categorize P2P traffic can help to increase the accuracy of network-based intrusion detection systems [6].
While there exists a vast body of work dedicated to P2P traffic detection [4], a large portion of previous work focuses on signatubased approaches that re-quire deep packet inspection (DPI), or on port-number-based identification [17, 7]. Because modern P2P applications avoid using fixed port numbers and im-plement encryption to prevent DPI-based detection [13], more recent work has addressed the problem of identifying P2P traffic based on statistical traffic anal-ysis [10, 11]. However, very few of these studies address the problem of P2P traffic categorization [9], and they are limited to studying only few types of non-encrypted P2P communications. Also, a number of previous studies have focused on detecting P2P botnets [5, 22, 15, 2, 23], but with little or no attention to ac-curately distinguishing between different types of P2P botnet families based on their P2P traffic patterns.
In this paper, we propose a novel P2P traffic categorization system called PeerRush. Our system is based on a generic classification approach that leverages
high-level statistical traffic features, and is able to accurately detect and catego-rize the traffic generated by a variety of P2P applications, including common file-sharing applications such as µTorrent, eMule, etc., P2P-based communication applications such as Skype, and P2P-botnets such as Storm [8], Waledac [16], and a new variant of Zeus [12] that uses encrypted P2P traffic. We would like to emphasize that, unlike previous work on P2P-botnet detection, PeerRush focuses on accurately detecting and categorizing different types of
legiti-mate and malicious P2P traffic, with the goal of identifyingunwanted P2P
applications within the monitored network. Depending on the network’s traf-fic management and security policies, the unwanted applications may include P2P-botnets as well as certain specific legitimate P2P applications (e.g. some file-sharing applications). Moreover, unlike most previous work on P2P-botnet detection,PeerRush can reveal if a host is compromised with a specific
P2P botnet typeamong a set of previously observed and modeled botnet
fam-ilies. To the best of our knowledge, no previous study has proposed a generic classification approach to accurately detect and categorize network traffic related to both legitimate and malicious P2P applications, including popular applica-tions that use encrypted P2P traffic, and different types of P2P-botnet traffic (encrypted and non-encrypted).
Figure 1 provides an overview of PeerRush, which we discuss in detail in Section 2. The first step involves the identifications of P2P hosts within the monitored network. Then, the P2P traffic categorization module analyzes the network traffic generated by these hosts, and attempts to attribute it to a given P2P application by matching anapplication profilepreviously learned from sam-ples of traffic generated by known P2P applications. If the P2P traffic does not match any of the available profiles, the traffic is classified as belonging to an “unknown” P2P application (e.g., this may represent a new P2P application re-lease or a previously unknown P2P botnet), and should be further analyzed by the network administrator. On the other hand, if the P2P traffic matches more than one profile, an auxiliarydisambiguation module is used to “break the tie”, and the traffic is labeled as belonging to the closest P2P application profile.
The application profiles can model the traffic characteristics of legitimate P2P applications as well as different P2P-botnets. It is common for security researchers to run botnet samples in a controlled environment to study their system and network activities [3]. The traffic collected during this process can then be used as a sample for training a specific P2P-botnet application profile, which can be plugged into our P2P traffic categorization module. In summary this paper makes the following contributions:
– We present PeerRush, a system forP2P traffic categorization that en-ables the accurate identification of unwanted P2P traffic, including
en-crypted P2P traffic and different types of P2P botnet traffic. To
achieve these goals, we engineer a set of novel statistical features and classi-fication approaches that provide both accuracy and robustness to noise.
– We collected a variety of P2P traffic datasets comprising of P2P traffic gener-ated by five different legitimate P2P applications used in different
configura-P2P traffic samples P2P host detection Non-P2P samples Live network traffic P2P traffic categorization Auxiliary P2P traffic disambiguation training training training application profile 1 application profile 2 application profile 3 application profile N P2P traffic categorization reports
Fig. 1.PeerRush system overview.
tions, and three different P2P botnets including a P2P botnet that employs encrypted P2P traffic. We are making these datasetspublicly available.
– We performed an extensive evaluation of PeerRush’s classification accuracy and noise resistance. Our results show that we can detect all the considered types of P2P traffic with up to 99.5% true positives and 0.1% false positives. Furthermore, PeerRush can correctly categorize the P2P traffic of a specific P2P application with a misclassification rate of 0.68% or less.
2
System Overview
PeerRush’s main goal is to enable the discovery of unwanted P2P traffic in a monitored computer network. Because the exact definition of what traffic is unwanted depends on the management and security policies of each network, we take a generic P2P traffic categorization approach, and leave the final decision on what traffic is in violation of the policies to the network administrator.
To achieve accurate P2P traffic categorization, PeerRush implements a two-stage classification system that consists of a P2P host detection module, and a P2P traffic categorization module, as shown in Figure 1. PeerRush partitions the stream of live network traffic into time windows of constant size W (e.g.,
W = 10 minutes). At the end of each time window, PeerRush extracts a num-ber of statistical features from the observed network traffic, and translates the traffic generated by each host H in the network into a separate feature vector
FH (see Section 2.1 for details). Each feature vector FH can then be fed to a
previously trained statistical classifier that specializes in detecting whether H
may be running a P2P application, as indicated by its traffic features within the considered time window. Splitting the traffic analysis in time windows allows to generate periodic reports and leads to more accurate results by aggregating outputs obtained in consecutive time windows (see Section 3.3).
The classifier used in the P2P host detection is trained using samples of network traffic generated by hosts that are known to be running a variety of P2P applications, as well as samples of traffic from hosts that are believed not to be running any known P2P application (see Section 3.1). Once a hostH is classified as a P2P host within a given time window W by the first module, its current network traffic (i.e., the traffic collected during the current analysis time windowW) is sent to theP2P traffic categorization module. This module
consists of a number of one-class classifiers [20], referred to as “application profiles” in Figure 1, whereby each classifier specializes in detecting whetherH
may be running a specific P2P application or not. Each one-class classifier is trained using only previously collected traffic samples related to a known P2P application. For example, we train a one-class classifier to detect Skype traffic, one for eMule, one for the P2P-botnet Storm, and etc. This allows us to build a new application profile independently from previously learned traffic models. Therefore, we can train and deploy a different optimal classifier configuration for each target P2P application and analysis time windowW.
Given the traffic fromH, we first translate it into a vector of categorization features, or traffic profile, PH (notice that these features are different from the
detection features FH used in the previous module). Then, we feedPH to each
of the available one-class classifiers, and each classifier outputs a score that indicates how close the profilePH is to the application profile that the classifier
is trained to recognize. For example, if the Skype one-class classifier outputs a high score, this means that PH closely resembles the P2P traffic generated by
Skype. If none of the one-class classifiers outputs a high enough score for PH,
PeerRush cannot attribute the P2P traffic ofHto a known P2P application, and the P2P traffic profilePH is labeled as “unknown”. This decision may be due to
different reasons. For example, the detected P2P host may be running a new P2P application for which no traffic sample was available during the training of the application profiles, or may be infected with a previously unknown P2P-botnet. Because of the nature of statistical classifiers, while a hostH is running a single P2P application more than one classifier may declare that PH is close
to their application profile. In other words, it is possible that the P2P traffic categorizationmodule may conclude thatHis running either Skype or eMule, for example. In these cases, to try to break the tie PeerRush sends the profilePHto a
disambiguation module, which consists of a multi-class classifier that specializes in deciding what application profile is actually the closest to an input profile
PH. Essentially, the output of the disambiguation module can be used by the
network administrator in combination with the output of the single application profiles that “matched” the traffic to help in further investigating and deciding if the host is in violation of the policies.
In the following, we detail the internals of the P2P traffic detection and categorization modules. It is worth noting that while some of the ideas we use for the detection module are borrowed from previous work on P2P traffic de-tection (e.g., [23]) and are blended into our own P2P host dede-tection approach,
the design and evaluation of the P2P traffic categorization component include many novel P2P traffic categorization features and traffic
clas-sification approaches, which constitute our main contributions.
2.1 P2P Host Detection
Due to the nature of P2P networks, the traffic generated by hosts engaged in P2P communications shows distinct characteristics, which can be harnessed for detection purposes. For example, peer churn is an always-present attribute of P2P networks [18], causing P2P hosts to generate a noticeably high number of
failed connections. Also, P2P applications typically discover and contact the IP address of other peers without leveraging DNS queries [21]. Furthermore, the peer IPs are usually scattered across many different networks. This makes P2P traffic noticeably different from most other types of Internet traffic (e.g, web browsing traffic). To capture the characteristics of P2P traffic and enable P2P host detection, PeerRush measures a number of statistical features extracted from atraffic time window. First, given the traffic observed during a time window of length W (e.g., 10 minutes), the network packets are aggregated into flows, where each flow is identified by a 5-tuple (protocol, srcip, srcport, dstip,
dstport). Then, to extract the features related to a hostH, we consider all flows
whose srcip is equal to the IP address of H, and compute a vector FH that
includes the following features:
Failed Connections: we measure the number of failed TCP and (virtual) UDP
connections. Specifically, we consider asfailed all TCP or UDP flows for which we observed an outgoing packet but no response, and all TCP flows that had a reset packet. We use two versions of this feature: (1) the number of failed connections as described above, and (2) the number of failed connections per host, where the failed connections to a same destination host are counted as one.
Non-DNS Connections: we consider the flows for which the destination IP
address dstip was not resolved from a previous DNS query, and measure two features: (1) the number of non-DNS connections as described above, and (2) non-DNS connections per host, in which all flows to a same destination host are counted as one.
Destination Diversity: given all thedstip related to non-DNS connections,
for eachdstipwe compute its/16IP prefix, and then compute the ratio between the number of distinct/16prefixes in which the differentdstipsreside, divided by the total number of distinctdstips. This gives us an approximate indication of thediversity of thedstipscontacted by a hostH. We consider/16IP prefixes because they provide a good approximation of network boundaries. In other words, it is likely that two IP addresses with different /16IP prefixes actually reside in different networks owned by different organizations. We compute the destination diversity features for successful, unsuccessful, and all connections.
These three groups of features are designed to accurately pinpoint P2P hosts, since they capture the behavioral patterns of traffic generated by P2P applica-tions. Therefore, the expectation is that the value of these features are higher for P2P hosts in comparison to non-P2P hosts. The time window size W is a con-figurable parameter. Intuitively, longer time windows allow for computing more accurate values for the features, and consequently yield more accurate results (in Section 3 we experiment withW ranging form 10 to 60 minutes).
To carry out the detection, at the end of each time window we input the computed feature vectors FH (one vector per host and per time window) to
a classifier based on decision trees (see Section 3.2 for details). To train the classifier, we use a dataset of traffic that includes non-P2P traffic collected from our departmental network, as well as the traffic generated by a variety of P2P
applications, including Skype, eMule, BitTorrent, etc., over several days. The data collection approach we used to prepare the training datasets and assess the accuracy of the P2P host detection module is discussed in detail in Section 3.1.
2.2 P2P Traffic Categorization
After we have identified P2P hosts in the monitored network, the P2P traffic cat-egorization module aims to determine what type of P2P application these hosts are running. Since different P2P applications (including P2P-botnets) use dif-ferent P2P protocols and networks (i.e., they connect to difdif-ferent sets of peers), they show distinguishable behaviors in terms of their network communication patterns. Therefore, we construct a classification system that is able to learn dif-ferent P2P application profiles from past traffic samples, and that can accurately categorize new P2P traffic instances.
As shown in Figure 1, the categorization module consists of a number of one-class one-classifiers [20] that specialize in recognizing a specific application profile. For example, we train a one-class classifier to recognize P2P traffic generated by Skype, one that can recognize eMule, etc. Also, we build a number of one-class classifiers that aim to recognize different P2P-botnets, such as Storm, Waledac, and a P2P-based version of Zeus. Overall, in our experiments we build eight dif-ferent one-class classifiers, with five models dedicated to recognizing five difdif-ferent legitimate P2P applications, and three models dedicated to categorizing differ-ent P2P-botnets (see Section 3.3). PeerRush can be easily extended to new P2P applications by training a specialized one-class classifier on the new P2P traffic, and plugging the obtained application profile into the categorization module.
Given the traffic generated by a previously detected P2P host H, we first extract a number of statistical features (described below) that constitute the traffic profilePH ofH within a given time window. Then, we feed PH to each
of the previously trained one-class classifiers, and for each of them we obtain a detection score. For example, letskbe the score output by the classifier dedicated
to recognizing Skype. If sk is greater than a predefined threshold θk, which is
automatically learned during training, there is a high likelihood thatHis running Skype. If no classifier outputs a scoresi(where the subscriptiindicates thei-th
classifier) greater than the respective application detection thresholdθi, we label
the P2P traffic fromH as “unknown”. That is, PeerRush detected the fact that
H is running a P2P application, but the traffic profile does not fit any of the previously trained models. This may happen in particular ifH is running a new P2P applications or an unknown P2P-botnet for which we could not capture any traffic samples to learn its application profile (other possible scenarios are discussed in Section 4).
Notice that the thresholdθi is set during the training phase to cap the false
positive rate to≤1%. Specifically, the false positives produced by thei-th clas-sifier over the traffic from P2P applications other than the one targeted by the classifier is ≤1%. due to the nature of statistical classifiers, it is possible that more than one one-class classifier may output a scoresigreater than the
respec-tive detection threshold θi, thus declaring that PH matches their application
that consists of a multi-class classifier trained to distinguish among the eight different P2P applications that we consider in our experiments. In this case, the multi-class classifier will definitely assign one application among the avail-able ones, and the output of the multi-class classifier can then be interpreted as the most likely P2P application that is running onH. This information, along with the output of each one-class classifier, can then be used by the network administrator to help decide ifH violates the network security policies.
The main reason for building the application profiles using one-class classi-fiers, rather than directly using multi-class classification algorithms, is that they enable a modular classification approach. For example, given a new P2P appli-cation and some related traffic samples, we can separately train a new one-class classifier even with very few or no counterexamples (i.e., traffic samples from other P2P applications), and we can then directly plug it into the P2P traf-fic categorization module. Learning with few or no counterexamples cannot be easily done with multi-class classifiers. In addition, differently from multi-class classifiers, which will definitely assign exactly one class label among the possible classes, by using one-class classifiers we can more intuitively arrive to the conclu-sion that a given traffic profilePH does not really match any previously learned
P2P traffic and should therefore be considered as belonging to an “unknown” P2P application, for example.
Feature Engineering To distinguish between different P2P applications, we
focus on theirmanagement (or control) traffic, namely network traffic dedicated to maintaining updated information about the overlay P2P network at each peer node [1]. The reason for focusing on management flows and discarding data-transfer flows is that management flows mainly depend on the P2P protocol de-sign and the P2P application itself, whereas data flows are more user-dependent, because they are typically driven by the P2P application user’s actions. Because the usage patterns of a P2P application may vary greatly from user to user, focusing on management flows allows for a more generic, user-independent P2P categorization approach. These observations apply to both legitimate P2P ap-plications and P2P-botnets.
Management flows consist of management packets, such as keep-alive mes-sages, periodically exchanged by the peers to maintain an accurate view of the P2P network to which they belong. In a way, the characteristics of management flows serve as a fingerprint for a given P2P protocol, and can be used to build accurate application profiles. The first question, therefore, is how to identify management flows and separate them from the data flows. The answer to this question is complicated by the fact that management packets may be exchanged over management flows that are separate from the data flows, or may be embed-ded within the data flows themselves, depending on the specific P2P protocol specifications. Instead of making strong assumptions about how managements packets are exchanged, we aim to detect management flows by applying a few intuitive heuristics as described below.
We consider the outgoing flows of each P2P hosts (as detected by the P2P host detection module), and we use the following filters to identify the manage-ment packets and discard any other type of traffic:
1) Inter-packet delays: given a flow, we only consider packets that have at least a time gapδ > θδ between their previous and following packets, whereθδ is a
predefined threshold (set to one second, in our experiments). More precisely, letpi be the packet under consideration within a flowf, andpi−1 andpi+1 be the packets in f that immediately precede and follow pi, respectively.
Also, letδ−andδ+be the inter-packet delay (IPD) betweenp
i−1andpi and
between pi and pi+1, respectively. We label pi as a management packet if
both δ− and δ+ are greater than θ
δ. The intuition behind this heuristic is
that management packets are exchanged periodically, while data packets are typically sent back-to-back. Therefore, the IPDs of data packets are typically very small, and therefore data packets will be discarded. On the other hand, management packets are typically characterized by much larger IPDs (in fact, aθδ = 1sIPD is quite conservative, because the IPDs between management
packets are often much larger).
2) Duration of the connection: P2P applications often open long-lived connec-tions through which they exchange management packets, instead of exchang-ing each management message in a new connection (notice that UDP packets that share the same source and destinations IPs and ports are considered as belonging to the same virtual UDP connection). Therefore, we only consider flows that appear as long-lived relative to the size W of the traffic analy-sis time windows, and we discard all other flows. Specifically, flows that are shorter than W3 are effectively excluded from further analysis.
3) Bi-directionality: this filter simply considers bi-directional flows only. The assumption here is that management messages are exchanged both ways be-tween two hosts, and for a given management message (e.g., keep-alive) we will typically see a response or acknowledgment.
Notice that these rules are only applied to connections whose destination IP ad-dress did not resolve from DNS queries. This allows us to focus only the network traffic that has a higher chance of being related to the P2P application running on the identified P2P host. While a few non-P2P flows may still survive this pre-filtering (i.e., flows whose destination IP was not resolved from DNS queries, and that are related to some non-P2P application running on the same P2P host), thus potentially constituting noise w.r.t. the feature extraction process, they will be excluded (with very high probability) by the management flow identification rules outlined above.
After we have identified the management (or control) flows and packets, we extract a number of features that summarize the “management behavior” of a P2P host. We consider two groups of features: features based on the distribution of bytes-per-packet (BPP) in the management flows, and feature based on the distribution of the inter-packet delays (IPD) between the management packets. Specifically, given a P2P host and its P2P management flows, we measure eight
features computed based on the distribution of BPPs of all incoming and out-going TCP and UDP flows and the distribution of IPDs for all incoming and outgoing TCP and UDP packets within each management flow.
The intuition behind these features is that different P2P applications and protocols use different formats for the management messages (e.g., keep-alive), and therefore the distribution of BPP will tend to be different. Similarly, differ-ent P2P applications typically behave differdiffer-ently in terms of the timing between when management messages are exchanged between peers. As an example, Fig-ure 2 reports the distribution of BPP for four different P2P applications. As can be seen from the figure, different applications have different profiles, which we leverage to perform P2P trafficcategorization.
0 75 150 225 300 375 0 100 200 300 400
outgoing UDP byte/pkt
Frequency Skype (a) Skype 0 75 150 225 300 375 0 200 400 600 800 1000 1200 1400
outgoing UDP byte/pkt
Frequency eMule (b) eMule 0 75 150 225 300 375 0 2000 4000 6000 8000 10000 12000
outgoing UDP byte/pkt
Frequency uTorrent (c)µTorrent 0 75 150 225 300 375 0 100 200 300 400
outgoing UDP byte/pkt
Frequency
Zeus
(d) Zeus Fig. 2.Distribution of bytes per packets for management flows of different P2P apps.
To translate the distribution of the features discussed above into a pattern vector, which is a more suitable input for statistical classifiers, we proceed as fol-lows. First, given a hostHand its set of management flows, we build a histogram for each of the eight features. Then, given a histogram, we sort its “peaks” ac-cording to their height in descending order and select the top ten peaks (i.e., the highest ten). This is done to isolate possible noise in the distribution, and to focus only on the most distinguishing patterns. For each of these peaks we record two values: the location (in the original histogram) of the peak on the xaxis, and its relative height compared to the remaining top ten peaks. For example, the relative height ˆhk of thek-th peak is computed as ˆhk=hk/P
10
j=1hj, where hjis the height of thej-th peak. This gives us a vector of twenty values for each
feature. So the overall feature vector contains 160 features.
This format of the feature vectors is used both as input to the application-specific one-class classifiers and the P2P traffic disambiguation multi-class clas-sifier (see Figure 1). The learning and classification algorithms with which we experimented and the datasets used for training the P2P traffic categorization module are discussed in Section 3.3.
3
Evaluation
3.1 Data Collection
PeerRush relies on three main datasets for the training of the P2P host detec-tion and traffic categorizadetec-tion modules: a dataset of P2P traffic generated by a variety of P2P applications, a dataset of traffic from three modern P2P botnets,
and a dataset of non-P2P traffic. In the next Sections, we will refer back to these datasets when presenting our evaluation results, which include cross-validation experiments. We plan to make our P2P traffic datasets openly available to facil-itate further research and to make our results easier to reproduce3.
(D1) Ordinary P2P Traffic To collect the P2P traffic dataset, we built
an experimental network in our lab consisting of 11 distinct hosts which we used to run 5 different popular P2P applications for several weeks. Specifically, we dedicated 9 hosts to running Skype, and the two remaining hosts to run, at different times, eMule, µTorrent, Frostwire, and Vuze. This choice of P2P applications provided diversity in both P2P protocols and networks (see Table 1). The 9 hosts dedicated to Skype were divided into two groups: we configured two hosts with high-end hardware, public IP addresses, and no firewall filtering. This was done so that these hosts had a chance to be elected as Skype super-nodes (indeed, a manual analysis of the volume of traffic generated by these machines gives us reasons to believe that one of the two was actually elected to become a super-node). The remaining 7 hosts were configured using filtered IP addresses, and resided in distinct sub-networks. Using both filtered and unfiltered hosts allowed us to collect samples of Skype traffic that may be witnessed in different real-world scenarios. For each host, we created one separate Skype account and we made some of these accounts be “friends” with each other and with Skype instances running on machines external to our lab. In addition, using AutoIt
(autoitscript.com/site/autoit), we created a number of scripts to simulate
user activities on the host, including periodic chat messages and phone calls to friends located both inside and outside of our campus network. Overall, we collected 83 days of a variety of Skype traffic, as shown in Table 1.
We used other two distinct unfiltered hosts to run each of the remaining legitimate P2P applications. For example, we first used these two hosts to run two instances of eMule for about 9 consecutive days. During this period, we initiated a variety of file searches and downloads4. Whenever possible, we used AutoIt to automate user interactions with the client applications. We replicated this process to collect approximately the same amount of traffic from FrostWire,
µTorrent, and Vuze.
(D2) P2P Botnet Traffic In addition to popular P2P applications, we were
able to obtain (mainly from third parties) several days of traffic from three dif-ferent P2P-botnets: Storm [8], Waledac [16], and Zeus [12]. It is worth noting that the Waledac traces were collected before the botnet takedown enacted by Microsoft, while the Zeus traces are from a very recent version of a likely still ac-tive Zeus botnet that relies entirely on P2P-based command-and-control (C&C) communications. Table 1 indicates the number of hosts and days of traffic we were able to obtain, along with information about the underlying transport pro-tocol used to carry P2P management traffic.
3 Please contact the authors to obtain a copy of the datasets. 4
To avoid potential copyright issues we made sure to never store the downloads per-manently.
(D3) Non-P2P Traffic To collect the dataset of non-P2P traffic, we proceeded as follows. We monitored the traffic crossing our departmental network over about 5 days, and collected each packet in an anonymized form. Specifically, we wrote a sniffing tool based onlibpcapthat can anonymize the packets “on the fly” by mapping the department IPs to randomly selected 10.x.x.xaddresses using a keyed hash function, and truncating the packets payloads. We leave all other packet information intact. Also, we do not truncate the payload of DNS response packets, because we need domain name resolution information to extract a number of statistical features (see Section 2). Because users in our departmental network may use Skype or (sporadically) some P2P file-sharing applications, we used a number of conservative heuristics to filter out potential P2P hosts from the non-P2P traffic dataset.
To identify possible Skype nodes within our network, we leverage the fact that whenever a Skype client is started, it will query domain names ending in
skype.com[7]. Therefore, we use the DNS traffic collected from our department
to identify all hosts that query any Skype-related domain names, and we exclude them from the traces. Obviously, this is a very conservative approach, because it may cause a non-negligible number of false positives, excluding nodes that visit thewww.skype.comwebsite, for example, but that are not running Skype. However, we chose this approach because it is difficult to devise reliable heuristics that can identify with high precision what hosts are running Skype and for how long (that’s why systems such as PeerRush needed in the first place), and using a conservative approach gives us confidence on the fact that the non-P2P dataset contains a very low amount of noise. Using this approach, we excluded 14 out of 931 hosts in our network.
To filter out other possible P2P traffic, we used Snort (snort.org) with a large set of publicly available P2P detection rules based on payload content inspection. We ran Snort in parallel to our traffic collection tool, and excluded from our dataset all traffic from hosts that triggered a Snort P2P detection rule. Again, we use a very conservative approach of eliminatingall traffic from suspected P2P hosts to obtain a clean non-P2P dataset. Using this conservative approach, we filtered out 7 out of 931 IP addresses from our network.
The heuristics-based traffic filtering approach discussed above aims to pro-duce a dataset for which we have reliableground truth. While our heuristics are quite conservative, and may erroneously eliminate hosts that are not actually engaging in P2P traffic, we ended up eliminating only a small fraction of hosts within our network. Therefore, we believe the remaining traffic is representative of P2P traffic in our department. Naturally, it is also possible that the non-P2P dataset may contain some non-P2P traffic (e.g., encrypted or botnet traffic) that we were not able to label using Snort or our heuristics, thus potentially inflating the estimated false positives generated by PeerRush. However, since this would in the worst case underestimate the accuracy of our system, not overestimate it, we can still use the dataset for a fair evaluation.
Table 1.P2P traffic dataset summary
Application Protocol Hosts Capture Days Transport
Skype Skype 9 83 TCP/UDP
eMule eDonkey 2 9 TCP/UDP
FrostWire Gnutella 2 9 TCP/UDP
µTorrent BitTorrent 2 9 TCP/UDP
Vuze BitTorrent 2 9 TCP/UDP
Storm - 13 7 UDP
Zeus - 1 34 UDP
Waledac - 3 3 TCP
Table 2. P2P Host
De-tection: results of
10-fold cross-validation using
J48+AdaBoost
time window TP FP AUC 60 min 99.5% 0.1% 1 40 min 99.1% 0.8% 0.999 20 min 98.4% 1.1% 0.999 10 min 97.9% 1.2% 0.997
3.2 Evaluation of P2P Host Detection
Balanced Dataset To evaluate the P2P host detection module, we proceed as
follows. We perform cross-validation tests using the datasets D1, D2, andD3
described in Section 3.1. We then applied the process described in Section 2.1 to extract statistical features and translate the traffic into feature vectors (one vector per host and per observation time window). Because the volume of Skype-related traffic in D1 was much larger than the traffic we collected from the remaining popular P2P applications, we under-sampled (at random) the Skype-related traffic to obtain a smaller, balanced dataset. Also, we under-sampled fromD3to obtain approximately the same number of labeled instances derived from P2P and non-P2P traffic. Consequently, our training set for this module contains roughly the same number of samples from legitimate P2P applications and from the non-P2P traffic.
Cross-validation To perform cross-validation, we initially excludedD2, and
only considered a balanced version ofD1andD3. As a classifier for the P2P host detection module we used boosted decision trees. Specifically, we employ Weka to run 10-fold cross-validation using the J48 decision tree and the AdaBoost meta-classifier (we set AdaBoost to combine 50 decision trees). We repeated the same experiment by measuring the features for different values for the time window length W ranging from 10 to 60 minutes. Due to space constraints, we only discuss the results for the shortest and longest time windows. For W = 60 minutes, we had 1,885 P2P and 3,779 non-P2P training instances, while for 10 minutes we had 10,856 P2P and 19,437 non-P2P instances. The results in terms of true positive rate (TP), false positive rate (FP), and area under the ROC curve (AUC) are summarized in Table 2. As can be seen, the best results are obtained for the 60 minutes time window, with a 99.5% true positives and a 0.1% false positives. This was expected, because the more time we wait, the more evidence we can collect on whether a host is engaging in P2P communications. However, even at a 10 minutes time window, the classifier perform fairly well, with a true positive rate close to 98%, a false positive rate of 1.2%, and an AUC of 99.7%.
Botnets Besides cross-validation, we performed two additional sets of
experi-ments. First, we train the P2P host detection classifier (we use J48+AdaBoost) using D1andD3, but not D2. Then, given the obtained trained classifier, we test against the P2P botnet trafficD2. The results of this experiments are sum-marized in Table 3 (due to space constraints we only show results for W = 10
Table 3.P2P Host Detection: classifi-cation of P2P botnet traffic instances
Time Win. Botnet Instances TPs IPs detected 60 min Storm 306 100% 13 out of 13 Zeus 825 92.48% 1 out 1 Waledac 75 100% 3 out 3 10 min Storm 1,834 100% 13 out of 13 Zeus 4,877 33.46% 1 out of 1 Waledac 444 100% 3 out of 3
Table 4. P2P Host Detection: “leave one application out” test
time window: 10 minutes Left out Test on left out app.
app. Instances TPs IPs detected Skype 99,165 90.26% 9 out of 9 eMule 2,316 100% 2 out of 2 Frostwire 2,316 100% 2 out of 2
µTorrent 2,035 100% 2 out of 2 Vuze 2,035 100% 2 out of 2
and W = 60). As we can see, the P2P host detection classifier can perfectly classify all the instances of Storm and Waledac traffic. Zeus traffic is somewhat harder to detect, although when we set the time window for feature extraction to 40 minutes or higher we can correctly classify more than 90% of all Zeus traffic instances. We believe this is due to the fact that in our Zeus dataset the host infected by the Zeus botnet sometimes enters a “dormant phase” in which the number of established connections decreases significantly. Also, by consider-ing trafficover different time windows, all the IP addresses related to the P2P botnets are correctly classified as P2P hosts. That is, if we consider the Zeus-infected host over a number of consecutive time windows, the Zeus P2P traffic is correctly identified in at least one time window, allowing us to identify the P2P host. Therefore, the 33.46% detection rate using 10-minute time windows is not as low as it may seem, in that the host was labeled as a P2P host at least once in every three time windows.
Leave-one-out In addition, we performed a number of experiments to assess
thegeneralization abilityof our P2P host classifier. To this end, we again trained the classifier onD1andD3. This time, though, we train the classifier multiple times, and every time we leave out one specific type of P2P traffic fromD1. For example, first we train the classifier while leaving out all Skype traffic from the training dataset, and then we test the obtained trained classifier on the Skype traffic that we left out. We repeat this leaving out fromD1one P2P application at a time (as before, we did not includeD2in the training dataset). The results of this set of experiments forW = 10 are reported in Table 4. The results show that we can detect most of the left out applications perfectly in all time windows. In case of Skype, the classifier can still generalize remarkably well and correctly classifies more than 90% of the Skype instances using W = 10. Using larger time windows improves the results further, because the statistical features can be measured more accurately. Also, theIPs detected column shows that all IP addresses engaged in P2P communications are correctly classified as P2P hosts.
Other non-P2P instances Besides the cross-validation experiments, to
fur-ther asses the false positives generated by our system we tested the P2P host detection classifier over the portion of the non-P2P traffic dataset that was left out from training (due to under-sampling). ForW = 60 minutes we obtained a FP rate of 0.29%. With W = 10 minutes, we obtained a FP rate of 1.19%.
3.3 Evaluation of P2P Traffic Categorization
In this Section, we evaluate the P2P traffic categorization module. First, we sep-arately evaluate the one-class classifiers used to learn single application profiles (E1) and the auxiliary P2P traffic disambiguation module (E2). Then, we eval-uate the entire P2P traffic categorization module in a scenario that replicates the intended use of PeerRush after deployment (E3).
In all our experiments, we translate a host’s traffic into statistical features using the process described in Section 2.2. Similar to the evaluation of the P2P host detection module presented in Section 3.2, we experiment with values of the time windows W ranging from 10 to 60 minutes, although due to space constraints we can only discuss a sub-set of the obtained results.
(E1) P2P Application Profiles As mentioned in Section 2.2, each
appli-cation profile is modeled using a one-class classifier. Specifically, we experiment with the Parzen, KNN, and Gaussiandata description classifiers detailed in [20] and implemented in [19]. To build a one-class classifier (i.e., an application pro-file) for Skype traffic, for example, we use part of the Skype traffic from D1as atarget training dataset, and a subset of non-Skype traffic from the other legit-imate P2P applications (again from D1) as anoutlier validation dataset. This validation dataset is used for setting the classifier’s detection threshold so to ob-tain≤1% false positives (i.e., non-Skype traffic instances erroneously classified as Skype). Then we use the remaining portion of the Skype and non-Skype traffic from D1that we did not use for training and threshold setting to estimate the FP, TP, and AUC. We repeat the same process for each P2P application inD1
and P2P botnets inD2. Each experiment is run with a 10-fold cross-validation setting for each of the considered one-class classifiers. The results of these ex-periments are summarized in Table 5. The “#Inst.” column shows the overall number of target instances available for each traffic class.
Besides experimenting with different one-class classifiers, we also evaluated different combinations of features and different feature transformation algo-rithms, namely principal component analysis (PCA) and feature scaling (Scal.). The “Configuration” column in Table 5 shows, for each different time window, the best classifier and feature configuration. For example, the first row of results related to Skype reports the following configuration: “60min; KNN; 32 feat.; PCA”. This means that the best application profile for Skype when considering a 60 minutes traffic time window was obtained using the KNN algorithm, 32 features (out of all possible 160 features we extract from the traffic characteris-tics), and by applying the PCA feature transformation. In the remaining rows, “Scal.” indicates features scaling, while “-” indicates no feature transformation. Notice that because we use one-class classifiers, each application profile can be built independently from other profiles. Therefore, we can train and deploy different optimal classifier configurations depending on the target P2P applica-tion and desired time window W for traffic analysis. For example, for a time window of 60 minutes, we can use a KNN classifier with 32 features transformed using PCA for Skype, and a Parzen classifier with 16 scaled features for eMule. This gives us a remarkable degree of flexibility in building the application pro-files, compared to multi-class classifiers, because in the latter case we would be
Table 5.One-Class Classification Results App. #Inst. Configuration TP FP AUC
Skype 526 60min; KNN; 32 feat.; PCA 96.54% 0.74% 0.998 579 10min; Parzen; 16 feat.; - 91.27% 1.00% 0.978 eMule 387 60min; Parzen; 16 feat; Scal. 90.64% 0.92% 0.989 483 10min; KNN; 8 feat.; PCA 88.40% 1.16% 0.961 Frostwire 382 60min; KNN; 12 feat.; PCA 85.58% 0.96% 0.966 467 10min; KNN; 8 feat.; PCA 92.68% 1.25% 0.989
µTorrent 370 60min; KNN; 8 feat.; - 92.94% 1.30% 0.948 609 10min; Parzen; 4 feat.; Scal. 94.55% 1.24% 0.992 Vuze 376 60min; KNN; 8 feat.; - 91.92% 0.95% 0.979 514 10min; KNN; 8 feat.; PCA 84.18% 1.17% 0.964 Storm 162 60min; Parzen; 16 feat.; - 100% 0% 1.000 391 10min; Parzen; 12 feat.; PCA 100% 0% 1.000 Zeus 375 60min; KNN; 4 feat.; - 97.29% 0.99% 0.996 188 10min; KNN;12 feat.; - 94.53% 0.79% 0.976 Waledac 37 60min; Gaussian; 12 feat.; PCA 99.99% 0.90% 0.998
limited to using the same algorithm and set of features for all application profiles. Furthermore, using multi-class classifiers makes identifying P2P traffic that does not match any of the profiles (i.e., “unknown” P2P traffic) more straightforward. Table 5 shows that for most applications we can achieve a TP rate of more than 90% with an FP rate close to or below 1%. In particular, all traffic related to P2P botnets can be accurately categorized with very high true positive rates and low false positives. These results hold in most cases even for time windows of W = 10 minutes, with the exception of Waledac, for which we were not able to build a comparably accurate application profile using a 10 minutes time window, since we did not have enough target instances to train a classifier (this unsatisfactory result is omitted from Table 5).
(E2) P2P Traffic Disambiguation When a traffic instance (i.e., the feature
vector extracted from the traffic generated by a host within a given time window) is classified as target by more than one application profile, we can use the traf-fic disambiguation module to try to break the tie. The disambiguation module (see Section 2) consists of a multi-class classifier based on the Random Forest algorithm combining 100 decision trees. In this case, we use all 160 features computed as described in Section 2.2 without any feature transformation. We independently tested the disambiguation module using 10-fold cross-validation. On average, we obtained an accuracy of 98.6% for a time window of 60 minutes, 98.3% for 40 minutes, 97.5% for 20 minutes, and 96.7% for 10 minutes.
(E3) Overall Module Evaluation In this section we aim to show how the
P2P categorization module performs overall, and how robust it is to noise. To this end, we first split theD1dataset into two parts: (i) a training set consisting of 80% of the traffic instances (randomly selected) that we use for training the single application profiles, automatically learn their categorization thresholds, and to train the disambiguation module; (ii) a test set consisting of the remaining 20% of the traffic instances.
To test both the accuracy and robustness of PeerRush’s categorization mod-ule, we also perform experiments by artificially adding noise to the traffic in-stances in the test dataset. In doing so, we consider the case in which non-P2P traffic is misclassified by the P2P host detection module and not completely filtered out through the management flow identification process described in
Section 2.2. To obtain noisy traffic we processed the entire D3dataset (about 5 days of traffic from 910 distinct source IP addresses) to identify all flows that resemble P2P management flows. To simulate aworst case scenario, we took all the noisy management-like flows we could obtain, and we randomly added these flows to all the P2P traffic instances in the 20% test dataset described above. Effectively, we simulated the scenario in which the traffic generated by a known P2P host is overlapped with non-P2P traffic from one or more randomly selected hosts from our departmental network.
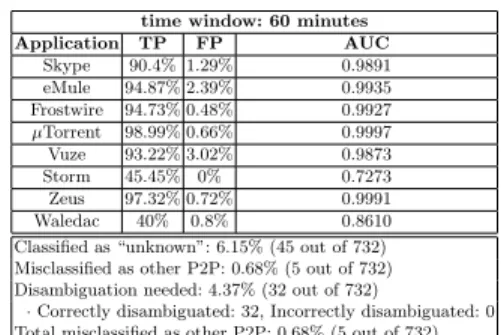
For each test instance fed to the categorization module, we have the following possible outcomes: (1) the instance is assigned the correct P2P application label; (2) no application profile “matches”, and the P2P traffic instance is therefore labeled as “unknown”; (3) more than one profile “matches”, and the instance is sent to the disambiguation module. Table 6 and Table 7 report a summary of the obtained results related to the 20% test dataset with and without extra added noise, considering W = 60 minutes. For example, Table 7 shows that over 90% of the Skype-related traffic instances can be correctly labeled as being generated by Skype with 1.29% FP, even in the presence of added noise.
Overall, 45 out of 732 (6.15%) of the noisy test traffic instances were classified as “unknown”, 32 instances were passed to the disambiguation module and all of them were classified perfectly. Finally, only 5 out of 732 instances were eventually misclassified as belonging to the wrong P2P application. It is worth noting that an administrator could handle the “unknown” and misclassified instances by relying on the categorization results for a given P2P host across more than one time window. For example, a P2P host that is running eMule may be categorized as “unknown” in one given time window, but has a very high chance of being correctly labeled as eMule in subsequent windows, because the true positive rate for eMule traffic is above 93%. In fact, in our experiments, by considering the output of the categorization module over more than one single time window we were always able to attribute the P2P traffic in our test to the correct application. As we can see by comparing Table 6 and Table 7, the extra noise added to the P2P traffic instances causes a decrease in the accuracy of the P2P traffic cate-gorization module. However, in most cases the degradation is fairly limited. The noise has a more negative impact on the categorization of Storm and Waledac, in particular. Notice, though, that the results reported in Table 7 are again re-lated to single traffic instances (i.e., a single time window). This means that if a Storm- or Waledac-infected host connects to its botnet for longer than one time window, which is most likely the case since malware often makes itself permanent into the compromised systems, the probability of correct categorization would increase. Therefore, even in the scenario in which each P2P host is also running other network applications that may introduce noise in the management flow identification and feature extraction process, we can accurately detect the P2P traffic, and still achieve satisfactory categorization results.
We also wanted to determine how PeerRush’s categorization module would deal with noise due to detection errors in the P2P host detection module. To this end, we further tested the classifier using traffic from the non-P2P traffic dataset
that were misclassified as P2P by the P2P host detection module. We found that considering a time window of 60 minutes, only 35 traffic instances misclassified by the P2P host detection module passed the management flow discovery filter. Of these, 33 were classified as “unknown” by the categorization module, one was misclassified as both Skype andµTorrent, and one was misclassified as Zeus.
Table 6.80/20 experiments time window: 60 minutes
Application TP FP AUC Skype 100% 0.86% 1 eMule 93.59% 1.44% 0.9968 Frostwire 88.31% 0.97% 0.9873 µTorrent 96.97% 1% 0.9789 Vuze 93.1% 0.7% 0.9938 Storm 100% 0% 1 Zeus 96.69% 1.26% 0.9964 Waledac 57.14% 0.83% 0.9420
Classified as “unknown”: 3.96% (29 out of 732) Misclassified as other P2P: 0% (0 out of 732) Disambiguation needed: 4.64% (34 out of 732)
·Correctly disambiguated: 33, Incorrectly disambiguated: 1
Total misclassified as other P2P: 0.14% (1 out of 732)
Table 7.80/20 with extra noise time window: 60 minutes
Application TP FP AUC Skype 90.4% 1.29% 0.9891 eMule 94.87% 2.39% 0.9935 Frostwire 94.73% 0.48% 0.9927 µTorrent 98.99% 0.66% 0.9997 Vuze 93.22% 3.02% 0.9873 Storm 45.45% 0% 0.7273 Zeus 97.32% 0.72% 0.9991 Waledac 40% 0.8% 0.8610
Classified as “unknown”: 6.15% (45 out of 732) Misclassified as other P2P: 0.68% (5 out of 732) Disambiguation needed: 4.37% (32 out of 732)
·Correctly disambiguated: 32, Incorrectly disambiguated: 0
Total misclassified as other P2P: 0.68% (5 out of 732)
4
Discussion
PeerRush is intentionally built using a modular approach, which allows for more flexibility. For example, as shown in Section 3, it may be best to use a differ-ent number of features and differdiffer-ent classification algorithms to learn the traffic profile of different P2P applications. To build the profile for a new P2P applica-tion we can apply a model selecapplica-tion process, which is commonly used for other machine learning tasks, to find the best classifier configuration for the job, and then we can plug it directly into PeerRush.
One parameter that has direct influence on all the system modules is the observation time window used to split and translate the network traffic into instances (or feature vectors). It is important to notice that while different mod-ules need to extract different statistical features from the same time window, all features can be extracted incrementally, and each given module can simply use the appropriate subset of all the extracted features for its own classification purposes. Also, while all modules perform quite well in most cases by setting the time window length to 10 minutes, the results tend to improve for larger time windows, because this allows the feature extraction process tocollect more evidence. Therefore, fixing the observation time window at 60 minutes for all modules may be a good choice. However, this choice depends on the desired trade-off between thedetection time and thecategorization accuracy.
It is possible that a host may be running more than one P2P application at the same time (or there may be a NAT device that effectively aggregates multiple single hosts), in which case the traffic patterns of these applications may overlap and prevent a match of the profiles. Therefore, PeerRush may categorize these cases as unknown P2P traffic. However, in many practical cases not all P2P applications will be active at the same time. Therefore, the analysis of traffic across different time windows applied by PeerRush may still allow for effectively
distinguishing among P2P applications. However, notice that even in the cases when a host continuously runs more than one active P2P application at the same time, the host will be detected as a P2P host, although its P2P traffic may be classified as “unknown” and may therefore require further analysis by the network administrator.
Botnet developers could try to introduce noise (e.g., dummy packets or ran-dom padding) into the management flows to alter the distribution of BPP and IPDs. This may cause a “mismatch” with a previously learned application profile for the botnet. In this case, PeerRush would still very likely detect the P2P bot-net hosts as running a P2P application, because the features used by the P2P host detection module are intrinsic to P2P traffic in general (see Section 2.1 and the results in Table 4) and are harder to evade. However, the P2P traffic categorization module may classify the P2P botnet traffic as “unknown”, thus requiring further analysis to differentiate the botnet traffic from other possible types of P2P traffic. Because P2P botnet hosts may for example engage in send-ing large volumes of spam emails, be involved in a distributed denial-of-service (DDoS) attack, or download executable binaries to update the botnet software, one possible way to distinguish P2P traffic related to botnets is to monitor for other suspicious network activities originating from the detected P2P hosts [5]. The developer of a new P2P application, including P2P botnets, may at-tempt to model its P2P traffic following the behavior of other legitimate P2P applications. Because some networks may consider most P2P applications (legit-imate or not) as unwanted, the developer may be restricted to mimic a specific type of P2P traffic that is likely to be allowed in most networks (e.g., Skype traffic). However, while possible, morphing the traffic to mimic other protocols may require significant effort [14].
5
Related Work
While P2P traffic detection has been a topic of much research, P2P traffic cat-egorization has received very little attention. Because of space limitations, we cannot mention all related work here and we therefore refer the reader to a re-cent survey by Gomes et al. [4]. In the following, we limit our discussion to the most relevant work on P2P traffic categorization, and on P2P botnet detection. Hu et al. [9] use flow statistics to build traffic behavior profiles for P2P appli-cations. However, [9] does not attempt to separate P2P control and data transfer traffic. Because data transfer patterns are highly dependent on user behavior, the approach proposed [9] may not generalize well to P2P traffic generated by different users. Furthermore, [9] is limited to modeling and categorizing only two benign non-encrypted P2P applications (BitTorrent and PPLive), and does not consider at all malicious P2P applications. Unlike [9], PeerRush categorizes P2P applications based on an analysis of their P2P control traffic, which captures fundamental properties of the P2P protocol in use and is therefore less suscepti-ble to different application usage patterns. Furthermore, we show that PeerRush can accurately categorize many different P2P applications, including encrypted traffic and different modern P2P botnets.
In [6], Haq et al. discuss the importance of detecting and categorizing P2P traffic to improve the accuracy of intrusion detection systems. However, they propose to classify P2P traffic using deep packet inspection, which does not work well in case of encrypted P2P traffic. More recently, a number of studies have addressed the problem of detecting P2P botnets [5, 22, 23]. However, all these works focus on P2P botnet detection, and cannot categorize the detected malicious traffic and attribute them to a specific botnet family. PeerRush is different because it focuses on detecting and categorizing unwanted P2P traffic in general, including a large variety of legitimate P2P applications and botnets. Coskun et al. [2] proposed to discover hosts belonging to a P2P botnet from a seed of compromised hosts. Similarly, [15] analyzes communication graphs to identify P2P botnet nodes. These works focus solely on P2P botnets detection.
6
Conclusion
We presented PeerRush, a novel system for the identification ofunwanted P2P traffic. We showed that PeerRush can accuratelycategorize P2P traffic and at-tribute it to specific P2P applications, including malicious applications such as P2P botnets. We performed an extensive evaluation of the system over a vari-ety of P2P traffic datasets. Our results show that PeerRush can detect all the considered types of P2P traffic with up to 99.5% true positives and 0.1% false positives. Furthermore, PeerRush can attribute the P2P traffic to a specific P2P application with a misclassification rate of 0.68% or less.
Acknowledgments
We would like to thank Brett Mayers for his contribution to collecting the P2P traffic datasets, and the anonymous reviewers for their constructive comments. This material is based in part upon work supported by the National Science Foundation under Grant No. CNS-1149051. Any opinions, findings, and conclu-sions or recommendations expressed in this material are those of the authors and do not necessarily reflect the views of the National Science Foundation.
References
1. J. Buford, H. Yu, and E. K. Lua. P2P Networking and Applications. Morgan
Kaufmann Publishers Inc., 2008.
2. B. Coskun, S. Dietrich, and N. Memon. Friends of an enemy: identifying local members of peer-to-peer botnets using mutual contacts. InProceedings of the 26th Annual Computer Security Applications Conference, ACSAC ’10, 2010.
3. M. Egele, T. Scholte, E. Kirda, and C. Kruegel. A survey on automated dynamic malware-analysis techniques and tools.ACM Comput. Surv., 44(2):6:1–6:42, March 2008.
4. J. V. Gomes, P. R. M. Inacio, M. Pereira, M. M. Freire, and P. P. Monteiro. Detection and classification of peer-to-peer traffic: A survey. ACM Computing Surveys, 2012.
5. G. Gu, R. Perdisci, J. Zhang, and W. Lee. Botminer: Clustering analysis of network traffic for protocol- and structure-independent botnet detection. InProceedings of the 17th conference on Usenix Security Symposium, SS’08, 2008.
6. I. Ul Haq, S. Ali, H. Khan, and S. A. Khayam. What is the impact of P2P traffic
on anomaly detection? In 13th International Conference on Recent Advances in
Intrusion Detection, RAID’10, 2010.
7. B. Hayes. Skype: A practical security analysis. http://www.sans.org/reading_ room/whitepapers/voip/skype-practical-security-analysis_32918.
8. T. Holz, M. Steiner, F. Dahl, E. Biersack, and F. Freiling. Measurements and
mitigation of peer-to-peer-based botnets: a case study on storm worm. In 1st
Usenix Workshop on Large-Scale Exploits and Emergent Threats, LEET’08, 2008. 9. Y. Hu, D.M. Chiu, and J. C. S. Lui. Profiling and identification of P2P traffic.
Comput. Netw., 53(6):849–863, April 2009.
10. T. Karagiannis, A. Broido, M. Faloutsos, and Kc Claffy. Transport layer
identi-fication of p2p traffic. In Proceedings of the 4th ACM SIGCOMM conference on
Internet measurement, IMC ’04, 2004.
11. T. Karagiannis, K. Papagiannaki, and M. Faloutsos. Blinc: multilevel traffic clas-sification in the dark. SIGCOMM Comput. Commun. Rev., 35(4), aug 2005.
12. A. Lelli. Zeusbot/spyeye p2p updated, fortifying
the botnet. http://www.symantec.com/connect/blogs/
zeusbotspyeye-p2p-updated-fortifying-botnet.
13. A. Madhukar and C. Williamson. A longitudinal study of p2p traffic classification. InProceedings of the 14th IEEE International Symposium on Modeling, Analysis, and Simulation, MASCOTS ’06, 2006.
14. H. Mohajeri Moghaddam, M. Derakhshani B. Li, and I. Goldberg. SkypeMorph: Protocol obfuscation for tor bridges. Tech. Report CACR 2012-08.
15. S. Nagaraja, P. Mittal, C.Y. Hong, M. Caesar, and N. Borisov. Botgrep: finding
p2p bots with structured graph analysis. In Proceedings of the 19th USENIX
conference on Security, USENIX Security’10, 2010.
16. C. Nunnery, G. Sinclair, and B. B. Kang. Tumbling down the rabbit hole: exploring the idiosyncrasies of botmaster systems in a multi-tier botnet infrastructure. In Proceedings of the 3rd USENIX conference on Large-scale exploits and emergent threats: botnets, spyware, worms, and more, LEET’10, 2010.
17. S. Sen, O. Spatscheck, and D. Wang. Accurate, scalable in-network identification of p2p traffic using application signatures. InProceedings of the 13th international conference on World Wide Web, WWW ’04, 2004.
18. D. Stutzbach and R. Rejaie. Understanding churn in peer-to-peer networks. In Proceedings of the 6th ACM SIGCOMM conference on Internet measurement, IMC ’06, 2006.
19. D.M.J. Tax. DDtools, the data description toolbox for Matlab. v1.9.1 http:
//prlab.tudelft.nl/david-tax/dd_tools.html.
20. D.M.J. Tax. One-class classification. 2001. Ph.D. Thesis, TU Delft.
21. H.S. Wu, N.F. Huang, and G.H. Lin. Identifying the use of data/voice/video-based p2p traffic by dns-query behavior. InProceedings of the 2009 IEEE international conference on Communications, ICC’09, 2009.
22. T.F. Yen and M. K. Reiter. Are your hosts trading or plotting? telling p2p file-sharing and bots apart. InProceedings of the 2010 IEEE 30th International Con-ference on Distributed Computing Systems, ICDCS ’10, 2010.
23. J. Zhang, R. Perdisci, W. Lee, U. Sarfraz, and X. Luo. Detecting stealthy P2P botnets using statistical traffic fingerprints. InProceedings of the 2011 IEEE/IFIP 41st International Conference on Dependable Systems&Networks, DSN ’11, 2011.