JournalofDeafStudiesandDeafEducation
The ‘‘Wh’’ Questions of
Visual
Phonics
: What, Who, Where,
When, and Why
Rachel F. Narr*
,1, Stephanie W. Cawthon
21CaliforniaStateUniversity,Northridge
2UniversityofTexas,Austin
ReceivedMarch17,2010;revisionsreceivedAugust5,2010;acceptedAugust6,2010
Visual Phonics isa readinginstructional toolthathas been implementedinisolatedclassroomsforover20years.Inthe past5 years,severalexperimental studiesdemonstratedits efficacy with students who are deaf or hard of hearing. Throughanationalsurveywith200participants,thisstudy specificallyaddresseswho,where,how,andwhyasampleof teachersuseVisual Phonics intheireverydayreading instruc-tion.Through checklistsofteachingpractice,rating scales, and open-endedquestions,teachers self-reportedtheiruse ofVisual Phonics,reflecteduponitsefficacy,andwhatthey think about using it with students with a diverse set of instructionalneeds.ThemajorityreportedthatVisual Pho-nics was easy to use, engaging to students, and easy to integrateintoastructuredreadingcurriculum.Themajority of respondents agreed that it helps increase phonemic awareness and decoding skills,buildvocabulary, aswellas increasereadingcomprehension.The implicationsof these findings in bridging the research-to-practice gap are discussed.
Learningtoreadisacomplexprocessthatisacquired
withlittleeffortbymanychildrenwhenthereisa
con-vergence of optimal conditions, most importantly
stronglanguageskills,duringtheirearlyyears.In
con-trast, learningtoreadcan beadauntingprospectfor
someyoungchildren,particularlythoseidentifiedwith
special needs. Effective reading instruction requires
a strongtheoreticalknowledge base; for typically
de-velopingchildren,teachingreadingcanbe
straightfor-ward and implemented according tostate-prescribed
standards anddistrictcurriculum. However,teaching
reading can bedaunting ifthere is not an alignment
*CorrespondenceshouldbesenttoRachelF.Narr,Departmentof Spe-cialEducation,MichaelD.EisnerCollegeofEducation,CaliforniaState University,Northridge,18111NordhoffStreet,Northridge,CA 91330-8265(e-mail:[email protected]).
betweentheinstructional approach andthe language
skillsofthestudents.Teachersofstudentswithspecial
needs, like their counterparts in general education,
frequently find creative ways to adapt, modify, and
supplementthecurriculumtomakeitmostaccessible
totheirstudents.Thisprocessofmodifyingand
sup-plementing materials is particularly frequent for
teachersofdeaforhard-of-hearing(DHH)students.
TheuseofVisual Phonics isanimportantexample
ofhow teachers have adapted phonics-basedreading
instructionforDHHstudents.See-the-Sound/Visual
Phonics is a multisensory system of hand cues and
writtensymbolsusedtosupplement anyreading
cur-riculumor readingmethod.Thehand-cuesarevisual
andtactilerepresentationsofphonemesandareused
to convey phonemic information about phonemes
withinwords.Forexample,thespokenwordtoe would
berepresentedusingthehandcuesforthephonemes
/t/and /o/.The /t/ is represented by flicking the
index finger off of the thumb, in the area near the
mouth, with palm facing forward. This ‘‘flicking’’
movement of the index finger kinesthetically
repre-sentswhat thetonguedoesinthemouthwhen
artic-ulating the phoneme /t/. That said, articulatory
production (voiced or unvoiced) is helpful but not
requiredtoperceivethehandcues.Thewritten
sym-bolscan be used todemonstrate spelling patterns or
phoneticwordstructure.TeacherslearntouseVisual
Phonics throughprofessionaldevelopmentprovidedby
licensed trainers sanctioned through International
CommunicationsLearningInstitute(ICLI),the
orga-nizationthatownstherightstoVisual Phonics.
Downloaded from
jdsde.oxfordjournals.org
by guest on October 1, 2010
TheAuthor2010.PublishedbyOxfordUniversityPress.Allrightsreserved. doi:10.1093/deafed/enq038
Visual Phonics isatoolthathasbeenimplemented
inisolatedclassroomsfor over20years,butuntil
re-cently,usedwithoutthesupportofempiricalevidence.
Its attraction and implementation has instead been
basedlargelyonanecdotalsupport.Althoughteachers
aretaughttouseitthroughformaltraining,little
pub-lishedinformation reports theefficacyofVisual
Pho-nics with DHH students. Recent experimental and
quasi-experimental studies demonstrate the potential
positive impact that Visual Phonics has on reading
achievement when it is used with systematic and
explicit reading instruction (Narr, 2008; Trezek &
Malmgren, 2005; Trezek & Wang, 2006; Trezek
et al., 2007). Although this research evidence adds
significantlytoour understandingofhowVisual
Pho-nics can be used in specific situations with specific
curricula, it does notdescribe the rangeof everyday
useandteachers’perceptionsofitseffectivenesswith
adiversestudent population.
Theoretical Perspective
Although teachers ofDHH studentsuse a varietyof
strategies to teach their students to read and spell,
approaching literacy instruction from a perspective
that includes phonemic awareness and phonics
in-struction is challenging with this population(Mayer,
2007;Musselman,2000;Wangetal.,2008).Thefirst
prerequisiteoflearningtoreadisacquisitionofstrong
expressiveandreceptivelanguageskills,eitherspoken
or signed (Chamberlain & Mayberry, 2008; Mayer,
2007). Once a foundation is built, subsequent skills
necessary for reading can be taught and acquired
(Cummins,2006;Mayer,2007).DHHstudentsoften
come to school with language delays and limited or
inconsistentexposuretospokenlanguage.Asaresult,
they are frequently faced with learning the multiple
andcomplexelementsofEnglishwhiletryingtolearn
toreadatthesametime.
Indiscussing ‘‘What matters mostin theliteracy
development of young deaf children,’’ Mayer (2007)
asks researchers to focus ‘‘attention to the ways in
which we can help children to solve the phonologic
problem ofspoken languageinways thatmake sense
forchildrenwhoaredeaf’’(p.424).Wangetal.(2008)
support the instruction of teaching phonemic
awareness and phonics, citing recent intervention
studiesdemonstratingtheeffectivenessofusingVisual
Phonics in phonics-based reading instruction. Visual Phonics can be used as the tool to help address the
problemofmaking English text(inherently based on
spokenlanguage)moretransparenttoDHHstudents.
At the same time, however, other researchers are
providingevidencethatsuggestsphonemicawareness
and phonics-based strategies may not be critical for
the reading success of deaf learners (Allen et al.,
2009). In the context of these continued questions,
teachers and researchers need to explore and use a
varietyofstrategiesthatmeetDHHlearners’needs.
In a comprehensive review of the literature on
reading development and reading instruction,
SchirmerandMcGough(2005)foundonlyonestudy
thatsoughttoteach phonemicawarenessandexamine
itseffectsonreadingwithDHHstudents.Thatstudy
providednoinformation about thestrategies used to
teach phonemicawareness; therefore, no conclusions
were possible (Schirmer & McGough, 2005).
SchirmerandMcGoughalso foundnostudies to
in-cludein their reviewthat examinedphonics
instruc-tionwithDHHstudents.Sincethat2005publication,
Trezek andcolleagueshave publishedseveral studies
providingstrongcorrelationalevidence between
pho-nicsinstruction andreadingskillsforDHH students
(Trezek & Malmgren, 2005; Trezek & Wang, 2006;
Trezeketal.,2007).Luckneret al.(2005/2006)
spe-cifically examinedliteracy research indeaf education
andfoundobstructedaccesstothephonologicalcode
asoneofthefive mostfrequently citedchallengesin
thefield.Itisclearthateventhoughteachersmayhave
evidence that shows teaching phonologicalawareness
andphonicsskillsareimportantindevelopingliteracy
skillsfor DHH students,how to dothat with DHH
studentsisaconsistentchallenge.
Purpose of Study
The purpose of this study was to investigate how
asampleofteachersuseVisual Phonics intheir
every-dayreadinginstruction.Thestudyattemptedtobetter
understandteachers’ perceived benefits ofitsuse for
students with diverse characteristics. The specific
questionsthatguided thisinquiry were
Downloaded from
jdsde.oxfordjournals.org
1. Whatistheprofessionalbackgroundofteachers whouseVisual Phonics?
2. Inwhatways doteachers useVisual Phonics to
teachreadingtotheirstudents?
3. What are the characteristics of students for
whom Visual Phonics is thought to be most beneficial?
4. What are teachers’ perspectives on the
strengthsandweaknessesofVisual Phonics?
Methods
This study used a mixed-methods survey to collect
informationfromteacherswhouseVisual Phonics with
theirstudents.Thesurveywasinitiallyavailablefor4
months, between October 1, 2008, and January 31,
2009,with alater extensionofthesurveytoincrease
theresponserate,untilMay2009.
RecruitmentandSample Size
The survey instrument was administered online via
theInternetusinghttp://surveymonkey.com. Survey
participantswere recruitedthrough e-mailstoVisual
Phonics trainers, witha focus on national
dissemina-tiontotheteacherstheyhadthentrained.Itislikely
that manyof theparticipants did not know whowas
specificallyconductingthesurveyresearchastrainers
were requested to send an email and a short note
asking their trainees to participatein thesurvey. No
other directionswere provided. The survey wasalso
disseminatedon amore limited basis bytheprimary
authorwhoisaVisual Phonics Traineronherwebsite
and through emails to teachers she has trained.
Participants provided informed consent and were
informed that all their personal information would
remain anonymous. In no cases were any responses
matched with a particular individual. An incentive
for participation wasentry in a random drawing for
one of two $50.00gift cards upon completion ofthe
survey.Initially,230participantscompletedthesurvey.
Inclusion criteria included provision of consent and
responsesdemonstratingtheyactuallyusedVisual
Pho-nics in theirinstruction. Those who did not meetall
thecriteriawereremovedfromthesample.Intheend,
responsesfrom200participantswereusedforanalysis.
SurveyInstrument
Thesurveyformatincludedmultiplechoice,checklist,
Likertscale,andopen-endedresponseitems.The
de-mographics section of the survey focused on the
participants’ own training, including their role,
credentials they held, and years of experience both
overall and specifically using Visual Phonics.
Partici-pants responded to additional questions about the
kind ofVisual Phonics trainingtheyreceived.
Demo-graphics questions also focused on participants’
students.Participantscompletedachecklistof
charac-teristicsofstudentsthattheyhadused Visual Phonics
with,bothinthecurrentschoolyear(2008–09)andin
previous years. Student demographic characteristics
included grade range (e.g., pre-K, elementary
grades), disability status, and English Language
Learnerstatus.
Visual Phonics–use variables were obtained using
aseriesof checklistswith specificinstructional areas.
Forexample, onequestionaskedparticipantsto
indi-catearangeoftasksusedwhileteachingreading,such
asphonemicawareness,phonics,spelling,vocabulary,
andspeechdevelopment.Participantscouldcheckoff
anyor allthese activitiesor addan ‘‘other’’category
withadescription.Participantsindicatedwhetherthey
usedactivitiesforanumberofdifferentstudentgroups,
includingDHH,EnglishLanguageLearners,students
withdisabilities,orstudentswithoutdisabilities.
Teacher perspectiveson what motivated them to
use Visual Phonics and related challenges were
obtained through checklists, Likert scale, and
open-ended questions. The checklists were focused on
evidencethatteachersuse todetermine the
effective-ness of Visual Phonics, such as improvements in
reading comprehension, decoding, performance on
curriculum-based measures, or level of student
engagementinreading.Thesechecklistsalso allowed
participantstodelineatebetweenstudentswith
differ-ent characteristics, using the same designations as
in the activities description, above (e.g., students
whoareDHH).Likertscaleitemsfocusedonteacher
ratingsofVisual Phonics asaninstructionalapproach,
with itemsranging from easeof use, effectivenessin
buildingvocabulary,andhelpingwithclassroom
man-agement. Finally, teachers responded to three open
Downloaded from
jdsde.oxfordjournals.org
ended questions: (a) What do you like most about
Visual Phonics?; (b) What do you find challenging
aboutVisual Phonics?;and(c)Whatwouldyouchange
about Visual Phonics? The intent of these questions
was to elicit ‘‘real-life’’ perspectives from teachers
beyond responses to the checklist and Likert scale
itemstheyprovidedintheprevioussections.
DataAnalysis
Dataanalysisapproachesvarieddependingonthe
na-tureofthesurveyquestionformat,with anemphasis
ondescriptivedata.Foritemssuchasthechecklistor
multiple-choiceitems,analysisfocusedonfrequencies
acrosstheparticipantsampleandsubtotals along
de-mographic categories. Forthe Likert scaleitems,
in-stead of using mean scores, we treated thescores as
a categorical variable. We aggregated responses by
‘‘agreedstronglyor somewhatstrongly’’aswellasby
‘‘disagreedstronglyorsomewhatstrongly.’’Again,
fre-quencies and percent of responses in each category
were run to look at distribution of responses across
ratingpoints.
The finalstepwastoanalyze thequalitativedata.
Thefirstauthorfirstreviewedalltheresponsestothe
threequestionsaboutwhattheylikedmost,what
chal-lenged them, and then recommended changes to
Visual Phonics.Thefirstauthorcreatedasetofinitial
categoriesforeachofthethreequestions.Aniterative
processofdeleting,revising,andrenamingcategories
ensueduntilnonewideasorthemesemerged.A
sub-setof15%oftheresponseswasgiventoasecondrater
who is a reading specialist and had been previously
trained in Visual Phonics. She evaluated the coding
schemeandworked with thefirst author toestablish
interrater reliability. The second rater was blind to
each itemthat wasinitiallycodedby thefirstauthor.
Thefirstauthorprovided definitionsandexamplesof
codesforthesecondratertouseinherreviewofthe
reliabilitysample.Thesecondratercodedthe
reliabil-itysampleandmadenotesasissuesaroseorwhereshe
thought a different or additional code might be
needed.Initialcodingreliabilityfor eachofthethree
qualitative questions was ranged between 70% and
84%.Aftertheinitial roundofreliability coding,the
PIandsecondraterdiscusseddiscrepantitemsaswell
aschangestothecodingcategories.Thesediscussions
resultedinchangestotheemergentcategories,andthe
second round of coding yielded increased reliability
ranging from 90% to 100% for each of the three
questions.
Results
Demographics:WhoUsesVisualPhonics
Professional roles. Asummaryoftheprofessionalrole
for each participant is show in Table 1. Participants
could choose one or more options to describe their
professional roles. Nearly half of the participants
self-identified as teachers of the deaf (n 5 113,
57%)and 44 (22%) chose special education teacher.
Additional roles included regular education teacher
(n 5 33, 16%), reading specialist (n 5 12, 6%),
speech-language pathologist (n 5 24, 12%), and
interpreter(n 56,3%).Justover10%ofparticipants
(n 5 22) chose ‘‘other’’ and described themselves as
‘‘parent,’’‘‘homehospitalteacher,’’‘‘programspecialist,’’
or‘‘volunteer.’’Totalsexceed100%becauseparticipants
hadtheoptionofidentifyingmorethanonerole.
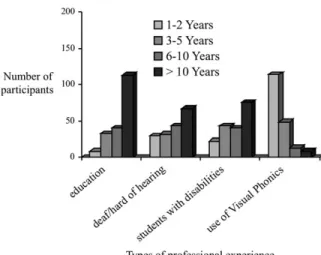
Professional experience. Participants described the
length of their professional experience acrossseveral
categoriesrelatedtoeducation,special education,and
use of Visual Phonics, specifically. Participants
indi-catedoneoffour categoriesofexperience:1–2 years,
3–5 years, 6–10 years, and more than 10 years. A
summary of the experience of study participants is
shownin Figure 1. The most striking contrast is in
Table 1 ProfessionalroleofVisualPhonicsSurvey participants
Professionalrole Numberofparticipants(%)* Specialeducationteacher 44(22)
Deafeducator 113(57)
Regulareducationteacher
Preschool 7(3)
Elementary 25(13)
Secondary 1(.5)
Readingspecialist 12(6) Speechlanguagepathologist 24(12)
Interpreter 6(3)
Other 24(12)
*Thetotalsumstomorethan100%becauseparticipantscouldselect morethanonerole.
Downloaded from
jdsde.oxfordjournals.org
Figure 1 Participant’slengthofprofessionalexperience.
the relative level of experience in education compared
withhowlongparticipantshadbeenusingVisual
Pho-nics. Half of the participants (n 5 105) indicated that
theyhadmorethan10yearsofexperiencein thefield.
Ontheotherhand,asimilarproportion(n 5102)had
only 1–2 years of experience with Visual Phonics. The
participantpoolwasnotnew to educationbut hadnot
necessarilyworkedwithstudentswhoareDHH or
stu-dents with disabilities for their entire teaching career.
Morerelevanttothisdiscussion,themajorityof
partic-ipantswererelativelynewto Visual Phonics.Inthe
dis-cussionsection,weexaminethisfurtherinrelationtothe
natureoftheseparticipants’responsestothequestions.
Setting. Participants represented 21 states, with
higher concentrations of individuals from Colorado
(n 5 18, 9%) North Carolina (n 5 23, 12%), and
Virginia(n 524,12%).Participantsworkedina
vari-ety of educational settings across the continuum of
placementoptions.Figure2summarizes thetypesof
educational settings in which the study participants
used Visual Phonics. Those individuals who noted
multiplesettingsareinthe‘‘other’’category.The
ma-jorityofparticipants(n 571,35%)workedwith
stu-dentswith specialneeds(includingDHH)thatspent
part of the day in a ‘‘pull-out’’ setting. The second
most prevalent settingwas an inclusion (i.e., regular
educationonly)setting(n 5 30,15%).
Source of visual phonics training. Although ICLI
attempts to regulate how individuals are trained in
Figure 2 TypesofsettingswhererespondentsusedVisual Phonics.
Visual Phonics, we asked participants to identify the
rangeof contexts wheretheyreceived their training.
Thisquestionwasinachecklist format,with options
includingfrom‘‘PreserviceTeaching’’to‘‘Professional
Development’’ to ‘‘No Formal Training.’’ As part of
the dataanalysis process, we created a new variable,
‘‘Trainer’’from theresponses tothe‘‘Other’’option.
Notsurprisingly,themostprevalentsourceforVisual
Phonics training, by far, was a professional
develop-ment opportunity (n 5 170, 85%). The only other
widespread source was one’s colleagues (n 5 44,
22%), also an in-service resource. Only 5% of the
participants (n 5 10) indicated they were using it
butwerenotformallytrained.
Student characteristics. Participants described with whom they had used Visual Phonics, both during
thecurrent(2008–09)academicyearandinprevious
academic years. Data from the current academic
year and previous academic years were reasonably
similar.TeachersusedVisual Phonics primarilywith
students who were DHH and students that had
other disabilities (not including DHH). With less
frequency, teachers reported using Visual Phonics
withstudentswhowereEnglishLanguageLearners.
ThemajorityofteachersreportedusingVisual
Pho-nics with elementary-age students, which makes
sense because this is typically when students are
learningtoread.Amuchsmallernumberofteachers
useditwithmiddleschoolandhighschoolstudents.
Downloaded from
jdsde.oxfordjournals.org
Generally speaking this validates what is known
aboutthetargetpopulationfromwhom Visual
Pho-nics is most widely used. Additionally, it
demon-strates that its use is not exclusive to the DHH
population.
HowIsVisualPhonicsUsed?
Breadth of use. Curioustounderstandthebreadthof
use within a school environment, we asked
partici-pantswhoelseattheirschoolsiteusesVisual Phonics.
Slightlyoverhalf oftheparticipantsindicatedseveral
colleagues are also using Visual Phonics (n 5 108,
54%). A small percentage(n 5 36, 18%)worked in
asettingwhereVisual Phonics wasusedprogram-wide,
and only n 5 34 (17%) were alone in their Visual
Phonics use. The remainingparticipantschose‘‘other’’
or did not respond to this item (n 5 21, 11%).The
responsesdescribetheexperiencesofeachteacher
rela-tiveto his/her peers;therefore, teachersfromonesite
maybe reportinginformation relatedto the samesite.
Approximatelyhalfof theparticipantsmadetheir own
decision to use Visual Phonics with their students,
whereasroughly30%madethedecisionwithcolleagues
and20%indicateditwasanadministrativedecision.
Written symbols. Consistent with anecdotal reports
from trainers, less than half of the participants
reportedtheyusethewrittensymbolsthataccompany
Visual Phonics (n 579,40%).Participantsweregiven
theopportunity tocomment on thisquestion,which
yielded varied and opposing responses. Many use
them with upper-grade primary students after
stu-dents hadmastered the alphabet andsimple spelling
patterns. Others commented that the symbols were
useful for younger students as they were learning
sound/letterrelationships.Stillotherteachersreported
using the written symbols or markings that
accom-paniedotherprograms(e.g.,WilsonLanguage)instead
oftheVisual Phonics writtensymbols,eventhoughthey used the Visual Phonics hand cues. Several teachers
commented that the written symbols were confusing
tochildrenwhowerealsolearningthealphabet.
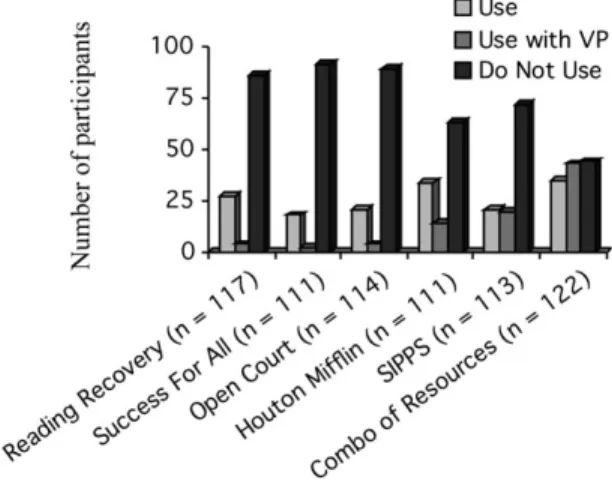
Reading curriculum and methods. Participants
pro-videdinformationaboutthekindsofreadingcurricula
andmethodstheyusedwiththeirstudents,bothwith
andwithout Visual Phonics.Forthequantitative
por-tion of this question, choices included Reading
Re-covery, Success for All, Open Court, Houghton
Mifflin for Reading, Systematic Instruction in
Pho-nemeAwareness,Phonics,andSightWords(SIPPS),
andaCombinationofResources(suchasExplodethe
CodeandReadingRockets).Foreachitem,participants
indicated whether they (a) used the curriculum/
method,(b) usedthe curriculum/methodwith Visual
Phonics, or (c) did not use the curriculum/method.
Figure3 provides a summary of the curricula by the
numberofparticipantswho respondedtothisportion
ofthequestion.Themostcommonlyreportedmethod
usedwas actuallythe Combination of Resources
cate-gory(29%usedthemaloneand35%usedwithVisual
Phonics).Thenexthighestcurriculumreportedoverall
wastheHoughtonMifflinforReadingseries,with31%
usingitaloneand13%usingwithVisual Phonics. Use
ofSIPPSwas evenly split betweenthosewho used it
without Visual Phonics (19%) and those who used it
with Visual Phonics (18%). It is surprising thatmore
popularandheavilybasedphonicsinstructional
meth-odssuchasthatReadingRecovery,SuccessforAll,and
Open Courtwere used very littlewith Visual Phonics
(3%,2%,and4%,respectively).
Over half of the participants wrote in responses
thateitherelaboratedupontheirchoicesoradded
in-formationtothequestion.Thoseresponseswere
cat-egorized according to whether the curriculum
identifiedwas ageneral educationcurriculum,
reme-dialcurriculum,orwhetheritwasareadingresource.
Downloaded from
jdsde.oxfordjournals.org
by guest on October 1, 2010
Althoughseveralcurriculaorresourceswereidentified
by more than one person, none exceeded even the
lowestchoicesinthequantitativesectionabove.Some
ofthemorefrequentlycitedgeneraleducation
curric-ulaincludedSRAReadingMastery,Harcourt(partof
Houghton-Mifflin), MacMillian-McGraw Hill
Read-ing, and Scott-Foresman. More specific information
relatedtotheparticularseriesofpublishersor
curric-ula was not obtained. Frequently identifiedremedial
curricula included Reading Milestones, Fundations
(Wilson Language Basics), and Language!. Avariety
of reading resources and materials were identified,
with noone source identifiedmore than others.
Re-gardless of thecurriculum or method used,teachers
self-report that they are using a variety of standard
curricula and methods to teach reading to their
DHHstudents.Thisfindingmaybepredictablegiven
the requirements of No Child Left Behind Act
(NCLB2001).NCLBmandatesthatreadingmaterials
mustincludethefiveessentialcomponentsofreading
instruction:phonemicawareness,phonics,vocabulary,
fluency, and comprehension. Reports from these
teachers are substantially different than what was
reported over 10 years ago in a national survey of
reading instruction for DHH students that found
whole-languageandReadingMilestonestobein
pre-dominate use (LaSasso & Mobley, 1997). Prior to
NCLB, when Reading Milestones and a
whole-language approach were inuse, phonemic awareness
andphonicswerenotrequired tobetaught.
Reading skills and visual phonics. Participants were
asked toidentifywhether theyuse Visual Phonics for
specific reading-related activities or skills including
teaching phonemic awareness, phonics, spelling, and
vocabulary.Althoughnotnecessarilyareading-related
skill, participants were also asked if they use Visual
Phonics for articulation practiceand speech
develop-ment. Figure 4 shows the relative usage for specific
skills. For DHH students, teachers indicated using
Visual Phonics foralltheaboveactivitieswiththe
ma-jorityofrespondentsindicatingtheyuseitforphonics
(n 5 134, 67%)and then spelling (n 5 136, 64%),
phonemic awareness (n 5 123, 61.5%), vocabulary
(n 5 100, 50%), and articulation (n 5 111, 55%).
Thetrendsweresimilarinuseforstudentswithother
Figure 4 SpecificskillstaughtusingVisual Phonics.
disabilitiesandEnglishLanguage Learners,although
therewerefewer total numberofresponses forthose
students.
WhyUseVisualPhonics?
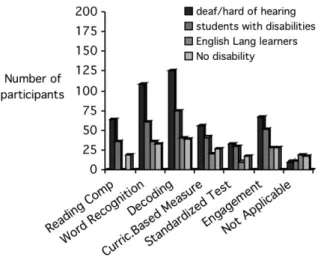
Evidence of effectiveness. We asked participants to
indicate how they knew if Visual Phonics was
effectivewiththeirdiversestudents.Optionsincluded
improvement on reading-related tasks (reading
comprehension, word recognition, decoding,
engage-ment in reading) and assessment measures
(curriculum-basedmeasures andstandardized
assess-ments). Participants were also given the option to
write-inresponses.
Asummaryofparticipant responsestothis
ques-tionis inFigure5.Sourcesofevidencefor
effective-nessappeartovaryacrossitems.Themostcommonly
citedsourceofevidenceisanimprovementinstudent
decodingcapabilities, particularly for DHH students
(n 5126,63%)andstudentswith disabilities(SWD)
(n 5 74, 37%).Participantsalso identified
improve-ment in word recognition tasks for DHH students
(n 5 108,54%)andforSWD (n 561,30.5%).
Per-hapssurprisingisthesimilarityinprevalenceof
read-ing comprehension and student engagement as
asourceofevidence,withsimilar distributionsacross
DHH,SWD,Englishlanguagelearners,andstudents
withoutdisabilities.Participantsindicatedassessments
less frequently asa source ofevidence for the
effec-tivenessofVisual Phonics;thisresult may notbenot
surprising given that many standardized assessments
Downloaded from
jdsde.oxfordjournals.org
Figure 5 Evidenceofeffectiveness.
are not developed for administration with DHH
learners. Anotherfinding waslessthana thirdofthe
participants noted performance on curriculum-based
measuresasasourceofevidenceforanytypeofstudent
withwhomtheyworked.Thisde-emphasison
curric-ulum-based measures is perhapstobeexpected inan
era with significant emphasis on standardized
assess-ment in measuring student proficiency in academic
subjects.Whenviewedfromanaccountability
perspec-tive, curriculum-based measures play a small role in
evaluationofeitherstudentperformanceortheefficacy
ofcurriculum models(Cawthon,2007).
Twenty-sevenparticipantswrote-inresponsesthat
were examinedfor recurring patternsor information
that differed from the responses identified above.
Eight participants specifically indicated they do not
feeltheyhavebeenusingVisual Phonics longenough
tosee improvement.This makes sense giventhe
de-mographic data reporting approximately half of the
participantshadonlyhad1–2yearsofexperiencewith
it. Two participants, both DHH teachers, indicated
specificallythattheyfeelVisual Phonics doesnot
ben-efitthestudentswith whomtheywork.Seven
partic-ipants wrote-in that they notice their students’
articulation (speech production) has improved with
theuseofVisual Phonics.Consistentwiththe
quanti-tativefindingsforthisquestion,improvementinsome
aspectofdecodingrecurredinthewrite-inresponses.
For example, one speech-language pathologist who
mentrelatedtotheuseofcurriculum-basedmeasures,
‘‘We use curriculum based measures for fluency,
e.g., timed repeated readings. These have improved
indirectly from visual phonics as a result of
improved decoding skills.’’ There were also several
recurrent comments related to improved spelling
skills.
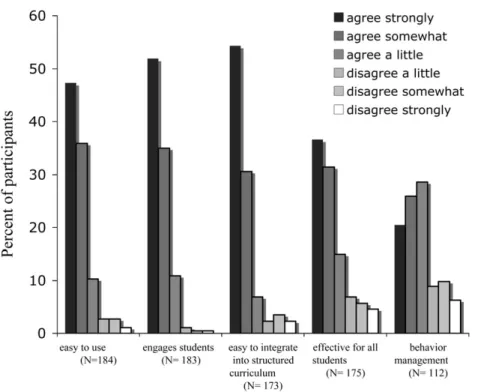
Perceptions of visual phonics. Also toaddressthewhy
question, both quantitative andqualitative questions
wereused to understand participants’perceptions of
using Visual Phonics. A set of quantitative questions
asked participants torate their perceptions ofVisual
Phonics asaninstructionalapproachwithinthree
cat-egories: aspects ofimplementation (e.g., easy touse,
helpswithclassroommanagement),outcomesfor
stu-dents(e.g., improves phonemicawarenessor student
achievementinother subjectareas),andapplicability
to student grade level (e.g., elementary vs. middle
grades).Participantsrateditemsonscaleof1to7that
allowed them varying degreesof agreement with the
itemsineach category(1 5 agreestrongly,6 5
dis-agree strongly, and 7 5 not applicable or unsure).
Figure6showstheratingsforaspectsof
implementa-tionintermsofpercentagesofagreement.Thereader
is cautioned when reviewing this figure as the total
number ofparticipants for each perception varies. A
combined83%oftheparticipantsagreed stronglyor
somewhat that Visual Phonics was easy to use as an
instructionalapproach,87%agreedstronglyor
some-what that it engaged students, and 84% agreed
stronglyor somewhatthat Visual Phonics waseasyto
integrate into a structured curriculum. Only 68%
agreedstrongly or somewhatthat itwaseffectivefor
all students andonly 46% agreed strongly or
some-what that it helpedwith classroom behavior. We
in-cluded ‘‘classroom behavior’’ as a potential response
categorybecauseanecdotallyVisual Phonics isreported
to be highly engaging. When students are engaged,
maladaptive classroom behaviors tend to be
mini-mized.We lookedspecificallyathowyears of
experi-ence (1–2 years or 31 years) with Visual Phonics
impacted perceptions and found onlyone significant
difference (M 5 1.93, M 5 1.57, respectively) in
aspects of implementation related to ease of use
Downloaded from
jdsde.oxfordjournals.org
by guest on October 1, 2010
Figure 6 Participants’perceptionsofimplementation.
(1–2 years) found Visual Phonics harder to use than
moreexperiencedusers.
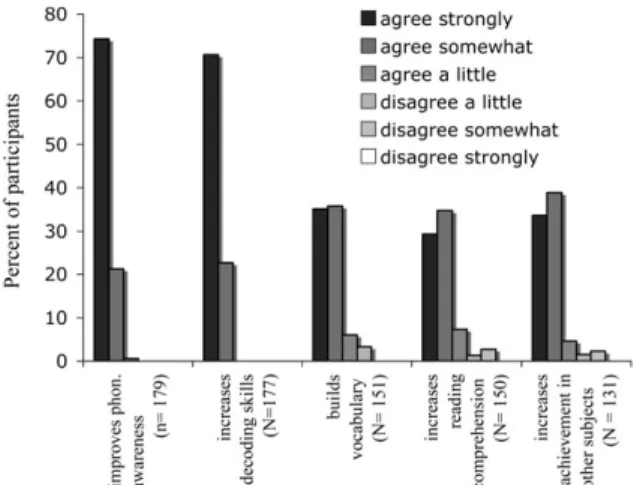
Figure7showsparticipants’perceptionsrelatedto
outcomes for students. Not surprisingly, 95% of
participants agreed strongly or somewhat thatVisual
Phonics improves phonemicawareness; however,here
againasignificantdifferencewasfoundbetween
nov-ice and more experienced users. The reader is
cau-tioned when reviewing this figure as the total
number ofparticipantsvaries acrosstheitems. More
experiencedusersagreedmorestronglythattheuseof
Visual Phonics helps improve phonemic awareness.
Ninety-three percent of the participants agreed
stronglyorsomewhatthatitincreasesdecodingskills.
Perhaps not immediately understood might be the
finding that71%agreedstronglyor somewhatthatit
iseffectiveinbuildingvocabulary.Vocabularylearning
andretentionseemstobea‘‘by-product’’oflearning
words phonemicallythrough Visual Phonics.Teachers
have reported this informally; however, there is no
empirical evidence that examines this specific aspect
of reading and word learning using Visual Phonics.
From a wider perspective, the relationship between
vocabulary knowledge andreading comprehension is
particularly pertinent here. Research with both
hearingchildren andDHHstudents clearlyindicates
thatabroadanddeepknowledgeofwords is
inextri-cably linked to reading comprehension (seeNational
Reading Panel, 2000; as well as Garrison, Long, & Dowaliby, 1997; Kelly, 1996). That noted, 64% of
these participants agreed strongly or somewhat that
students improve in their reading comprehension
skillswhenVisual Phonics isused.Curiously,alarger
percentageofteacherswith 3 or more yearsof
expe-rience agreed more strongly with this statement.
Seventy-two percent of the participants agreed
stronglyorsomewhatthatitincreasesstudent
achieve-mentinothersubjectareas.
Asexpected,amuchgreaterpercentageof
partic-ipants(94%)agreedstronglyorsomewhatthatVisual
Phonics wasmostappropriateforelementary age
stu-dents and 74% agreed strongly or somewhat it was
appropriatefor studentsinmiddleschool grades.On
the whole, participants were positive about the
per-ceived benefits of Visual Phonics for their teaching
practiceandtheirstudents,withverysmalldifferences
inthemeanratingsacrosscriteria.
Finally, we asked three open-ended questions
requesting participants to offer what they like most,
whattheyfindmostchallenging,andwhattheywould
Downloaded from
jdsde.oxfordjournals.org
Figure 7 Perceivedoutcomesforstudents.
change about Visual Phonics. What do you like most
about Visual Phonics? Eight-twopercent (n 5163)of
the participants wrote in responses to this question.
Throughout the analysis it was clear that many
responses containedelements that fit into more than
one category. Seven well-defined categories emerged
fromresponses.Overwhelmingly,thelargestcategory
(50%, n 5 82) pertained to appreciating the purpose
andfunctionalityofVisual Phonics.Forexample,
. ithelpsmy studentslearn decodingskillsand
improve with word recognition. It is a tool that
can be incorporated with an existing literacy
curriculum.
Ilovethatmystudentsareabletoincreasespelling
accuracy, decode more fluently, manipulate
pho-nemes, and understand the concept of
sound-to-printratio.
Thevisual nature ofVisual Phonics wasanelement
of 20% (n 5 33) of the comments. Making sounds
visible, allowing DHH children to see what hearing
childrenheardefinedthegeneralsentimentwithinthis
category.Lessfrequentlyemergingcategoriesforwhy
teachersuseVisual Phonics includedit’s easy (11.5%),
it’s tactile (9%), it’s engaging (8%), it’s fexible (6%), andit’s multi-modal (5%).Commentsbaseduponthe
perceptualreasonsforusingVisual Phonics accounted
for a combined 34% of the comments (it’s visual,
tactile, and multimodal). The remaining categories
(easy, engaging, and flexible) were also addressed as
a distinct question within the survey (seeFigure 5),
which may explain why these particular themes
emergedlessfrequently asgeneralcomments.
Wealsoaskedparticipants:What do you fnd
chal-lenging about Visual Phonics? Seventy-four percent
(n 5 149) of the participants responded to this
question. Although some responses did fit multiple
categories, most responses were distinct in their
meaning.Ninecategoriesinitiallyemergedfromthese
responses; however, four of the categories had less
than 5% of comments. By far the most frequently
occurring comments (33%) related to the use or
implementationofVisual Phonics.Forexample,
What to do when a student may rely on Visual
Phonics toomuchwiththeirdecoding...
encour-agingthem toexpandpasttheirdecodingand
be-comemore automatic.Fluencybecomes anissue.
Using visual phonics becomes challenging when
you, the teacher, are unsure of what the sound
shouldbeorwhattheblendis.
Sometimes thepace ofa mainstreamclassroomis
challengingtodemonstrate thesounds asquickly
astheyarepresented.Ifindthatslowingdownand
not trying to present so much material is better
thandoingitbadly—qualityisbetterthanquantity.
Learning and remembering the hand cues and/or
writtensymbolsaccountedfor26%ofthecomments.
The time involved in integrating Visual Phonics into
instructionwasthethirdmostfrequentcomment,
ac-countingfor10%oftheresponses.Forexample,
Having enough time to teach& practice using it
with students asI’dlike to—too manythingswe
havetocraminto ourshortsessions!
Theamountofmaterialthatneedstobetaughtat
2ndgrademakesitdifficulttofitthisin.Itisvital
for students whohave not had thistraining, and
whoarrive at our programwith a deficit in
pho-nemicawareness.Forthemitisagood,fun catch
uptoolthatcanbridgegaps intheirlearning and
helpwithspelling,decodingandlisteningskills.’’
Isolation wasanotherrecurrenttheme(6%),likely
inoccurrencewiththe17%ofparticipantsthatarethe
onlyonesusingitattheirsite.Confusion withorlack
Downloaded from
jdsde.oxfordjournals.org
ofuse ofthewrittensymbols wasadistinct category
(6%)thatdifferedsignificantlyfromcommentsrelated
to‘‘remembering’’thesymbols.Oneparticipant
com-mented,‘‘Studentslearningthewrittencode.Someof
the symbols are very similar and the children get
confused.’’
Theother categoriesthat accountedfor less than
5% of the comments individuallywere thoughts
re-lated to how instruction with Visual Phonics can be
linked to vocabulary(3%, i.e.,‘‘A childmay beable
toblendthesyllablestogethertocorrectly pronounce
aword, buttheword stilllacks meaning.’’);
prepara-tionofmaterials(3%);consistencyinuse(2%,i.e.,‘‘I
findthatitischallengingtomakesurethatallofthe
teachers are giving the same directions on the hand
cues.’’), andgeneralconfusion notspecifically related
tothecuesor symbols(2%).
Thelastquestionrelatedtodesiredchangeabout
thetool:What would you change about Visual Phonics?
Sixty-sixpercent(n 5133)ofthesurveyparticipants
wrote in responses to this question. Six categories
were identified from these comments. The largest
categoryofwrittenresponses(28%)specified
partici-pantswouldnotchangeanythingaboutVisual Phonics.
Thenextmostfrequentlyoccurringresponses (24%)
related to changes with the written symbols and/or
hand cues.Forexample,
Convert thesymbols tostandard phonemic
sym-bolssothatcarryovertodictionaryuseand
main-streamingsituationsiseasier.
Ihavealreadyaddedmy ownsymbols and
hand-shapes for r-controlled vowels such as /or/ and
/ar/. Also,I wouldalso addanother component
intheprogram that dealsexplicitly withspelling
patternse.g.long/a/canbespelledlike/ai/,/ay/,
/a___e/,etc.
Thesecommentsmakesensegiventhatmany
par-ticipantsalsocommentedthatsomeaspectofthecues
or symbolschallengedthem.
Changesoradditions ofcurriculumandmaterials
to accompany Visual Phonics accounted for 16% of
thesecomments. Forexample,
Ithinkthetrainingshouldfocusmoreonvarying
waystousetheprogram.Iuseitmostlyfor
spell-ing purposes taking a ‘‘back door’’ approach to
transferring spelling into reading and decoding
skills.
Haveavideoorsomethingtoshowmyinterpreters
whodon’t know theprogram—maybea modified
shorttrainingforinterpreterstojustteach
hand-shapes andnot really allthe ‘teacher’partof the
training.
I agree ithelps with improvingphonemic
aware-ness anddecodingskills,but stillneedstobe
in-corporatedwithotherresources.Ipersonallythink
morematerialsneedtobeprovidedinusingvisual
phonicsandmoretraining.
Nine percent of the comments written-in stated
theparticipants ‘‘didn’t know’’ what they would like
tochange.Thisisnotsurprisingbecausealittlemore
than half of the participants had been using Visual
Phonics for less than 2 years. Other less frequently
occurringcategoriesincludedchangesrelatedto
want-ingmoreworkshopsforextendingandbuildingupon
itsuse (7%, i.e.,‘‘I wouldliketotake thenextclass
developing lesson plans to use in the classroom to
integrate in my curriculum.’’) and wanting more
peopletouse it attheirsite for greater collaboration
(4%).
Discussion
Significance
Understanding and describing teachers’ reading
in-structional practicesanddocumenting perceived
effi-cacyisanecessarypartofaddressingthe
research-to-practicegapthatexistsineducation. Schirmer(2001)
callsonresearcherstolookatwhatteachersaredoing
intheirclassroomstogaininsightintostrategies
wor-thyofresearch,inadditiontowonderingwhyteachers
do not implement evidence-based practices. In this
study, teachers self-reported their practices and
reflectedupon theefficacyofthose practices,
specifi-cally related to reading instruction and the use of
Visual Phonics. Their responses and reflections
provideinsightintomotivationstouseVisual Phonics,
aswellasbarrierstoits consistentuse.Although the
empirical base examining Visual Phonics is growing,
littleis knownabout how andwhy teacherspersist in
Downloaded from
jdsde.oxfordjournals.org
usingitwithDHHandotherlearners.Thisinquiryis
afirststeptoward addressingthesequestions.
Teachers’ instructional strategies for teaching
reading have also largely omitted curricula that are
heavily phonics based. Teachers reported here that
theyareusingavarietyofreading curricula,in
addi-tiontovarious resources andmaterialstoteach
com-plex reading skills. Although the focus of thispaper
wason DHH students, valuable information gleaned
includes teacherreports of usingVisual Phonics with
diverse students (students with disabilities, English
Language Learners, and those who are struggling
readersbutwerenotidentifiedwith adisability).
In addition, there ismountingevidence that
sug-gests DHH learners can benefit from some kind of
understanding and interaction with the alphabetic
principleiftheyaretolearnhow to‘‘crackthecode’’
andbecomesuccessfulreaders.Visual Phonics isatool
thatutilizes thestrengths ofDHHstudentsasvisual
learners and provides this unique information in
a completely accessible way. Using Visual Phonics,
teachersandDHHstudentsarenotrequiredtoproduce
spokenlanguagetodemonstratephonemicawarenessor
thealphabeticprinciple.Outcomesfromthisstudy
sug-gestthatalthoughthepotentialforusingVisual Phonics
isstrong,teachersstrugglewithhowtobestimplement
itandincorporateitintotheirreadinginstruction.
Asatool,Visual Phonics isusedtosupportexisting
curriculaandresources.Asidefromthehandcuesand
graphemes(thesystemitself),therearenoguidelines
or ‘‘best practices’’ that are associated with its use.
Muchof theintegration anduse ofVisual Phonics is
left to be determined by the creative teacher who
reflects thoughtfully on how best to infuse it into
herinstruction.Asshowninthisstudy,teachers
strug-glewith thisadaptive process.Theywouldlikemore
workshopsandguidanceabouthowtouseVisual
Pho-nics most effectively. More fundamentally, they
struggle with completely learning the system and
using it accuratelyafter exposurethrough a training
seminar. Teachers indicated that ‘‘refresher’’ videos,
more workshops on implementation, and additional
resourceswouldbehelpful.
Despite the fact that teachers have used Visual
Phonics for over 20 years, there are limited
publica-tions describing how and why teachers gravitate
to-ward its use. Within Deaf Education, anecdotal
evidence and word-of-mouth have perpetuated its
use and propagated increased interest. From this
study, it seems clear that further investigation is
es-sential to better understand how teachers are using
Visual Phonics in their day-to-day instructional
rou-tinesby validatingtheirself-reported practices.
Lon-gitudinal information will also provide valuable
insights if teachers continue to use Visual Phonics
andgainexperienceinimplementationandsee
stron-geroutcomes fortheirstudents.
Limitations
Thereare a number oflimitations to thisstudy that
impactthegeneralizablityandreliabilityofitsfindings.
Thesample of participantswasskewed toward those
whohadusedVisual Phonics foronlyafewyears.Itis
possible that more advanced users of Visual Phonics
wouldhavedifferentperspectives(thoughadhoc
anal-ysesofthisrelationshipprovednottoshowsignificant
differencesinteacherresponses,withtheexceptionof
easeofusewherenoviceusersperceiveditasharderto
use). Second, there were some items that had high
levelsofmissingdata,callingintoquestionthematch
betweentheintentofthesurveyandtheexperiences
ofVisual Phonics users.Themostsignificantlimitation
relatedtoreliabilityisthatthesurveywasaself-report
measure of teacher experiences with Visual Phonics.
Althoughthesurvey waspiloted andrevisedinlight
ofparticipant feedback,the design did not allow for
afollow-uponhowteachersinterpretedtheitemsorif
they would have answered them differently if the
itemshadbeenphrasedinanother way.Itis possible
thatwordingregarding‘‘effectiveness’’ofVisual
Pho-nics,for example, tookon differentmeaning
depend-ingonthe teacher’scontext. Items alsovaried inthe
extenttowhichtheyarepotentiallyverifiable.For
ex-ample, items related to teacher perspectives are not
directly observable, whereas items that focused on
teacherpracticescouldbematched againstclassroom
implementationofVisual Phonics.
Anotherlimitationincludesmorespecific
informa-tiondescribingthestudentpopulation.Characteristics
ofthestudentssuch ashearinglevels, family
charac-teristics,andprimarylanguageusewerenotgathered.
Downloaded from
jdsde.oxfordjournals.org
Therewas an additionallack of specificityrelated to
the categorization of students with disabilities.
Al-though we wanted to know whether teachers were
using Visual Phonics with a variety of students, we
did not requestinformation about the nature of the
students’themselvesoranyuniquedisabilities.
Continuedresearchinthisareais requiredto
val-idate and expand upon the current findings.
Subse-quent surveys with increased response rates and
focused systematic classroom observation data that
investigates teachers’ instructional methodswill
pro-videvaliditydata.Expandedinvestigationintostudent
characteristics couldalsoyielda more definedprofile
of thekinds of students that may benefit most from
instructionusingVisual Phonics.
Conficts of Interest
The first author is a See-the-Sound/Visual Phonics
trainer licensed by ICLI, the proprietors of Visual
Phonics. No monetary compensation from ICLI is
receivedinherroleasatrainer,norwasanymonetary
compensationreceivedasapartofthisstudy.
References
Allen, T. E., Clark, M. D., del Guidice, A., Koo, D., Lieberman, A., Mayberry, R., et al. (2009). Phonology and reading: A response to Wang, Trezek, Luckner, and Paul. American Annals of the Deaf, 154, 338–345.
Cawthon, S. (2007). Hidden benefits and unintended conse-quences of No Child Left Behind polices for students who are deaf or hard of hearing. American Educational Research Journal, 44, 460–492.
Chamberlain, C.,&Mayberry, R.(2008).Americansign lan-guagesyntacticandnarrativecomprehensioninskilledand lessskilledreaders:Bilingualandbimodalevidenceforthe linguistic basis for reading. Applied Psycholinguistics, 29, 367–388.
Cummins, J. (2006). The relationship between American sign language profciency and English academic develop-ment: A review of the research. Unpublished paper for theOntario Associationofthe Deaf,Toronto,Ontario, Canada.
Garrison, W., Long, G., & Dowaliby, F. (1997). Working memory capacity and comprehension processes in deaf
readers. Journal of Deaf Studies and Deaf Education, 2, 78–94.
Kelly,L.P.(1996).Theinteractionofsyntacticcompetenceand vocabularyduringreadingbydeafstudents.Journal of Deaf Studies and Deaf Education, 1, 75–90.
LaSasso, C. J., & Mobley, R. T. (1997). National survey of reading instruction for deaf or hard-of-hearing students intheU.S.Volta Review, 99, 31–58.
Luckner,J.L.,Sebald,A.N.,Cooney,J.,Young,J.,&Muir,S. (2005/2006).Anexaminationoftheevidence-basedliteracy research indeaf education. American Annals of the Deaf, 150, 443–456.
Mayer,C.(2007).Whatreallymattersintheearlyliteracy de-velopment of deaf children? Journal of Deaf Studies and Deaf Education, 12, 411–431.
Musselman,C.(2000).Howdochildrenwhocan’thearlearnto read an alphabetic script? A review of the literature on reading and deafness. Journal of Deaf Studies and Deaf Education, 5, 9–31.
Narr, R. F. (2008). Phonological awareness and decoding indeaf/hardof hearingstudentswhouseVisual Phonics. Journal of Deaf Studies and Deaf Education, 13, 405–416.
NationalReadingPanel.(2000).ReportoftheNationalReading Panel.Teachingchildrentoread:Anevidence-based assess-mentofthescientificresearchliteratureonreadingandits implicationsforreadinginstruction.Washington,DC:U.S. DepartmentofHealthandHumanServices.
NoChild LeftBehind Actof 2001,20 U.S.C.§6301et seq (2002).
Schirmer, B. R. (2001). Using research to improve literacy practiceandpracticetoimproveliteracyresearch.Journal of Deaf Studies and Deaf Education, 6, 83–91.
Schirmer,B.R.,&McGough,S.M.(2005).Teachingreading to children who are deaf: Do the conclusions of the National Reading Panel apply? Review of Educational Research, 75, 83–117.
Trezek, B. J., & Malmgren, K. W. (2005). The efficacy of utilizinga phonicstreatmentpackage with middleschool deafandhardofhearingstudents.Journal of Deaf Studies and Deaf Education, 10, 256–271.
Trezek, B. J., & Wang, Y. (2006). Implications of utilizing a phonics-based reading curriculum with children who aredeaforhardofhearing.Journal of Deaf Studies and Deaf Education, 11, 202–213.
Trezek,B.J.,Wang,Y.,Woods,D.G.,Gampp,T.L.,&Paul, P.V.(2007).UsingVisual Phonics tosupplementbeginning reading instruction for students who are deaf/hard of hearing. Journal of Deaf Studies and Deaf Education, 12, 373–384.
Wang,Y.,Trezek,B.J.,Luckner,J.,&Paul,P.V.(2008).The roleofphonologyandphonologicallyrelatedskillsin read-inginstructionforstudentswhoaredeaforhardofhearing. American Annals of the Deaf, 153, 396–407.
Downloaded from
jdsde.oxfordjournals.org