DigitalCommons@University of Nebraska - Lincoln
Community and Regional Planning Program:
Professional Projects Community and Regional Planning Program
Summer 7-17-2018
Analyzing the Impact of Incentive Programs on
Retention of Family Practice Providers in Rural
Nebraska
Andrew J. Pedley
University of Nebraska-Lincoln, [email protected]
Follow this and additional works at:http://digitalcommons.unl.edu/arch_crp_profproj Part of theUrban, Community and Regional Planning Commons
This Article is brought to you for free and open access by the Community and Regional Planning Program at DigitalCommons@University of Nebraska - Lincoln. It has been accepted for inclusion in Community and Regional Planning Program: Professional Projects by an authorized administrator of DigitalCommons@University of Nebraska - Lincoln.
Pedley, Andrew J., "Analyzing the Impact of Incentive Programs on Retention of Family Practice Providers in Rural Nebraska" (2018). Community and Regional Planning Program: Professional Projects. 14.
Analyzing the Impact of Incentive Programs on Retention of Family Practice Providers in Rural Nebraska
By
Andrew J. Pedley
A PROFESSIONAL PROJECT
Presented to the Faculty of
The Graduate College of the University of Nebraska In Partial Fulfillment of Requirements
For the Degree of Master of Community and Regional Planning
Under the Supervision of Professor Yunwoo Nam
Lincoln, Nebraska
Analyzing the Impact of Incentive Programs on Retention of Family Practice Providers
in Rural Nebraska
Andrew J. Pedley M.C.R.P
Advisor, Yunwoo Nam
Abstract
Rural populations in Nebraska are generally older, less affluent and suffer from more chronic diseases than their urban counterparts. To address these disparities, the Nebraska Department of Health and Human Services Office of Rural Health oversees incentive programs that compensate providers for costs associated with education in exchange for time worked in shortage areas. This report examines the impact that these incentive programs have on the retention of family medicine providers in Nebraska using survival analysis methodologies. The findings of this report indicate a positive correlation
between participation in incentive programs and workforce retention of family medicine providers.
Acknowledgements
Thank you to Tom Rauner, Yunwoo Nam, Gordon Scholz, Daniel Piatkowski, Rodrigo Cantarero, Marlene Deras, and Donald Pathman for your guidance in this project.
Table of Contents
Table of Contents i
Table of Figures iii
Table of Tables iv
Table of abbreviations and acronyms v
Chapter 1 Introduction 1
1.1 Primary Care in Nebraska 6
1.2 What Is Rural? 7
1.2.1 United States Census Bureau 8
1.2.2 Office of Management and Budget (OMB) 10
1.2.3 Rural-Urban Commuting Area (RUCA) 11
1.3 Healthcare Delivery in Rural Nebraska 14
1.4 Incentive Programs 15
1.4.1 Nebraska Student Loan 18
1.4.2 Nebraska Loan Repayment 21
1.4.3 NHSC Loan Repayment 22
1.4.5 NHSC SLRP 26
1.5 Previous Retention Studies 26
Chapter 2 Data 33
Chapter 3 Methods 35
3.1 Data Cleaning and Organization 35
3.2 Data Analysis 38 Chapter 4 Results 43 Chapter 5 Discussion 54 Chapter 6 Conclusion 61 Appendix 1 63 Bibliography 64
Table of Figures
Figure 1.1 Non-metropolitan vs metropolitan Life Expectancy 2
Figure 1.2 US Rural Counties Map 4
Figure 1.3 NE Active Family Medicine Providers 7
Figure 1.4 NE Percentage of Persons Living in Urban Areas 9
Figure 1.5 NE Office of Management and Budged Map 11
Figure 1.6 NE RUCA Census Tract Map 14
Figure 1.7 Relative Distribution of Incentive Programs 17
Figure 1.8 NE State Designated Family Practice Shortage Map 20
Figure 1.9 NE Federal Primary Care HPSA Map 24
Figure 4.1 Program Awards by Year 47
Figure 4.2 Kaplan Meier Survival Curves 49
Figure 4.3 Log Minus Log Plots 53
Table of Tables
Table 1.1 US Rural Mortality Rates 2
Table 1.2 RUCA Code Classifications 13
Table 1.3 Incentive Programs by Rurality 16
Table 1.4 Incentive Program Comparison 18
Table 4.1 Gender and Incentive Program Participation 43
Table 4.2 Mean Retention Times by Program 46
Table 4.3 Kaplan-Meier Chi-squared Results 48
Table of Abbreviations and Acronyms
APRN Advanced Practice Registered Nurse
CPH Cox Proportional Hazards
DHHS Department of Health and Human Services
GIS Geographic Information Systems
HPSA Health Professional Shortage Area
HPTS Health Professions Tracking Service
HRSA Health Resources Services Administration
MD Medical Doctor
NHSC National Health Service Corps
NHSC SLRP National Health Service Corps Student Loan Repayment
OMB Office of Management and Budget
PA Physician Assistant
POC Primary Care Office
RUCA Rural Urban Commuting Area
UA Urban Area
UC Urban Cluster
Chapter 1 Introduction
Individuals living in rural areas experience significant disparities in health
outcomes compared to urban dwellers. Rural populations are generally older, poorer, and have lower life expectancies than urban populations (Singh, 2014). They also have higher incidents of death from chronic disease like cancer, heart disease, and Chronic
Obstructive Pulmonary Disease (COPD), and they experience more workplace injuries, accidental death, and traffic deaths than their urban counterparts (Moy, et al., 2017) (Meit, et al., 2014). Figure 1.1 shows the disparities between life expectancy for
metropolitan and non-metropolitan residents in the United States. For the population as a whole and for most demographic groups, the life expectancy for metropolitan residents is around 2 years longer than for non-metropolitan residents. The demographic group that shows the largest disparity between metropolitan and non-metropolitan residents is Native Americans with metropolitan residents expected to live 11 years longer than their non-metropolitan counterparts.
Table 1.1 shows additional evidence of disparities between metropolitan and non-metropolitan residents. In each of the causes of death listed in table 1.1, non-non-metropolitan residents experience mortality at higher rates than metropolitan residents. The causes of these disparities are extremely complex, often nuanced, and are influenced by a
combination of factors which include demographics, geography, social and cultural norms, and economic conditions. These factors work in concert to effect both the supply of healthcare providers in rural areas and the level of access that rural residents have to healthcare services.
Figure 1.1 United States non-metropolitan vs. metropolitan life expectancy.
Table 1.1 United States metropolitan and non-metropolitan mortality rates per 100,000 population per year
Non-metropolitan Counties Metropolitan Counties With a city ≥ 10,000 Population Without a city ≥ 10,000 population Large central Large fringe Small Infant mortality 6.8 7 6.8 5.7 6.7 COPD 79.9 81.9 56.2 60.6 70.9 Ischemic heart disease 197.2 206.5 192.9 174.9 173.8 Unintentional injuries 58.9 52.7 32.1 33.1 40.8 Motor vehicle traffic-related injuries 23.3 19.5 7.9 9.3 12.1 Suicide 18.2 20 12.8 13.7 16.1
According to the 2010 United States Census, the estimated number of individuals living in rural areas within the continental US was 59,140,989 which makes up 19.3% of the total United States population. Counties within the continental United States that have fewer than 50% of their residents living in urban areas, make up a total land area of 1,640,080 square miles which amounts to 53.9% of land area in the lower 48 states (U.S. Census Bureau, 2010). Figure 1.2 shows a map of US counties based on the percentage of population living in urban areas. It is important to note that while rural counties make up over 50% of US land area, less than 20% of the US population lives in these counties resulting in an extremely low population density as compared to more urban counties.
This low population density makes it difficult for rural healthcare facilities to be sustainable due to low patient volumes. In addition, the relative isolation of rural areas poses additional challenges in recruiting healthcare providers, as it is often difficult for providers to develop social networks, rural areas generally have fewer amenities, and there are fewer employment opportunities for spouses.
In order to address these disparities, public health officials as well as state and federal governments, have developed programs and policies intended to recruit healthcare providers to work in rural areas. In Nebraska, there are state and federal student loan, loan repayment, and scholarship programs intended to create incentives for healthcare providers to work in healthcare shortage areas. In addition, several academic institutions within the state actively recruit rural high school students through training track programs under the assumption that providers who grow up in rural areas are well suited to work in rural areas after they have completed training.
Figure 1.2 United States counties by percent of population living in urban areas in 2010.
One important piece of the rural healthcare puzzle is the retention of healthcare providers once they decide to work in a rural area. While some workforce turnover is necessary and allows for new ideas and innovation, the retention of a well-trained workforce is essential to the provision of quality healthcare services (Meier & Hicklin, 2008).
This report has been created for the Nebraska Department of Health and Human Services (DHHS), Office of Rural Health to address the retention of family medicine providers in Nebraska from January 1, 1998 to January 1, 2018. The purpose of this project is to determine if participation in incentive programs effects the retention of
family medicine providers in Nebraska. The analysis in this report compares length of retention for all family medicine providers in that practiced in the state from 1998 to 2018, based on their participation in incentive programs. This comparison is made for five unique groups depending on level of rurality with a primary focus on providers that have worked in small town and rural areas.
By analyzing the length of time and locations worked by these healthcare providers, insight is gained regarding the effectiveness of the state and federal incentive programs not only on recruitment of providers but also on their retention. This research provides significant additions to the existing body of workforce retention research specifically for rural medical providers, as there appear to be no published studies that focus on the impact of incentive programs on retention.
Retention of rural healthcare providers is important not only from a healthcare delivery perspective, but also from an economic standpoint. The National Center for Rural Health Works published a report in 2016 that used Impact Analysis for Planning (IMPLAN) to estimate the total economic impact of primary care physicians in rural areas (Eilrich, Doeksen, & St. Clair, 2016). This study found that, on average, a rural primary care physician creates 26.3 local jobs and nearly $1.4 million annually in income. The report finds that in many rural areas, between 10 and 15 percent of all jobs are in the healthcare industry, second only to local school systems. It is because of this significant impact on communities that it is important to study the retention of healthcare providers in these areas. The results from data analysis used in this project can help rural health policy makers and healthcare administrators make more informed decisions that
can lead to greater provider retention and therefore improved healthcare access and economic vitality.
1.1 Primary Care in Nebraska
The majority of the local healthcare services in rural areas are provided by primary care specialists. This category of providers includes medical doctors (MDs), doctors of osteopathy (DOs), physician assistants (PAs), and nurse practitioners (APRNs) that specialize family medicine, internal medicine, pediatrics, obstetrics, gynecology, or geriatrics. The most prevalent off these specialties is family medicine. According to a 2017 internal report from the University of Nebraska Medical Center’s (UNMC) Health Professions Tracking Service (HPTS), 51.1% of all full time equivalent (FTE) hours worked by primary care physicians practicing in state designated shortage areas, can be attributed to family medicine providers. For this reason and to insure a manageable sized dataset, this project has focused only on family practice providers in the state of
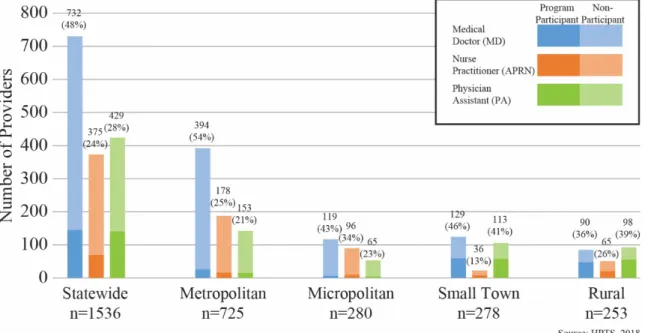
Nebraska. Figure 1.3 shows the distribution all family medicine providers actively practicing as of January 1, 2018 based on profession, rurality, and participation in
incentive program. MDs made up 48% of all active family medicine providers statewide, ARPNs made up 24% and PAs made up 28%. Using rural-urban commuting area
(RUCA) codes to define levels of rurality, it was found that the majority of providers (725) worked in metropolitan areas while micropolitan, small town and rural areas each had between 250 and 280 providers. In small town and rural areas, a larger proportion of providers participated in incentive programs than in metropolitan and micropolitan areas.
This is due in large part to the availability of qualifying practice locations at the rural and small town level.
Figure 1.3 Family medicine providers actively practicing in Nebraska as of January 1, 2018, as described by profession and program participation.
1.2 What Is Rural?
Due to the disparities in health outcomes between urban and rural residents, this report has placed specific emphasis on family medicine providers practicing in rural and small town areas. The term rural is inexact and has differing definitions depending on spatial scale, intensity of development, and population density of an area. However, rural generally refers to areas with populations living outside of high density metropolitan
regions. Three common definitions of rural that are used by government agencies include the US Census Bureau classification, the Federal Office of Management and Budget (OMB) classification, and the Rural-Urban Commuting Area (RUCA) classification. Other variations of these definitions are used from time to time depending on the type of analysis being presented.
Each of these classifications represent similar populations but are presented at different spatial scales. Therefore, it is important to understand that population, land area and other one-to-one comparisons between rural and urban populations should be done using a consistent definition of rurality. For example, if comparing the population of a rural area from one year to another, it would be important to use the same definition of rural for both years. However, generally speaking, health outcome, healthcare access, demographic and socio-economic trends remain relatively consistent across all rural definitions. Therefore, the rural-urban health outcome disparities discussed in this report tend to hold true regardless of how rurality is defined. This section explains how levels are of rurality are determined using three common classification schemes.
1.2.1 United States Census Bureau
The U.S. Census Bureau defines rural as all areas not considered an Urbanized Area (UA) or Urban Cluster (UC). Urban Areas are groups of census blocks with 50,000 or more people. A UA must also contain a core of contiguous blocks that have a
population density greater than 1,000 persons per square mile. UCs have lower density and are made up of groups of census blocks with total populations between 2,500 and
50,000 people. These classifications are based on block level geographies and are available from the US Census Bureau as a statewide dataset presented by census tract (Ratcliffe, Burd, Holder, & Fields, 2016). Figure 1.4 shows the proportion of the population in each Nebraska census tract that is identified by the 2010 US Census as living in an urban census block. It can be seen in figure 1.4 that the vast majority of census tracts in Nebraska and be considered rural, meaning that they have between 0% and 25% of their populations living urban areas.
1.2.2 Office of Management and Budget (OMB)
The federal Office of Management and Budget (OMB) classifies counties as metropolitan or micropolitan. While OMB classifications are based on U.S. Census urban and rural designations, OMB and US Census Bureau designations are not interchangeable because they represent different spatial areas. For OMB classifications, counties
containing one or more UAs, as well as outlying counties economically tied to the central or core counties, are classified as metropolitan. Micropolitan counties are non-metro counties with an urban cluster of at least 10,000 persons or more. As with metropolitan counties, connected counties that are economically tied are also classified as
micropolitan. Economically connected counties are those counties close to a central county that either contribute 25% or more of their commuters to the central county or 25% or more of their employment is generated in the central county (Office of Management and Budget, 2010). Figure 1.5 shows Nebraska counties based on their OMB metropolitan classification. With the exception of Alliance and McCook, all of the cities in Nebraska with a population over 8,000 are in either metropolitan or micropolitan areas.
Figure 1.5 OMB definition of metropolitan and micropolitan counties in Nebraska
1.2.3 Rural-Urban Commuting Area (RUCA)
RUCA classifications are used to delineate sub-county components of rural and urban areas at a zip-code or census tract level.. Current RUCA classifications for census tracts are based on 2010 Census data, as well as daily commuting patterns collected from the 2006-2010 American Community Survey. The classification scheme contains 10 primary and 21 secondary codes that can be further subdivided into smaller
classifications.
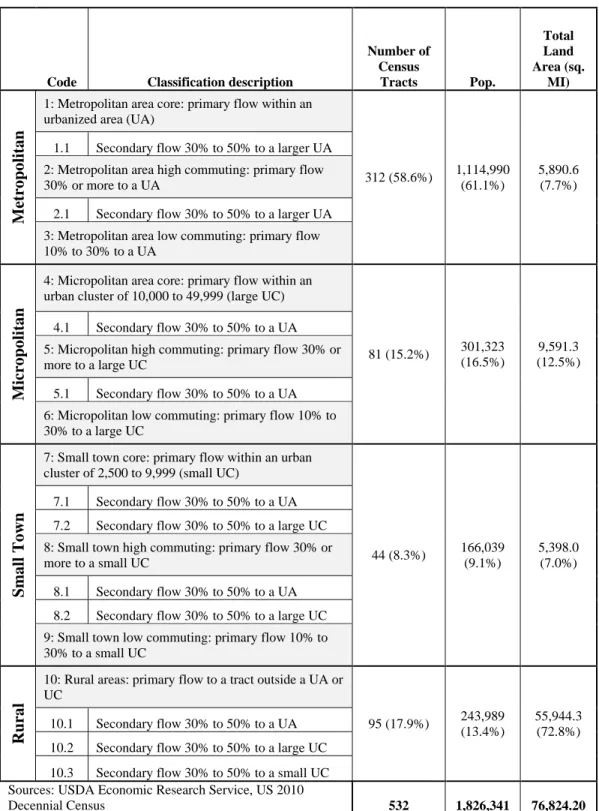
This project uses a four-level classification system that separates Nebraska census tracts into metropolitan, micropolitan, small town, and rural classifications. Metropolitan areas represent “Urban Area” (UA) census tracts and the tracts supporting them.
economically tied to UAs. Small town areas are associated with small UCs. These areas can also consist of census tracts that support UAs; however, small town census tracts are less closely associated with UAs than micropolitan tracts. Rural areas are those that have the least association with UAs and UCs. Table 1.2 lists the characteristics of each rurality classification used for this study.
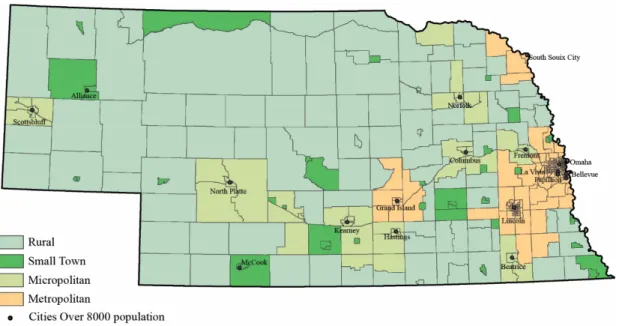
Figure 1.6 depicts Nebraska census tracts classified using RUCA criteria. The RUCA classification scheme was developed in part by the United States Department of Agriculture (USDA) and the WWAMI Regional Medical Education Program, a medical partnership with between Washington, Wyoming, Alaska, Montana, and Idaho. The WWAMI Medical Education Program focus heavily on rural healthcare, education, and delivery. Because the RUCA classification scheme provides an intuitive, and evenly distributed way to classify rurality in Nebraska, census tract RUCA designations were used to determine rurality for this project (WWAMI Rural Health Research Center, 2017) (USDA Economic Research Service, 2018). As with the OMB classification scheme, all of the Nebraska cities with population over 8,000 with the exception of Alliance and McCook (small town), are either in metropolitan or micropolitan levels of rurality.
Table 1.2 RUCA code classification scheme, the population, and the land area for each level of rurality in Nebraska, 2010.
Code Classification description
Number of Census Tracts Pop. Total Land Area (sq. MI) Me tr o po lit a n
1: Metropolitan area core: primary flow within an urbanized area (UA)
312 (58.6%) 1,114,990 (61.1%)
5,890.6 (7.7%) 1.1 Secondary flow 30% to 50% to a larger UA
2: Metropolitan area high commuting: primary flow 30% or more to a UA
2.1 Secondary flow 30% to 50% to a larger UA 3: Metropolitan area low commuting: primary flow 10% to 30% to a UA Mic ro po lit a n
4: Micropolitan area core: primary flow within an urban cluster of 10,000 to 49,999 (large UC)
81 (15.2%) 301,323 (16.5%)
9,591.3 (12.5%) 4.1 Secondary flow 30% to 50% to a UA
5: Micropolitan high commuting: primary flow 30% or more to a large UC
5.1 Secondary flow 30% to 50% to a UA 6: Micropolitan low commuting: primary flow 10% to 30% to a large UC Sm a ll T o w n
7: Small town core: primary flow within an urban cluster of 2,500 to 9,999 (small UC)
44 (8.3%) 166,039 (9.1%)
5,398.0 (7.0%) 7.1 Secondary flow 30% to 50% to a UA
7.2 Secondary flow 30% to 50% to a large UC 8: Small town high commuting: primary flow 30% or more to a small UC
8.1 Secondary flow 30% to 50% to a UA 8.2 Secondary flow 30% to 50% to a large UC 9: Small town low commuting: primary flow 10% to 30% to a small UC
Ru
ra
l
10: Rural areas: primary flow to a tract outside a UA or UC 95 (17.9%) 243,989 (13.4%) 55,944.3 (72.8%) 10.1 Secondary flow 30% to 50% to a UA
10.2 Secondary flow 30% to 50% to a large UC 10.3 Secondary flow 30% to 50% to a small UC Sources: USDA Economic Research Service, US 2010
Figure 1.6 RUCA classifications of 2010 census tracts in Nebraska
1.3 Healthcare Delivery in Rural Nebraska
The Nebraska DHHS Office of Rural Health is concerned with addressing the rural-urban healthcare disparities that exist within the State of Nebraska. As a whole, Nebraskans are in better health than most people nationally, but disparities between urban and rural residents do still exist. Between 2010 and 2014, the largest rural-urban disparity in Nebraska was seen in unintentional injury deaths, which had a rate 53% higher in rural areas than urban areas. A large component of unintentional injury death was attributed to motor vehicle crashes, in which rural residents experience death rates 2.7 times higher than urban residents. This can be attributed to longer commute distances, higher speed limits on rural roads and highways than on urban streets, and the tendency for rural residents to forgo seatbelt use. Similar to national trends, heart disease deaths rates were
8% higher for rural residents than for urban residents. Cancer mortality rates, however, were higher for urban residents than for those living in rural areas, with urban residents experiencing an 8% higher death rate from all cancers and a 20% higher rate of lung cancer (Nebraska Department of Health and Human Services, Office of Community Health and Performance Management, 2016).
Another important disparity between urban and rural residents is the lack of preventative care in rural areas. The 2016 Nebraska Statewide Health Needs Assessment found that rural Nebraskans are 11% less likely to have regular colon cancer screening; they are 8% less likely to undergo regular breast cancer screening; and they are 5% less likely to have regular cervical cancer screening. This could be due to a variety of reasons, including geographic isolation, accessibility challenges or cultural norms (Nebraska Department of Health and Human Services, Office of Community Health and Performance Management, 2016).
1.4 Incentive Programs
The Nebraska Department of Health and Human Services, Office of Rural Health oversees five incentive programs designed to increase the number of healthcare providers in areas of need. Two of these programs, the Nebraska Student Loan, and Nebraska Loan Repayment programs are administered by the state. The National Health Service Corps (NHSC) Loan Repayment and NHSC Scholarship are federally administered, and a fifth program, the NHSC Student Loan Repayment Program (NHSC SLRP), is funded through federal grants but is administered at the state level. All of the incentive programs require
participants to work in a predetermined shortage area for a designated period of time. Failure to complete this obligation results in significant default penalties.
Between January 1, 1998 and January 1, 2018, the NE Loan Repayment program made up 54.0% of all incentive program contracts awarded to family practice providers in the state, followed by NHSC Loan Repayment (23.5%), NE Student Loan (15.3%), NHSC Scholarship (4.2%) and NHSC SLRP (3.0%) as seen in Table 1.3. Table 1.3 also shows the distribution of incentive program participants in each level of rurality.
Table 1.3 Nebraska family medicine incentive program contracts issued from 1998 to 2018 by RUCA rurality classification
Statewide Metropolitan Micropolitan Small Town Rural
n= total number of family medicine providers n=2431 n=1430 n=563 n=523 n=543 NE Loan Repayment (% of total) 271 (54.0%) 66 (41.8%) 56 (55.3%) 144 (65.2%) 141 (57.3%) NE Student Loan (% of total) 77 (15.3%) 20 (12.7%) 14 (13.9%) 38 (17.2%) 40 (16.3%) NHSC Loan Repayment (% of total) 118 (23.5%) 62 (39.2%) 23 (22.8%) 30 (13.6%) 48 (19.5%) NHSC Scholarship (% of total) 21 (4.2%) 10 (6.3%) 5 (5.0%) 2 (0.9%) 8 (3.3%) NHSC SLRP (% of total) 15 (3.0%) 0 (0.0%) 3 (3.0%) 7 (3.2%) 9 (3.7%) Total Program Providers Only 502 (100.0%) 158 (100.0%) 101 (100.0%) 221 (100.0%) 246 (100.0%) Source: HPTS, 2018
Statewide, the vast majority of family providers have not participated in any of the incentive programs. Figure 1.7 shows the proportional distribution of incentive
program participants statewide. Of the 2,431 providers studied in this report, 1,961 (79.6%) did not participate in a program. NE Loan Repayment providers made up 11.0% of all providers statewide followed by NHSC Loan Repayment (4.8%), NE Student Loan (3.1%), NHSC Scholarship (0.9%) and NHSC SLRP (0.6%).
Figure 1.7 Relative distribution of incentive program providers and non-program providers statewide in Nebraska, 1998-2018.
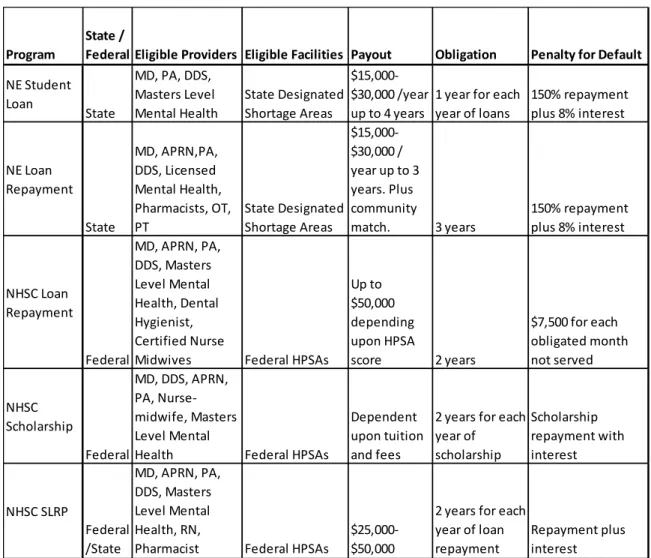
Table 1.4 Comparison of incentive programs available in Nebraska.
1.4.1 Nebraska Student Loan
The Nebraska Student Loan Program (for Medical, Dental, Physician Assistant, and Graduate-Level Mental Health Students) originated in 1979 when the State of Nebraska began awarding low-interest loans to medical students who committed to practice in State designated shortage areas. The program was redefined with the passing of the Rural Health Systems and Professional Incentive Act in 1991. Currently, the
Program State / Federal Eligible Providers Eligible Facilities Payout Obligation Penalty for Default NE Student
Loan State
MD, PA, DDS, Masters Level
Mental Health State Designated Shortage Areas
$15,000-$30,000 /year
up to 4 years 1 year for each year of loans 150% repayment plus 8% interest NE Loan Repayment State MD, APRN,PA, DDS, Licensed Mental Health, Pharmacists, OT,
PT State Designated Shortage Areas
$15,000-$30,000 / year up to 3 years. Plus community
match. 3 years 150% repayment plus 8% interest
NHSC Loan Repayment Federal MD, APRN, PA, DDS, Masters Level Mental Health, Dental Hygienist, Certified Nurse
Midwives Federal HPSAs
Up to $50,000 depending upon HPSA score 2 years $7,500 for each obligated month not served NHSC Scholarship Federal MD, DDS, APRN, PA, Nurse-midwife, Masters Level Mental
Health Federal HPSAs
Dependent upon tuition and fees
2 years for each year of scholarship Scholarship repayment with interest NHSC SLRP Federal /State MD, APRN, PA, DDS, Masters Level Mental Health, RN,
Pharmacist Federal HPSAs $25,000-$50,000
2 years for each year of loan
program awards forgivable, tax-free student loans to medical, dental, physician assistant, and graduate-level mental health students who agree to practice in a state designated shortage area (Figure 1.8).
The NE Student Loan Program awards a maximum of $30,000 per year for up to four years to medical, dental and psychologist students and a maximum $15,000 per year for up to two years to PA and master’s level mental health students. The award amount and number of student loans available is determined annually based on availability of state funding.
Only specific specialties within each discipline are eligible for the program. Medical and PA students must specialize in family practice, general surgery, general internal medicine, general pediatrics, obstetrics/gynecology, or psychiatry. Dental students must agree to specialize in general practice, pediatric dentistry, or oral surgery. Mental health students must pursue licensure through the Department of Health and Human Services for “Licensed Mental Health Practitioner” or “Licensed Psychologist.”
Participating students must agree to practice full-time (40 hours/week) in a state
designated shortage area for each year they are awarded a loan through the program once they are fully trained and licensed. Additionally, providers must also accept Medicaid patients. If a student does not fulfill their commitment to pursue an approved specialty and practice in a shortage area, there is a substantial default penalty imposed. Recipients that default must repay 150% of the principal plus 8% simple interest from the date of default (Table 1.4).
Figure 1.8 Nebraska State designated family practice shortage areas 2018.
1.4.2 Nebraska Loan Repayment
The Nebraska Loan Repayment Program for Rural Health Professionals was authorized by the Rural Systems and Professional Incentive Act in 1991. It is a local-state matching fund program to help local communities in shortage areas recruit healthcare providers.
The Nebraska Loan Repayment Program is available to licensed physicians, nurse practitioners, physician assistants, dentists, clinical psychologists, mental health
practitioners, pharmacists, occupational therapists and physical therapists. Like the Student Loan Program, physicians, nurse practitioners and physician assistants must specialize in family medicine, general internal medicine, general pediatrics,
obstetrics/gynecology, general surgery, or psychiatry. Dentists participating in the program must specialize in general dentistry, pediatric dentistry or oral surgery. Because the Nebraska Loan Repayment program is available to a wider range of disciplines, it is the largest of the state administered incentive programs.
The Nebraska Loan Repayment program requires local entities to match funding up to $30,000 per year for three years for physicians, dentists and clinical psychologists, and up to $15,000 per year for three years for nurse practitioners, physicians assistants, master’s level mental health professionals, pharmacists, occupational therapists, and physical therapists. Because state funding matches local contributions, providers are eligible to receive a maximum of $60,000 or $30,000 tax free, per year for up to three years depending on the individual provider’s student loan burden, their profession and the local entity’s matching funding and the availability of state funds.
In exchange for loan repayment, participating providers agree to serve a three-year full- or part-time practice obligation in a state designated shortage area (Figure 1.8), and accept Medicaid patients. Full-time practice consists of at least 40 hours per week in a state shortage area and part-time requires a minimum of 20 hours per week with part time providers receive reduced benefits. If a provider leaves the shortage area before their three year obligation is complete, they are charged a default penalty of 150% of the funds received through the program at 8% interest from the date of default (Table 1.4).
1.4.3 National Health Service Corps (NHSC) Loan Repayment
The NHSC Loan Repayment program offers tax-free loan repayment for healthcare providers working in federally designated shortage areas called Health Professional Shortage Areas (HPSAs). NHSC Loan Repayment is available to primary care physicians, nurse practitioners, certified nurse midwives, physician assistants, dentists, dental hygienists, and master’s level mental health providers.
The program offers up to $50,000 in exchange for a full-time clinical practice obligation of 2 years. It is available to qualified healthcare providers working in a NHSC-approved site. A site’s HPSA score is used to determine eligibility and amount of funding provided to a site with a HPSA designation. In order to receive maximum funding, a site must have a HPSA score of 14 or have an auto-HPSA designation. If a provider’s site has a HPSA score of 13 or lower, they may still be eligible to receive up to $30,000 for a two year service commitment. NHSC Loan Repayment offers providers working half-time in National Health Service Corps approved sites the opportunity to receive up to $25,000 if
in a HPSA with a score of 14 or higher or $15,000 for HPSAs with scores of 13 or lower (Figure 1.9).
The program is administered federally by the NHSC regional office in Kansas City with direct cooperation from the Nebraska Department of Health and Human
Services Primary Care Office (PCO). The state’s PCO director is responsible for working with communities to establish NHSC approved site status, HPSA scores and to recruit eligible providers. The NHSC is responsible for reviewing applications, assigning HPSAs and awarding loan repayment.
As with other incentive programs, the penalty for a provider defaulting on their program obligation is significant. If a participant breaches their obligation contract, they are liable to pay back any student loan repayments paid to them representing the period of obligated service not completed. Defaulting providers are also required to pay a penalty of $7,500 ($3,750 for half-time participants) multiplied by the number of obligated months not served (Table 1.4).
Figure 1.9 Federal primary care Health Professions Shortage Areas (HPSAs) in Nebraska, 2018
1.4.4 National Health Service Corps (NHSC) Scholarship Program
The NHSC Scholarship program is one of the least utilized incentive programs in this study, with only 21 providers having participated in the program. It is a competitive federal program that offers to pay tuition and eligible fees to primary care health
professionals while in training. In exchange, the healthcare provider must commit to work in a federally designated HPSA (Figure 1.9). The scholarship program is available to students pursuing careers in primary care medicine or dentistry, as well as master’s level mental health providers, nurse-midwives, nurse practitioners, and physician assistants.
The time participating providers are obligated to serve is dependent on the number of years the student is awarded a scholarship. Participating students are required to practice in a qualifying HPSA for one year for every year they are awarded the scholarship if they are full-time workers or two years for every year they receive scholarship funding if they are working half-time. Additionally, all participants must agree to a minimum of two years of service.
Default penalties for the NHSC Scholarship are dependent upon the amount of education received by the participant. If a participant fails to complete academic training, they must repay all NHSC Scholarship funds that they have received, interest free, within three years of the default date. If this debt is not paid within three years, the defaulting student is assessed interest. However, if a scholar fails to meet the program terms after completing their education, they are required to pay penalties equal to three times the scholarship award plus interest (Table 1.4).
1.4.5 National Health Service Corps State Loan Repayment Program (NHSC SLRP)
The NHSC SLRP provides federal cost sharing grants to states to operate their own loan repayment programs. The program is funded through the Health Resources Services Administration (HRSA) but is administered at the state level through the Nebraska Office of Rural Health. The program is available to qualified primary care providers practicing in medicine, dental, and graduate level mental health as well as nurse practitioners, physician assistants, registered nurses and pharmacists practicing in an eligible federally designated HPSA (Figure 1.9).
Participating providers must agree to serve a minimum of 2 years in a qualifying HPSA in exchange for loan repayment assistance on qualified education debt in the amount of $25,000-$50,000 per year depending on discipline and specialty. This program can be extended, providing participants with an additional year of support for an
additional year of service. Part-time service options are also available (Table 1.4).
1.5 Previous Retention Studies
The study of workforce attrition and retention is important to many industries because a stable workforce has many benefits, especially when dealing with public health. Therefore, there is an abundance of scholarly articles that examine one or more factors that influence workforce turnover and retention. Several of these articles use the Cox Proportional Hazard Right Censored Regression Model (CPH) and longitudinal employment data to analyze retention in a manner similar to the methodology used in this report.
The CPH model is a regression method used for survival or time-to-event analysis. This type of regression uses the amount of time until an event happens for two or more cohorts based on specific factors. The model provides a hazard ratio which is a calculation that compares the rate at which an event is expected to happen (hazard) for each of two or more cohorts over time (Cox, 1972). The CPH model is discussed in more detail later in this report.
In 1994, Pathman, Konrad, and Agnew published an article detailing best practices for studying retention in the field of healthcare and introduced the use of the survival analysis to quantitatively investigate retention. Prior to this article, most retention studies focused primarily on data obtained from workforce surveys. However, these studies were relatively weak from an empirical standpoint, and were often based on informal sources, anecdotal reports and indirect information. In the article, Pathman, Konrad and Agnew suggested ways that the methodology could be strengthened to more accurately answer causal questions about retention of healthcare providers. These
methods focused primarily on maximizing internal and external validity (Pathman, Konrad, & Agnew, 1994).
A study is internally valid when the factors it finds are affecting the outcome do indeed affect the outcome in real world applications. Pathman, Konrad and Agnew suggest three ways to increase internal validity in a study. The first is to verify that chance alone is not likely to explain study findings. This is accomplished by having a large number of study subjects and by using quantitative studies with statistical tests. The second way to increase internal validity is to minimize bias. Two types of bias common
to retention studies are selection bias, where comparisons are made between groups that differ for reasons other than those under study, and measurement bias, where the actual measurement is different from the study measurement. The third way to increase internal validity is to control for confounding. Confounding occurs when unrecognized factors are associated with both the purported effect and cause under study and these unrecognized factors are largely responsible for the effect observed (Pathman, Konrad, & Agnew, 1994).
Currently, the use of survival analysis methodologies to study workforce retention is commonplace in academic literature. These studies span multiple employment sectors and work settings, and nearly all of them use the CPH model to compare factors that influence retention and attrition of workers. One such study by Vasterling, et al., in 2015 looked at military personal and the predictors of retention for soldiers that were deployed in the Iraq war. This article used a combination of demographic data obtained from US Army service records and survey data generated from post deployment surveys, as well as interviews of soldiers three months after returning from Iraq. The study looked at a number of factors to determine if any were predictors of extended retention among soldiers. This included demographic factors like age, sex, race/ethnicity, and marital status; employment factors like duration of military service, occupational type, and rank; and psychological factors relating to deployment experience, post-traumatic stress, depression, traumatic brain injury and other issues effecting post-deployment military members. The results of the study found that the predictors of retention were duration of military service (soldiers with less than 6 years of service left the military at a rate 4 times higher than those who had over 6 years of service), marital status (unmarried
soldiers left military service at a rate twice that of married soldiers), and unit support (soldiers reporting high satisfaction with support from their unit were more likely to be retained than those reporting moderate or low unit support) (Vasterling, et al., 2015).
Another study conducted by Madden, Scannapieco, and Painter in 2014, examined retention and length of employment among public child welfare workers in Texas. This study looked at longitudinal demographic and survey data collected from all new public child welfare caseworkers hired between 2001 and 2010. Using a CHP model, the study looked at demographic factors like ethnicity, gender and level of education, as well as organizational factors like satisfaction with management, job desirability, and unit support. The study found that female child welfare caseworkers and those with higher levels of education left their positions at a rates slightly lower than their counterparts. It was also discovered that caseworkers that had participated in Title IV-E stipend programs stayed in their positions at rates nearly 30% higher than non-participants (Madden,
Scannapieco, & Painter, 2014). This finding is of particular interest because the Title IV-E stipend program is a loan repayment program that is very similar to the incentive programs in Nebraska that are investigated in this report. These results support this report’s hypothesis that incentive programs have a positive impact on retention.
A review of academic research on workforce retention shows that a large proportion of studies focus on healthcare providers. In a 2012 article, Daniels, et al., determined that turnover patterns among part-time and casual nurses in Canada were statistically different than turnover patterns of full- and part-time nurses using CHP methodology. They therefore concluded that future nursing workforce studies should
account for part-time nurses and casual nurses differently due in large part to differing levels of retention (Daniels, et al., 2012).
Another study used survival analysis to measure turnover of the medical education workforce in Ethiopia (Assefa, Mariam, Mekonnen, & Derbew, 2017). This article looked at medical educators in state operated medical schools to determine factors that could be used to predict retention. The study found that educating physicians who had higher academic rank (associate professors and above) and those born prior to 1975 were in more likely to stay in their positions than younger physicians with lower
academic rank. These results may be influenced by selection bias, as associate professors achieve their advanced rank over time, while lecturers and assistant professors simply haven’t been in the workforce long enough to reach a higher academic rank. Similarly, physicians born prior to 1975 could have longer retention by the sheer fact that they have been alive and able to practice longer than those in younger age cohorts. The study also identified specific medical training hospitals that were statistically worse off than others with regard to physician retention. These findings could be used by public health officials and administrators to identify the need for site specific strategies to improve retention in struggling hospitals.
One retention study that focused specifically on rural physician retention was conducted by Pathman, et al., in 2004 to determine if average job retention duration was shorter for physicians in rural health professional shortage areas (HPSAs) than for physicians in rural non-HPSAs. The study initially identified primary care physicians in 1991 that had recently moved to rural HPSAs and rural non-HPSAs. Then in 1996 and
1997, they resurveyed those physicians to document any job changes. The study then compared the two cohorts using the CHP methodology and concluded that retention of primary care providers in rural HPSAs is identical to, or very slightly shorter than, retention for those working in rural non-HPSAs (Pahtman, Konrad, Dann, & Koch, 2004). These findings are important because they show that the causes of healthcare shortage in these areas is more due to lack of recruitment than poor retention.
A 2015 study by Pagaiya, Kongkam and Sriratan investigated retention of rural physicians in Thailand and compared physicians who had completed their training through normal channels and those who participated in a rural recruitment program. The study found that physicians participating in the rural recruitment program had retention rates 20% longer than those who did not participate (Pagaiya, Kongkam, & Sriratana, 2015).
Bailey, Wharton and Holman published a 2016 study that compared rural doctor retention over time in Western Australia. Being a large, mostly rural country, Australia has placed significant focus on improving healthcare delivery in rural areas over the last 20 years. The study compared doctors who first began working in Western Australia between 2004 and 2008 to those who began working in the same area between 2009 and 2014 with a goal of determining whether or not rural health policies were having a positive impact on retention of doctors. The study found that retention for the 2009-2014 cohort was longer than the 2004-2008 cohort, indicating that the implementation of rural health policy was indeed having a positive impact on the retention of doctors in Western Australia (Bailey, Wharton, & Holman, 2016).
These studies have contributed to the body of well-established research into workforce retention. This report aims to use the methodologies implemented by this established research to analyze retention in Nebraska. By using these methodologies, this study is able to identify not only if program participation has an impact on retention, but also the magnitude of that impact.
Chapter 2 Data
The primary dataset for this project was acquired from the Health Professions Tracking Service (HPTS) based out of the University of Nebraska Medical Center (UNMC) in Omaha, NE. The HPTS was developed in 1995 as a key repository for tracking essential information about healthcare providers in Nebraska and western Iowa. It also maintains information about the facilities where providers practice. The HPTS keeps track of a wide range of data including demographic, training, expertise, licensure, practice locations, and participation in incentive programs. The HPTS obtains data
through semi-annual surveys sent to all licensed providers and to the administrators of the facilities where they work. Those surveys are then cross referenced with Nebraska state licensure data, resulting in an extremely robust and accurate dataset. The dataset for this project pertains to all family medicine providers (Physicians, Physician Assistants and Advanced Practice Registered Nurses) that have practiced or are practicing in Nebraska between January 1, 1998 and January 1, 2018.
The initial data download from the HPTS was organized by each unique tenure served by each practicing provider. A tenure is defined as the period of time a provider works at a unique location from the start of employment to the time they left that position. In some cases, the dataset included duplicate entries to account for providers with multiple licenses (APRN and PA) or providers that have participated in more than one incentive program. These duplicate entries were accounted for in the data cleanup portion of this study.
In addition to the HPTS dataset, RUCA census tract data were obtained from the United States Department of Agriculture Economic Research Service and population data were obtained from the US Census Bureau. This RUCA data was separated into four distinct levels of rurality which were used in the majority of the analysis in this report. All other geospatial data were obtained from the Nebraska DHHS, GIS server.
The Nebraska DHHS Office of Rural Health, partners with other states to collect qualitative survey information through organizations like the Rural Recruitment and Retention Network (3RNet). These data are useful understanding specific issues that could be influencing providers retention but they shouldn’t be relied upon alone to understand retention. By using the longitudinal data provided from the HPTS,
quantitative data analysis can provide a more precise assessment of the influence of the institutional and systemic factors that could impact retention.
Chapter 3 Methods
Data management and analysis for this project involved two steps. The first step was to clean and organize the dataset obtained from HPTS in order to prepare it for statistical analysis. This step allowed for the creation of descriptive statistical tables based on consistent rural classifications, length of time worked at each location, profession and program participation. This data management step also organized the dataset so that it enabled analysis using advanced statistical tools.
The second step was to employ survival analysis methodologies using SPSS statistical software. These analyses were based on general epidemiological methods designed to draw conclusions from time to event data. By using this methodology, it was possible to determine if there were statistically significant differences between retention of program participants and non-participants while also quantifying the magnitude of any differences.
3.1 Data Cleaning and Organization
In order to prepare the dataset for analysis, it first needed to be cleaned and organized to fit the parameters for statistical modeling. The primary goal of this process was to identify the populations to be investigated and to compile the information into a format that was conducive to analysis in SPSS. Appendix 1 shows a table of the data fields included in the original provider and facility datasets that were obtained from HPTS and how those data were used to create the final dataset used for analysis.
The first step in this process was to eliminate personal identifying data fields such as provider name, home address, phone number, email address and license number. In addition, unneeded and redundant data fields regarding facility contact information and provider sub-specialty fields were removed. In order to identify individual providers for statistical analysis, a Subject ID (SID) number, generated by HPTS, was retained.
In order to fit the statistical model used in this project, providers that were actively practicing on January 1, 2018, the end of the study period, were labeled as “currently practicing.” These currently practicing providers were then identified with either a “1” meaning they were practicing at a facility at the end of the study period or a “0” meaning that they had started and ended a tenure within the study period. This designation was used to determine right censoring which is discussed in more detail later in this chapter.
As mentioned in Chapter 2 of this report, the initial provider dataset obtained from HPTS contained multiple entries for each individual family medicine provider. In most cases, each entry represented the unique tenure at a location that a provider had worked or is currently working. However, a small percentage of providers had duplicate entries because they either held licenses as both a physician assistant and nurse
practitioner, or they had participated in more than one incentive program. To account for this, providers with duplicate entries were identified and new data fields were created to designate those with dual licenses or those who participated in multiple programs. The duplicate entries were then removed from the dataset leaving, only entries representing each provider’s unique tenure at individual locations.
The next step in cleaning and organizing the data was to create a data field that calculated the number of months worked at each location by each provider. This was done using the DATEDIF function in Microsoft Excel to subtract the date listed in the “Location To” field from the date listed in the “Location From” field. These fields represent the data collected by HPTS from provider and facility surveys and cross referenced with Nebraska State Licensure information. As a result, the dates in these fields may not be exact but can be assumed to be accurate within 6 months. This is primarily due to the inherent lag in the HPTS data reporting system (Deras, 2017).
Information regarding participation in incentive programs was cleaned and organized in a similar way. First, fields were created to identify participation in each individual program. This was done using a binomial identifier with a “1” representing participation and a “0” indicating that the provider did not participate. In addition, the number of months worked as part of program obligation was calculated using the
DATEDIF function to subtract the “program start” field from the “program end” field for each participating provider.
The next step was to geographically locate the facilities where each provider had worked. This was accomplished by entering each facility’s street address into ESRI’s ArcGIS Online geocoding system. The resulting geocoded data points were then imported into ArcMap where they were categorized by census tract using a spatial join. This data table was then exported to Microsoft Excel and the census tract information was added to the working dataset using the VLOOKUP function. The census tract for each facility was then cross-referenced to the 2010 RUCA codes dataset. These codes
were then classified by level of rurality (Metropolitan, Micropolitan, Small Town and Rural) based on a USDA classification scheme (USDA Economic Research Service, 2018).
The final pre-analysis data cleanup step was to calculate the number of months worked at each level of rurality for each provider. This was done to reduce bias in the statistical model, as most providers in the dataset had practiced in more than one location over the course of the study period, and many of those locations existed at various levels of rurality. The first step in this process was to create a new master data set where each unique provider was listed only once. This was done by removing duplicate subject identification numbers from a copy of the working dataset. Then, using the working dataset, an Excel pivot table was created that calculated the number of months worked at each level of rurality for each individual provider. The VLOOKUP function was then used to join the pivot table information to the master dataset to be used for statistical analysis. Appendix 1 shows the data fields present in the master dataset and summarizes their importance to the statistical model used for the project.
3.2 Data Analysis
The statistical process used to compare length of retention for this project falls into a category of statistical modeling called survival analysis. Survival analysis is commonly used in epidemiology and is designed to analyze time to event data such as time to death, hospitalization, or recurrence of a condition. In the case of this project, the “event” in question occurs at the end of a providers’ cumulative time worked in a
particular level of rurality and is therefore a powerful tool in making statistical comparisons about provider retention.
There are two components to take into account when analyzing time to event data. The first is a binary component called censoring where an observation is classified with a “0” indicating that it is censored or a “1” indicating that the stated event has happened within the time frame of the study. Because it is impossible to create a study period where the event happens for all subjects, instances where a subject does not experience the event during the study period are identified through a process called censoring. Censored observations are data points where the exact time to event is not known. In the case of this project, censored observations are those where a provider was actively working at a location at the end of the study period. This is known as right censoring and is the only type of censoring used in this project. Other forms of censoring do exist however. Left censoring is used for events known to have happen prior to the study period, and interval censoring is for events known to have happened within the study period.
The second part of time to event data is the time component. This is a calculation of the amount of time a subject is at risk of an event happening during the study period. In this project, the time component represents either the total months worked at a specific level of rurality or, in the case of a censored observation, the amount of time a provider worked from the start of employment at that level of rurality until the end of the study period.
The first step in data analysis was to plot a Kaplan-Meier curve for each level of rurality. The Kaplan-Meier curve plots turnover (survival) over time and compares the percentage of retained individuals at any given time over the course of the study period. This plot visually displays separate survival curves for providers who have participated in incentive programs and those who have not. It also provides an estimate of the mean and median length of retention (survival) for each curve after taking into account any
censored data points (Kleinbaum & Klein, 2012).
As part of this analysis, a chi-squared test called a log-rank test is conducted to check the Kaplan-Meier assumption by testing the null hypothesis that there are no differences between the probabilities of an event (leaving a position) for either group over the course of the study. It also can help to identify if censoring influences either group more than the other or if the odds of an event occurring changes over time (Bland & Altman, 2004).
The final analysis method used for this project is the Cox Proportional Hazard (CPH) regression model. This model calculates a hazard ratio, which is a ratio of the rate of hazard for a variable compared to the rate of hazard for a baseline variable. In this case, the retention for participating providers was compared to the baseline group of non-participating providers. The resulting hazard ratio is interpreted by examining its relation to 1. A hazard ratio of 1 would indicate no difference between the two variables. A ratio less than 1 indicates that events in the exploratory variable occur at a rate lower than those in the baseline variable. Likewise, if the hazard ratio is greater than 1, it indicates that events in the exploratory variable occur at a higher rate than those in the baseline
group. The magnitude of the difference in rates is determined by the distance of the hazard ratio from 1. For example, a hazard ratio of .38 would indicate that events in the exploratory variable are expected to occur at a rate 62% lower than the same event in the baseline group. Conversely, a hazard ratio of 1.62 would indicate that events in the exploratory variable occurred at a rate 62% higher than baseline (Kleinbaum & Klein, 2012).
It is important to look at the statistical significance and goodness of fit for this type of model. As part of the CPH model results, a p-value is returned as well as a 95% confidence interval for the hazard ratio. If the p-value less than or equal to 0.05, the resulting hazard ratio is considered statistically significant, meaning that with 95% confidence, the difference in retention between the two groups is not due to chance alone.
The CPH model operates on the assumption that the risk of an event happening is constant across the entire study period. In order to test this assumption, and thus validate the results of a CPH model, a goodness of fit test must be conducted. Survival analysis texts recommend a graphical analysis by plotting a log-log graph from a standard survival curve and verifying that the resulting curves appear to be parallel. This method of testing goodness of fit has potential drawbacks due to subjectivity in determining if the curves are parallel. However, Kleinbaum and Klein suggest that the CPH assumption is
generally accepted unless there is strong evidence of nonparallelism (Kleinbaum & Klein, 2012).
For this project, both a Kaplan-Meier survival curve and a Cox proportional hazard test were run on each of the five separate datasets representing the rurality of
providers. Because some providers have worked in multiple locations across varying levels of rurality, it was necessary to break the master dataset into these smaller groups. Therefore, separate analyses were conducted for providers at each level of rurality (rural, small town, micropolitan, metropolitan), as well the state as a whole.
Chapter 4 Results
Each rurality cohort studied in this project underwent three levels of analysis. First, Table 4.1 shows general descriptive statistics compare the basic demographic, profession and program participation counts at each level of rurality. Second, a Kaplan-Meier survival curve was generated to graphically compare retention of participating and non-participating providers. The Kaplan-Meier test also provided an estimate of mean and median length of retention. Lastly, a Cox Proportional Hazard model was fitted to retention data to compare participating and non-participating providers. For both, the Kaplan-Meier and CPH models, a test of fit was conducted to determine the viabilityof the results.
Table 4.1 Gender and incentive program participation of family medicine providers in Nebraska who started a position between January 1, 1998 and January1, 2018
All Locations n=2431 Total (% of total) Participants (% of participant providers) Non-participants (% of non-participant providers) Gender F 1357 (55.8%) 270 (57.4%) 1087 (55.4%) M 1074 (44.2%) 200 (42.6%) 874 (44.6%) Total (% of total) 2431 (100%) 470 (100%) 1961 (100%) Profession APRN 537 (22.1%) 88 (18.7%) 449 (22.9%) MD 1230 (50.6%) 197 (41.9%) 1033 (52.7%) PA 664 (27.3%) 185 (39.4%) 479 (24.4%) Total (% of total) 2431 (100%) 470 (100%) 1961 (100%)
Table 4.1 Continued
Metropolitan n=1430 (58.8% of statewide providers)
Total (% of total) Participants (% of participant providers) Non-participants (% of non-participant providers) Gender F 816 (57.1%) 82 (56.2%) 734 (57.2%) M 614 (42.9%) 64 (43.8%) 550 (42.8%) Total (% of total) 1430 (100%) 146 (100%) 1284 (100%) Profession APRN 327 (22.9%) 31 (21.2%) 296 (23.1%) MD 756 (52.9%) 62 (42.5%) 694 (54.0%) PA 347 (24.3%) 53 (36.3%) 294 (22.9%) Total (% of total) 1430 (100%) 146 (100%) 1284 (100%) Micropolitan n= 563 (23.2% of statewide providers)
Gender F 320 (56.8%) 50 (53.8%) 270 (57.4%) M 243 (43.2%) 43 (46.2%) 200 (42.6%) Total (% of total) 563 (100%) 93 (100%) 470 (100%) Profession APRN 155 (27.5%) 24 (25.8%) 131 (27.9%) MD 246 (43.7%) 33 (35.5%) 213 (45.3%) PA 162 (28.8%) 36 (38.7%) 126 (26.8%) Total (% of total) 563 (100%) 93 (100%) 470 (100%)
Small Town n=523 (21.5 % of statewide providers
Gender F 281 (53.7%) 120 (58.0%) 161 (50.9%) M 242 (46.3%) 87 (42.0%) 155 (49.1%) Total (% of total) 523 (100%) 207 (100%) 316 (100%) Profession APRN 71 (31.6%) 25 (12.1%) 46 (14.6%) MD 236 (45.1%) 89 (43.0%) 147 (46.5%) PA 216 (41.3%) 93 (44.9%) 123 (38.9%) Total (% of total) 523 (100%) 207 (100%) 316 (100%)
Rural n= 543 (22.3% of statewide providers)
Gender F 314 (57.8%) 136 (59.4%) 178 (56.7%) M 229 (42.2%) 93 (40.6%) 136 (43.3%) Total (% of total) 543 (100%) 229 (100%) 314 (100%) Profession APRN 125 (23.0%) 50 (21.8%) 75 (23.9%) MD 220 (40.5%) 89 (38.9%) 131 (41.7%) PA 198 (36.5%) 90 (39.3%) 108 (34.4%) Total (% of total) 543 (100%) 229 (100%) 314 (100%)
Table 4.1 shows general descriptive statistics for all levels of rurality studied in this project. Over the 20-year study period, there were a total of 2431 family medicine providers who practiced in Nebraska. Of these providers, 1430 (58.8%) practiced in a metropolitan area, 563 (23.2%) practiced in a micropolitan area, 523 (21.5%) practiced in a small town and 543 (22.3%) practiced in rural areas. Many of these providers have worked at locations in more than one level of rurality over the course of the 20-year study period.
Out of the total of 2431 statewide providers during the 20-year period, 470
(19.3%) have participated in one or more incentive programs, and 1961 (80.7%) have not participated in any of the incentive programs. Of the 1430 providers who at some point during the study period practiced in a metropolitan area, 146 (10.2%) were program participants and 1284 (89.8%) were not. In micropolitan areas, program participants made up 93 (16.5%) of the 563 providers while non-participants accounted for 470 (83.5%) of the providers. The number of program participants in small town areas was 207 (39.6%) and the number of non-participants was 316 (60.4%). In rural areas, out of 543 providers, 229 (42.2%) participated in incentive programs and 314 (57.8%) did not (Table 4.1).
Of all providers studied, just over half (1230, 50.6%) were MDs, 664 (27.3%) were PAs, and 537 (22.1%) were ARPNs. Of the 470 program providers statewide, 197 (41.9%) were MDs, 185 (39.4%) were PAs, and 88 (18.7%) were ARPNs. Of the non-program providers, 1033 (52.7%) were MDs, 479 (24.4%) were PAs, and 449 (22.9%) were ARPNs (Table 4.1).
Table 4.2 shows the average amount of time served including all levels of rurality throughout Nebraska for each program. This calculation gives a general idea of how long providers in each program have worked; however, because these calculations include providers who were working at the end of the study period, they likely skew lower than the actual mean retention times. Also, NHSC SLRP is a relatively new program and, therefore, participating providers have simply not had the ability to generate retention times like participants in other programs.
Table 4.2 Mean retention times for all providers statewide, based on participation in incentive programs. Program Total Total Months Worked (years) Average Months Worked (Years) Total months worked after obligation (Years) Average months worked after obligation (Years) NE Loan Repayment 271 30462 (2538.5) 112.4 (9.4) 21000 (1750.0) 77 (6.5) NE Student Loan 77 10939 (911.6) 142.1 (11.8) 8038 (669.9) 104 (8.7) NHSC Loan Repayment 118 14670 (1222.5) 124.3 (10.4) 11237 (936.4) 95 (7.9) NHSC Scholarship 21 2631 (219.3) 125.3 (10.4) 2149 (179.1) 102 (8.5) NHSC SLRP 15 931 (77.6) 62.1 (5.2) 486 (40.5) 32 (2.7) No Program 1961 193304 (16108.7) 98.6 (8.2) 193304 (16108.7) 98.6 (8.2) All Providers 2431 248287 (20690.6) 102.1 (8.5) 233064 (19422) 95.9 (8.0)
Statewide, the program with the longest average length of retention, was the NE Student Loan program (11.8 years). The NHSC Loan Repayment and NHSC Scholarship
programs both had an average retention of 10.4 years and the NE Loan Repayment program had an average retention of 9.4 years. As expected, the newer program, NHSC SLRP only had an average retention of 5.2 years. For all non-program providers, the average length of retention was 8.2 years.
Between 1998 and 2018 there were an average of 19.75 program awards issued yearly across the five incentive programs. Figure 4.1 shows the number of awards issued yearly by each program as well as the total number of annual awards. On average, there were 12.1 Nebraska Loan Repayment awards, 4.25 NHSC Loan Repayment awards, 2.25 Nebraska Student Loan awards, 0.4 NHSC Scholarships awarded to Nebraska family medicine providers between 1998 and 2018. Additionally, there were on average 3.75 NHSC SLRP awards granted to family medicine providers from the program’s inception in 2014 to the end of the study period in 2018.