Event-Based Performance Analysis
Steven P. Reiss
Department of Computer Science
Brown University
Providence, RI 02912-1910
401-863-7641, FAX: 401-863-7657
[email protected]
Abstract
Understanding performance and related issues in a complex system requires analyzing where and why the pro-gram spends its resources. In a reactive system such as a interactive application or a server, it is important for understanding that one be able to associate resource usage with the events, be they user actions or client requests, that triggered the corresponding execution. As part of our software visualization and analysis efforts we have developed a system that lets the programmer define what is meant by an event and then to track the resources used in processing that event through the system. The resultant data is currently used to produce visualizations of event-based resource utilization.
1. Introduction
Traditional performance analysis and understanding techniques are inadequate for complex, reactive software systems. In a reactive system the important performance questions relate to the time it takes to react to a particular input or request. Traditional techniques look at overall per-formance and are not input or request-directed. We have developed an automated approach that can provide detailed information describing the resources associated with each particular input or request in a complex system and that is capable of providing performance information for the dif-ferent types of inputs or requests.
Traditional methods look at where the overall system spends resources such as execution time, real time, or memory. They assign resources to particular routine or lines of source code. For example, the UNIX prof tool uses sampling techniques to estimate how much time is spent in each routine over the full run of the program. More sophis-ticated methods, such as gprof [4], assign resources based on two-level calls, that is, instead of looking at all instances of routine R, they separate these instances based on the dif-ferent callers of R. Other tools such as HP’s CxPerf provide a per-thread analysis of resource utilization. Still other tools look at specific items in a complex system. For exam-ple, Tmon [5] and theadmon [2] look at the behavior and
interaction of threads in a multithreaded system. There have also been a variety of frameworks for customizing performance analysis [1,3], but these have only been used to do selective overall evaluation rather than looking at the behavior of individual actions.
Today’s reactive systems are typically multithreaded and event-driven. They wait for events to come either from user interactions or, for a server, from client requests. Overall performance, while important, is not as critical as the response time to these individual event requests. An interactive application will feel sluggish and unusable if particular user interactions take too long, where too long is typically measured in fractions of a second. A server will seem unusable to a client if what are perceived as simple requests from the client actually take significant amounts of time, where significant here is typically measured in milliseconds. In a long running server, the resources and run time for these individual events are often dwarfed by the other actions of the server such as initialization and background processing, and hence traditional analysis does not provide the necessary insights into if and why such events might be perceived as slow.
What is needed is to understand resource utilization based on events. That is, the programmer needs to see how much time is used and memory allocated in processing each particular user or client-initiated event. Moreover, the programmer needs to understand this both grouped by event type and throughout the application. This can be done by a system that would collect and display perfor-mance information for events and that would handle the complexities of event processing in real applications.
The complexities arise from several sources. The first involves identifying when the event starts and when it fin-ishes. Events can come from multiple sources. Events based on inputs (as user interface and client-request events are) might be read at some point in a buffered read and then actually processed latter on. The event might be finished when the next event starts, when a message is sent back, or when the system goes back into an idle state. In order to determine resource requirements, a formal definition of an event and its start and ending points is needed. A second complication is that the program is often multithreaded.
This means that the resources that are allocated globally may or may not reflect those needed by the particular event and that the analysis has to be done on a per-thread basis. A third difficulty involves the way that these systems process events. Many systems will do some initial processing of the request and then put it on a queue for a worker thread to eventually handle. The worker thread might take some action and then enqueue something for further processing by another thread. Ideally, what is needed is a way of actu-ally assigning the execution of a thread at a given point in the program to a particular event and then accumulating the time from all such assignments in determining the resources used by that event.
Some of the more recent performance tools provide a foundation for event-based analysis but do so by putting the burden on the user. These tools let the user tell the program when to start collecting information and when to stop collecting it. They then let the user browse over the detailed performance information that was collected. For example, Jinsight lets the user specify a method as a trigger [7,8]. Trace collection occurs while the method is being executed. The user can then use Jinsight to browse over the dynamic call tree, objects allocated, etc. JProbe lets the programmer Borland’s OptimizeIt lets you see perfor-mance by thread, and then examine the dynamic call graph to examine the behavior of individual events. Wily’s Inter-scope again collects enough data to let the programmer specify filters and browse the dynamic call graph down to the method level so that an individual event can be
under-stood. Sitraka’s JProbe software lets the user specify what parts of the program should be analyzed in detail and then lets the user browse the dynamic call tree of those portions. The problems with these approaches, and the difficulty we wanted to address, is that the user generally needs to know what events are important in advance and has to manually track the processing of events between different portions of the system using the various browsing tech-niques. Moreover, it is impossible to get information about the total resources used for an event whose processing was distributed or the total resources used for all events of a given type. Our approach follows events throughout the whole application without programmer intervention.
2. Overview
To demonstrate that automatic event-based performance analysis was possible and to demonstrate its utility, we have put together a system that takes program traces created for visualization and generates event-based perfor-mance data. The same techniques that we use could just as easily be used to collect and produce event-based perfor-mance data dynamically as the program is run.
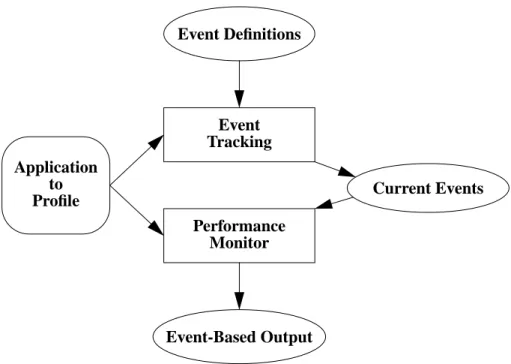
Our system consists of two primary components as shown in Figure 1. The principle component, Event Track-ing, detects and manages events. It takes as input both the sequence of events coming from the program and a file that defines what are the events for this particular application. The output of this component is the notion of a current
Application to Profile Event Definitions Event Tracking Performance Monitor Event-Based Output Current Events
event being processed by each active thread. The second component, Performance Monitor, of the system is a more typical performance analyzer which collects information about run time, memory usage, etc. based on events coming from the program and then accumulates this infor-mation on an event basis. When the program terminates, this information is written to an output file for either further analysis or, in our case, for visualization.
The key issues that arose in developing this system and in any event-based performance analysis included:
• How to characterize and define events. This has to be done in a way that captures the programmers intuitive notion of what an event is while at the same time being easy to detect and track during program execution. • How to allow events to be both generic (e.g. to handle
standard input packages) and application-specific at the same time.
• How to associate performance statistics with an event. While this is easy on the surface, the fact that the same event can be processed by different threads at different stages of the execution makes this more complex. One also has to deal with the arbitrary behaviors of real applications.
• How to make the process of tracking events and then associating performance with events as efficient as pos-sible.
The remainder of this paper describes our system in more detail paying special attention to the reasons why the above issues are important and the solutions we developed to address them. We start in the next section by describing what we mean by an event and how we define its starting and ending points. The subsequent section describes how we track event processing through the system even where the same event is processed on multiple threads at various times. The next sections describe the implementation of this analysis and the output that we get out from it as well as some of the visualizations we have provided of that output. We conclude with a section describing our experi-ences to date and the future work in this area.
3. Defining and Triggering Events
We are concerned with reactive systems, that is, systems that wait for input from either the user or another program, and then react to that input by doing some computation. An event in this context is any of the possible actions that cause the system to react. Typical events might be user actions coming from the user interface manager, messages sent over a socket from another application, or remote method invocations from some client. Events can also be specific to an application. In some cases, time-outs might be considered events. In other cases, the application might
need to react to interrupts or particular types of exceptions. In all these cases, we want to be able to associate system resources with the processing of the underlying event. For our purposes we are mainly interested in application-level servers (rather than say operating systems) and in proce-dural or object-oriented languages such as C/C++ or Java.
Because events come in a variety of forms, it is not always clear where the processing of an event starts. User interface events in Java are processed internally in different ways on Windows and Unix systems and these differences are not exposed to the programmer. Does the event pro-cessing include such internal propro-cessing and if so, how much? There are multiple ways that remote method invoca-tion can operate and the programmer is usually not exposed to the actual implementation. Should event performance include the internal routines that decode and possibly enqueue the message, or should it only include the cost of actually processing the message. Similar issues arise when dealing with socket-based messages and interrupt-driven systems.
Determining when the system is done processing an event may also be problematic. The system might be fin-ished with an event when it moves on to a new event or when it becomes idle. In the case of a user interface event, event processing is generally finished when the system returns to get the next event from the main event loop. In the case of incoming messages, it is done when it is ready to read the next message. In the case of remote method invocation, it is done when the remote method returns or the thread that was created to deal with the remote invoca-tion terminates.
In order to associate performance information with events, we first need to determine a way of indicating the start and end of an event. Taking all the above into account and looking at a variety of programs led us to define events by associating them with particular procedure calls, with the entry to the call being the start and the exit from the call being the finish. This is a somewhat simplistic approach but one that seems to be general and to work. Moreover it is similar to techniques used in [8] for selecting portions of the code for detailed visualization. As an example of using procedures to define events, Java input events for AWT or Swing typically are processed by having the lower level event loop call the method dispatchEvent for whatever component the event occurs in. Thus, if we look for calls to this method in any of the subclasses of java.awt.Compo-nent we can find the start and stop of most input events. Other AWT events can be found using the dispatch method of java.awt.event.InvocationEvent. For Motif applications, X events can be delineated by calls to the routine XNex-tEvent. For remote method calls using Java RMI, it is pos-sible to find two different routines that indicate the start of a call. The first includes all the argument decoding and
encoding as well as the call; the second only includes the actual call.
The use of procedure calls also applies naturally to message systems, more detailed remote method invoca-tions, and application-specific events. For example, to apply it to the socket-based messaging framework used in the FIELD programming environment [9], we use the routine process_message inside the message handling code. For an RMI application, the programmer can indicate each significant remote method as a separate event type.
While procedure calls provide a natural way of viewing events, their use raises several issues. The first is that the set of routines that need to be identified will differ for dif-ferent systems. We accommodate this in our implementa-tion by letting the particular routines be defined as resources in a set of XML files. We provide a basic XML file with different generic events such as AWT and Swing user interface callbacks and RMI calls. In addition, pro-grammers can provide project or application specific files that define additional events
A portion of the global event definition file is shown in Figure 2, Each of the event definitions first contains enough information to uniquely identify a particular routine or set of routines. For Java, this includes the method name, class, and the signature.1 For C or C++ it includes the routine name, class, signature, and source file. Each of these can either be specified directly or wild-carded. Moreover, the class entry can be defined either explicitly (using CLASS=”xxx” as in Figure 2) or by spec-ifying a set of classes or interfaces which implies all
classes that are either subtypes of or implementors of one of the given classes or interfaces using OBJECTS= “xxx”.
Each event definition also contains an event name and type. The name is used in the output later on. Event types are used to let the programmer select which set of events should be used for a particular application. Thus, the pro-grammer can control whether JAVA events (in this case AWT-based input events) should be considered or not. Moreover, the programmer can decide whether to consider RMI events with or without encoding or to ignore them completely and rely on the actual calls that they would specify in an application-specific file.
Finally event definitions can include a set of flags to indicate how they should be processed. These are described in the next section since they are primarily relevant to tracking events.
The event tracking system maintains efficiency through preprocessing. It first reads in the event definition file when it starts up. It determines which events are relevant based on the event types and the programmer’s requests when event profiling was started. Then it takes each relevant event specification and finds the internal identity for all rel-evant methods. This identity will be the address of the method for C or C++ and the internal UID of the method from JVMPI for Java. The identities for the set of methods that then need to be checked is stored in a hash table. Doing this all as a preprocessing step ensures that the rele-vant method can be detected quickly during execution.
4. Tracking and Maintaining Events
Ideally, knowing the routine would be sufficient for event-based performance analysis. The system could just detect when a thread enters any of the routines associated with an event and create a new event record. Then it would record resource usage in this record while this event was in progress and then output the total information when the 1. We use the standard Java representation (as documented
in [6]) to differentiate overloaded methods by specifying their parameter types and created similar representation for C and C++.
<EVENTS>
<EVENT METHOD="dispatchEvent" CLASS="java/awt/MenuComponent"
SIGN="(Ljava/awt/AWTEvent;)V" NAME="AwtMenuEvent" TYPE="JAVA" /> <EVENT METHOD="dispatchEvent" CLASS="java/awt/Component"
SIGN="(Ljava/awt/AWTEvent;)V" NAME="AwtComponentEvent" TYPE="JAVA" /> <EVENT METHOD="dispatch" CLASS="java.awt.event.InvocationEvent"
SIGN="()V" NAME="AwtInvocationEvent" TYPE="JAVA" /> <EVENT METHOD="XNextEvent" NAME="X event" TYPE="X11" /> <EVENT METHOD="RIPget_input" NAME="BWE event" TYPE="BWE" /> <EVENT METHOD="process_message" SOURCE="/pro/field/msg/src/msgclient.c"
NAME="MSG event" TYPE="BWE" />
<EVENT METHOD="run" CLASS="sun.rmi.transport.tcp.TCPTransport$ConnectionHandler" SIGN="()V" NAME="RMI Invocation" TYPE="RMI" />
<EVENT METHOD="serviceCall" CLASS="sun.rmi.transport.Transport"
SIGN="(Ljava/rmi/server/RemoteCall;)Z" NAME="RMI Call" TYPE="RMIC" /> </EVENTS>
identified routine returned. Unfortunately, programs are not that simple.
One problem that arises in using calls to delineate events is that of nested calls. It is common in a Java event loop for the dispatchEvent method for one component to decide that this event is not relevant to this component and then to call the corresponding method on its parent compo-nent. To avoid this problem, we only check for calls that trigger new events when the current thread is not presently processing an event.
Another problem is that while routines are a convenient and accurate way of identifying events, they are not suffi-cient to detect when such events are being processed. In many reactive systems, when the events occur they first cause some initial processing and then cause a task to be placed on a queue. Later in the system execution another thread will take the task off the queue and do the requisite processing. The resources spent by this second thread should also be attributed to the particular event. This situa-tion can occur both with programmer-defined queues and processing as well as system processing. For example, Java Swing allows a event-processing routine to call the method invokeLater to have additional processing be done directly from Swing’s event loop.
We wanted to develop a general scheme that would catch most of this type of delayed processing and be able to assign resources appropriately to different threads. Based again on the analysis of a wide range of different server applications, we settled on using objects and their usage to track events.
To make this work we associate objects (or blocks of memory in a non-object-oriented system) with particular events. Then, if a thread is not processing any other event and starts doing some processing with an object that has previously been associated with an event, we make the assumption that the thread is again doing processing for that event. This can again be done by looking at the calls and returns of particular routines. That is, if a thread is not currently processing an event and a routine is called in that thread with an event-associated object as a key argument, then the thread becomes associated with that event for the duration of that routine call.
One problem here is identifying what is meant by a “key argument”. This can be done in a variety of ways. First one could let that the programmer identify the appropriate rou-tines that do subsequent processing of objects and identify which of their arguments are the appropriate ones. This approach is the most accurate, but it requires both work on the part of the programmer and a more detailed monitoring of execution than is provided by such interfaces as Java JVMPI.2
To find a more general and automatic alternative we looked at a broad range of server-type programs, both in C/ C++ and Java and found out that it was generally sufficient to detect calls where the event-based argument is the first parameter. For object-oriented languages, this means that a method on the event object is being invoked. In actuality, we found instances where the message content was passed as a parameter to what was the obvious routine that indi-cated processing was continuing rather than being invoked directly. However, in every such case, there was some sec-ondary routine that did the bulk of the processing where the message content was the first parameter.
Our actual implementation provides some of both of these approaches. We first let the programmer identify spe-cific routines that indicate continued processing of an event as part of the XML description files. However, we restrict this to methods on the event-associated object rather than looking at arbitrary arguments. Alternatively and by default, we will let any method called on an event-associ-ated object to trigger continued processing of the event provided that the thread doing the invocation is not cur-rently associated with an event. This can again be con-trolled by the programmer through the XML files, either by specifying specific routines or event types that should not be handled automatically.
One other problem arises in using objects to track events is that of false associations. It is conceivable that several of the objects allocated as part of an event are for general use and not associated with that particular event. If these objects are later used, the corresponding resources should not be associated with the originating event. How-ever, once a server is set up, almost all of the processing it does will be associated with one event or another. By only considering object-based events when no other event is associated with a thread, the system tends to identify the actual event that the thread is processing. In the various examples we have tried we have never seen such a false positive occur. However, we do let the programmer identify a restricted set of classes for each event type and limit the use of associated objects to these classes. Not only does this provide a means of avoiding false associations, but it makes the tracking and detection of events using objects more efficient.
False associations can also occur if objects are shared between events. This can happen if the application doesn’t
2. JVMPI is a standard Java interface for profiling. It pro-vides hooks for detecting events such as method entry and exit, allocations, monitor wait, and garbage collection. Its method entry events can either pass no parameters or the ‘this’ pointer; they do not include any of the other parame-ters.
reallocate objects that represent messages or commands for each event but instead reuses existing objects. While this doesn’t happen often, we have provided facilities in our framework whereby the programmer can flag routines that should change the event associated with their primary object to the current event. Since it is generally easy to find such a routine (the one that reinitializes the original object, for example), this mechanism is sufficient, albeit applica-tion specific to deal with these cases.
5. Implementation
To implement event monitoring as described above we need to distinguish and implement event descriptions and event instances. Event descriptions represent types of events. Each has an associated set of routines, an event type used to determine if the event is relevant to the program-mer, and a set of flags indicating how the event should be processed. The processing flags include:
• NO_OBJECTS. If this flag is set then no objects will be associated with events of this type. This is useful to optimize event analysis for those events that are pro-cessed completely within the scope of the routine call that creates them.
• ALLOW_REUSE. This flag indicates that the same routine might be called multiple times for a single event. It causes the object associated with the routine (the first argument, generally the this pointer) to be used to determine if there is a previous event or not.
• MARK_OBJECT. This flag provides a more selective way of identifying what objects are relevant to an event. If the routine associated with this flag is called when an event is being processed, the object associated with that call will become associated with the current event. Event instances are created dynamically when the system detects that an event has occurred for the first time. Each instance keeps track of the current set of stack frames that have made this event active. (Note that the same event might be active in multiple threads concurrently.) It also keeps track of the event descriptor associated with the event, the start and end time of the event, and all the resources used by the event.
Event-based performance analysis then works by track-ing actions in the program and maintaintrack-ing a current event for each active thread. The four basic actions that are con-sidered are method (or routine) entry, method exit, object allocation, and object free. We assume that entry and exit actions have an associated thread, method, object, and stack frame and that allocation and free actions have an associated thread and object.
Figure 3 shows the actions associated with a call action. The system first looks to see if there is an event associated
with the current thread. At worst this involves a hash lookup; typically it is handled directly since we cache the current thread and its event and the current call usually comes from the same thread as the previous call. If there is no current event, the system calls CheckForNewEvent. Here it uses a hash lookup to find the event descriptor asso-ciated with the called method. If this is defined, then it next looks at whether this routine reuses events. If so, it finds the event associated with the primary object. If there is no such event or if the routine doesn’t reuse events, then a new event instance is created and associated with the current thread. If no event descriptor is found for the called method, then the system checks the object associated with the call. If an event instance was previously defined for that object, then the instance is restarted.
Restarting or starting an event instance involves associ-ating the current stack frame with the instance. This is done by having each event keep a table of its current entry frames. A table is necessary here to because the event might be being processed in multiple threads concurrently, in which case there will be one frame for each of the active threads.
Finally, if is a current event, the routine CheckForMarks is invoked. This routine again checks if the method being called has an associated event descriptor and if that descriptor indicates that the ‘this’ parameter should be marked as belonging to the current event instance.
Figure 4 shows the actions associated with the other actions. When an exit occurs and an event is in progress, the system first adds the resources for the call to the statis-tics associated with the event and then checks if the exit corresponds to the call frame from whence the event was activated. Allocation actions check if there is a current event and that event needs to deal with objects and, if so, then it associates the current event with the given object. Finally, a free action causes any association with the object being freed to be removed.
There are a variety of techniques that can be used to track actions in the program in order to do event-based per-formance monitoring. First, one can patch the source or object code. Several profilers, including MIPS’ Pixie [15] work in this manner. This is preferred approach because it is probably the most efficient. However it is dif-ficult to do in general, especially for multiple languages and architectures.
A second approach is to use a profiling interface such as Java JVMPI or the procedure entry exit calls used in UNIX profiling. This is probably the simplest technique to work with because it should work across machines and much of the required tracing mechanisms already exist. The draw-backs here are in terms of performance (for JVMPI), and in the potential need for the programmer to recompile all the code and libraries to enable profiling.
A third approach is to generate trace data as the program runs and analyze this data after the run to for performance information. This approach is the most straightforward if the trace data is already available because it isolates the implementation of the above algorithms from the tricky process of data collection. However, it requires that the trace data be available, and generating trace data is gener-ally more complex and time consuming that either of the
previous approaches and would not be worth it unless it was to serve other uses as well.
As part of our program visualization efforts, we are already producing relatively complete execution traces for both C/C++ and Java programs [10,11]. These traces allow us to do detailed analysis and to correlate a variety of dif-ferent analysis on program runs. The underlying system provides a convenient framework for implementing trace
ENTER[action]
Let ce = CurrentEvent[action.thread] If ce == NULL then
Let ce = CheckForNewEvent[action] Else if any event has mark objects set then
CheckForMarks[action,ce] Endif
CheckForNewEvent[action]
Let ed = event descriptor associated with action.method If ed is defined then
Let ei = NULL; If ed allows reuse then
Let ei = the event instance associated with action.object Endif
If ei == NULL then
Let ei = new event instance[ed,action] Add action.frame to ei
Associate ei with action.thread Else
Add action.frame to ei Endif
Else if action.object is defined then
Let ei = the event instance associated with action.object If ei != NULL then
Add action.frame to ei Endif
Endif
CheckForMarks[action,ei]
Let ed = event descriptor associated with action.method If ed has mark object flag set then
Associate action.object with event ei Endif
FIGURE 3. Event processing for a call action
EXIT[action]
Let ei = event instance associated with action.thread If (ei != NULL) Then
Add performance statistics for this call to ei If action.frame is associated with ei Then
Set the event associated with action.thread to NULL Endif
Endif ALLOC[action]
Let ei = event instance associated with action.thread If ei != NULL and not ei has property NoObjects then
Associate ei with action.object Endif
FREE[action]
Remove any association with action.object
analyses and we used this framework for an initial imple-mentation of event-based performance analysis.
Our event-based performance analyzer thus reads program trace files, detects the four relevant types of actions, and tracks events and their associated resources. It generates an XML file that contains the particular program events with whatever identifying information is available along with the associated resources. An example of the output is shown in Figure 5. The top entry is from a C program while the bottom is a Java event. Both cases iden-tify the event type and time. For the Java event, the particu-lar object associated with the event is also recorded. (Information about that object is available in other analysis files.) After the event, the resource statistics are provided. We provide total, average, and standard deviations for each statistic. The different statistics shown here include TOTAL for the total execution time spent processing the event, REAL for the real time associated with the event, INSTS for the number of instructions executed during the event (for C/C++ only), ALLOCS for the number of allo-cations associated with the event, ASIZE for the size of allocations, UNFREES for the number of unfreed alloca-tions, UFSIZE for the size of the unfreed allocaalloca-tions, and, for Java, garbage collection statistics.
6. Reporting Event Information
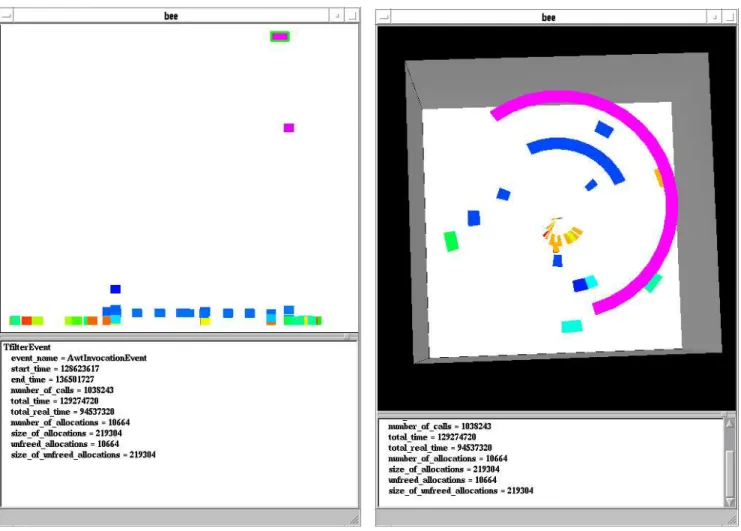
The system reports events in XML format so that the resultant information can be used by other programs, notably our software visualization system. [12,13]. Figure 6 shows two sample visualizations of the AWT events of a graphical editor associated with our visual query language [14].
In the first, time is displayed along the X axis and the run time used in processing the event along the Y. Color encodes the number of calls associated with the event. Its
very easy to spot the two events that took most of the pro-cessing run time and to note that these also involved the most calls.
The second diagram shows an alternate 3D view of the same events. Here time is shown as a spiral starting in the center, height is the number of calls, and color indicates the size of allocations done for the event. Again, the events that took the most time stand out and it is easy to see that the number of allocations correlates with the processing time of the events since the longer events tend to have colors that are in the blue-violet range while the shorter events are in the red-yellow range.
7. Experiences and Future Work
The event mechanism here has been tried on a variety of different programs and demonstrated its capability to iden-tify relevant events and show the resources used by the individual events. In addition to the example of Figure 6 which shows a interactive Java application, we have used it to find both X11 and message-based events in the FIELD programming environment [9], to find swing-based events in several other systems, and to find RMI-based events in different server frameworks.
The visualizations produced by the events convey the appropriate information. They are most useful in the context of the overall visualization system where they can be directly related to other visualizations which show what else is going on in the program when each event is being processed. For example, they have been used to track down why certain events (in particular a sequence of drag events to change the shape of a curve) took longer than expected. The visualization framework also allows events to be dynamically grouped in various ways (for example, by event type) to get summary information in more complex visualizations.
<EVENT START=’29653564’ END=’29760619’ NAME=’MSG event’> <STATS CALLS=’216’
TOTAL=’15921’ TOTALA=’73.70833333333333’ TOTALD=’621.077’ REAL=’321165’ REALA=’1486.875’ REALD=’12528.6’
INSTS=’2302596908657’ INSTSA=’10660170873.41204’ INSTSD=’5.17267e+10’ /> </EVENT>
<EVENT OBJECT=’X45199’ START=’37480829’ END=’97280175’ NAME=’RMI Invocation’> <STATS CALLS=’1189578’
TOTAL=’194081343734’ TOTALA=’163151.4232223528’ TOTALD=’2.64302e+07’ REAL=’818158598’ REALA=’687.7721326386333’ REALD=’113547’
ALLOCS=’91516’ ALLOCSA=’0.07693148326549415’ ALLOCSD=’0.976547’ ASIZE=’6841000’ ASIZEA=’5.750778847624956’ ASIZED=’124.083’
UNFREES=’4648’ UNFREESA=’0.003907267955527086’ UNFREESD=’0.102475’ UFSIZE=’182592’ UFSIZEA=’0.1534930874646303’ UFSIZED=’5.81694’ GC=’8’ GCTIME=’34318480554’ GCRTIME=’0’ />
</EVENT>
The code for our implementation is available as part of the BLOOM software visualization and understanding system at http://www.cs.brown.edu/research/softvis.
While these efforts demonstrate the potential for doing event-based performance analysis and software under-standing, there are several directions in which this can be pursued. The particular ones that we are currently looking at are:
• Supporting nested events as distinct. Right now we only view a thread as processing a single event at one time. Actually, if we allow a variety of event types, it is possi-ble for a thread to be associated with multiple events of different types at one time. Ideally, the underlying framework should support this.
• Allowing event continuation to be detected using calls that do not rely on the associated object being the first argument. This restriction is implicit in the use of JVMPI for Java profiling, but can be avoided with other technologies. Moreover, there are applications where
the relevant object is not invoked directly and event continuation cannot be detected using the existing framework.
• Extending this framework to handle multiple process programs. Here one would like to track an event across applications. For example, one would like to take an input event in the client and include in the performance summary all the RMI calls and resources used in the server. This requires either detailed post-processing analysis or an slightly augmented version of RMI. It can also be done at a lower level by tracking input and output operations between processes, associating a message written by one process with the current event of that process and then transferring that event to the other process when the same data is read back in. Even without these extensions the current system has demonstrated both the practicality and the utility of doing event-based performance analysis and understanding for reactive systems.
8. Acknowledgements
This work was done with support from the National Science Foundation through grants ACI9982266, CCR9988141, and CCR9702188 and with the generous support of Sun Microsystems. Significant advice and feed-back was provided by Manos Renieris.
9. References
1. Ziya Aral and Ilya Gertner, “Non-intrusive and interactive profiling in Parasight,” Proc. ACM/SIGPLAN COnf. on Parallel
Programming, pp. 21-30 (January 1998).
2. Bryan M. Cantrill and Thomas W. Doeppner, Jr., “Threadmon: a tool for monitoring multithreaded program performance,” Proc. 30th Hawaii Intl. Conf. on Systems Sciences, pp. 253-265 (January 1997).
3. Michael M. Gorlick, “The flight recorder: an architecture for system monitoring,” ACM/ONR Workshop on Parallel and
Distributed Debugging, pp. 175-183 (DEcember 1991).
4. S. L. Graham, P. B. Kessler, and M. K. McKusick, “gprof: A call graph execution profiler,” SIGPLAN Notices Vol. 17(6) pp. 120-126 (June 1982).
5. Minwean Ji, Edward W. Felten, and Kai Li, “Performance measurements for multithreaded programs,” Proc. ACM
SIGMETRICS/Performance ’98, pp. 161-170 (August 1998).
6. Tim Lindholm and Frank Yellin, The Java Virtual Machine
Specification, Second Edition, Addison-Wesley (1999).
7. Wim De Pauw and Gary Sevitsky, “Visualizing reference patterns for solving memory leaks in Java,” in Proceedings of the
ECOOP ’99 European Conference on Object-oriented Programming, (1999).
8. Wim De Pauw, Nick Mitchell, Martin Robillard, Gary Sevitsky, and Harini Srinivasan, “Drive-by analysis of running programs,” Proc. ICSE Workshop of Software Visualization, (May 2001).
9. Steven P. Reiss, FIELD: A Friendly Integrated Environment
for Learning and Development, Kluwer (1994).
10. Steven P. Reiss and Manos Renieris, “Generating Java trace data,” Proc Java Grande, (June 2000).
11. Steven P. Reiss and Manos Renieris, “Encoding program executions,” Proc ICSE 2001, (May 2001).
12. Steven P. Reiss, “Bee/Hive: a software visualization backend,” IEEE Workshop on Software Visualization, (May 2001).
13. Steven P. Reiss, “An overview of BLOOM,” PASTE ’01, (June 2001).
14. Steven P. Reiss, “A visual query language for software visualization,” IEEE 2002 Symposium on Human Centric
Computing Languages and Environments, pp. 80-82 (September
2002).
15. MIPS Computer Systems, Inc., RISCompiler Languages