New Page 1
Police Fire Schools Library
Parks & Recreation Planning & Building
● Building Division ● Community Development Code ● Development Review ● Long Range Planning ❍ ... ● Forms, Applications & Permits ● Planning Commission Public Works Service Index Contact Us Directory
Transportation System Plan
Home City Services Planning & Building Long Range Planning
Transportation System Plan
Table of Contents
The Transportation System Plan for West Linn proposes that the City have a balanced, integrated transportation system which promotes ease of use for car drivers, pedestrians, bicyclists, and transit users. All except the street element, dealing with
automotive traffic, was adopted by the City Council in 1998. The street element (Chapter 3 in the document) was adopted in 2000.
Introduction & Summary Future Needs Analysis Circulation and Capacity Needs Assessment of Need
Alternative Performance Measures Existing Conditions
Street Network
Existing Travel Activity Existing Service Levels Street System Summary Planned Transportation Improvements
Recommended Plan Functional Classifications Connectivity/Local Street Plan Recommended Improvement Plan Access Management
Safety
Maintenance
Neighborhood Traffic Management Transportation System
Management Travel Demand Forecast
Projected Land Uses
Metro Area Travel Demand Model
Introduction & Summary
Introduction & Summary
The West Linn Transportation System Plan (TSP) has been developed to bring an earlier 1991 City Transportation Plan into compliance with the Oregon Transportation Planning Rule adopted that same year. Last year, the city adopted their TSP with all of the required elements except for Chapter 3: Street Element. This report presents the updated technical information and recommendations for that chapter. The overall West Linn TSP is a multi-modal plan, addressing improvement to existing roadways, new pedestrian and bicycle facilities, improvement in public transit service, and transportation demand
management (TDM) strategies. The plan also includes a transportation improvement program, as well as changes to West Linn codes and standards to implement the TSP recommendations. This new report was developed to integrate with the findings and recommendations from the 1998 TSP.
Street Element Development Process
The updated West Linn Street Element was prepared concurrently with the update to the city’s
Comprehensive Plan. A committee of citizens and local merchants was assembled by the city and given the title West Linn Tomorrow! Task Force to oversee the development of these two plans. The land use review process conducted during the Comprehensive Plan update was fed directly into the travel
forecasts made for this street element update. The task force reviewed, on a monthly basis, the on-going work products that include goals, policies, and implementing plans and standards.
A technical advisory committee (TAC) also assisted in the development of both plans. The TAC
members included representatives from the City of West Linn, Oregon City, Lake Oswego, Clackamas County, ODOT, Tri-Met, and Metro.
Findings
This transportation planning report presents Chapter 3: Street Element of the West Linn Transportation System Plan. The most significant findings in the report include the following:
1. Peak hour traffic conditions at intersections with traffic signals on Highway 43 operate at Level of Service D or better based on traffic volumes observed in 1998.
2. Many intersections without traffic signals have substantial delays for side street traffic during peak hours, but only two location have sufficiently high volumes to warrant traffic signal controls (the two intersections on 10th Street at the I-205 freeway ramps).
3. The majority of peak hour travel on Highway 43 is traffic with local destinations or origins. The component of "through" traffic from other jurisdictions is only about 10 percent of the total volume.
Introduction & Summary
4. The highest number of reported accidents in the city between 1995 and 1997 occurred at the intersection of 10th Street and 8th Avenue.
5. Local street connectivity east of Highway 43 and in the Tanner Basin is limited because of topographic constraints and past decisions about public street connections.
6. Forecasted 2020 traffic volumes on Highway 43, Interstate 205, and 10th Street will exceed planned capacity for these facilities during peak travel periods.
7. Traffic diversion away from Interstate 205 onto parallel street facilities during congested periods will continue to increase to the point where peak hour traffic on Willamette Falls Drive will more than double relative to current volumes.
8. Widening Highway 43 to accommodate 2020 travel demands was not supported by the reviewing citizen committee. A five-lane facility also runs contrary to the goals of the pedestrian-oriented Opportunity Areas located in Robinwood and Bolton neigborhoods.
Recommendations
The recommendations of this report include the following major components:
1. Modifications to the street functional classification system to reflect current street function and development patterns, in particular, changes between the collector and neighborhood route designations for certain streets. (See Functional Classification Map)
2. Modification to the city street standards, to include a narrower local street width option, the regional street design standards, and access spacing criteria. (See Sample Street Cross-Sections) 3. Identification of signal system and intersection improvements to increase capacity in the roadway
system at traffic congestion locations.
4. Additional local street connections and spacing standards to comply with Metro Title 6
requirements and to reduce out-of-direction travel, vehicle emissions, and travel time. (See Local Street Connectivity Map).
5. Expansion of the Highway 43 Access Management Plan previously begun in 1991 to specify future traffic controls, access restrictions, and signal system controls so that the corridor can be safely and efficiently operated within a three-lane road cross-section.
6. Recommendations for street performance and access spacing standards to guide periodic review of street improvement prioritization and new land development applications. Two tiers of
performance standards are suggested for the city to separate out the policies for monitoring travel on Highway 43 from all other city street facilities.
7. Augment the city’s development code to specify traffic impact study guidelines to be used with development applications.
8. Expand the current ad hoc Neighborhood Traffic Management practice to a formal city program to provide a documented framework for implementing neighborhood traffic controls.
9. Periodic review of the city’s traffic safety conditions based on vehicle collision data provided by the Oregon Department of Transportation.
10. Provide sufficient annual funding to maintain pavement conditions on the city’s arterial, collector and neighborhood route streets.
Introduction & Summary
11. Further engineering study of the 10th Street Corridor to review and select a preferred design alternative to comply with the National Environmental Protection Act requirements.
The recommended street improvement program included 32 street projects to be implemented over the next 20 years, totaling about $27 million dollars. These street projects have been prioritized for
implementation for the short-term and long-term time frames. The street element of the TSP is consistent with Metro’s Regional Framework and Transportation Plans and the Clackamas County Transportation Plan.
Contact Us | Return to Home Page
Existing Conditions
Existing Conditions
This chapter summarizes existing traffic and transportation conditions in the City of West Linn. Field observations and traffic data were recorded to better understand a typical day’s activity on the city's
transportation system. An inventory of traffic behavior was made during spring and summer of 1998 to establish a base line for all subsequent analysis. Much of this data provides a benchmark (basis of comparison) for
assessment of transportation performance relative to desired policies.
The following sections briefly describe existing roadway functions, circulation, traffic speeds, traffic volumes and levels of service in the West Linn transportation system.
Street Network
The Transportation Planning Rule requires that classification of streets within the City be provided. The classification must be consistent with state and regional transportation plans for continuity between adjacent jurisdictions. The City of West Linn developed a street classification system as part of its 1991
Transportation Plan.
Functional Classification
Roadways have two functions, to provide mobility and to provide access. From a design perspective, these functions can be incompatible since high or continuous speeds are desirable for mobility, while low speeds are more desirable for land access. Arterials emphasize a high level of mobility for through movement; local
facilities emphasize the land access function; and collectors offer a balance of both functions. The prior adopted functional classification of streets in West Linn is represented by Figure 3-1. Any street not designated as either an arterial or collector is considered a local street.
Clackamas County
roadway classifications are generally consistent with City of West Linn designations. A table summarizing functional classification of West Linn streets by other jurisdictions is shown in the appendix of this report. ODOT
and Metro only classify roads that are considered to be of statewide or regional significance, respectively. These classifications are compatible with West Linn classifications, although the specific classification names may differ. ODOT and Metro classifications can be found in the Roadway Functional Classification According to Jurisdiction table in the appendix of this report. Metro classifications are from the Regional Motor Vehicle System map. Several roadways that West Linn and Clackamas County consider Minor Arterials Metro classifies as Collectors of Regional Significance. These were assumed to be compatible classifications (i.e. these were not called out as differing classifications).
Existing Conditions
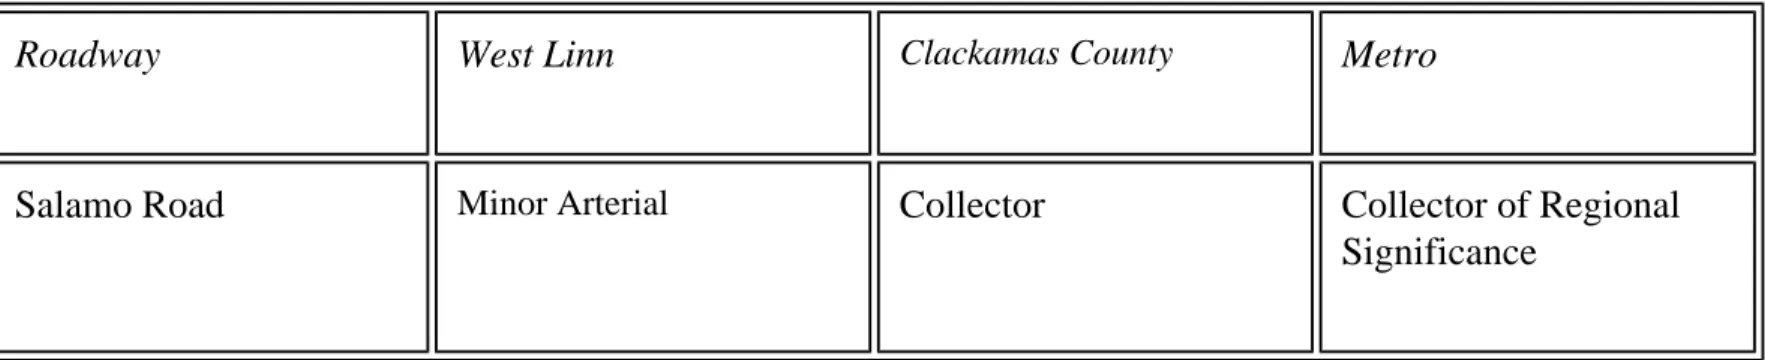
The following table summarizes key differences between West Linn’s Functional Classification System and that of Clackamas County and Metro. The only real difference is in the classification of Salamo Road. West Linn considers Salamo Road a minor arterial, while Clackamas County considers it a collector. This difference is likely due to the fact that during the development of the Tanner Basin Master Plan, both Tannler Drive or Salamo Road were considered for the key access roadway between the 10th Street area and Tanner Basin. Salamo Road was eventually chosen as the primary access route; however, the County’s Functional Classification system pre-dates this decision.
Table 3-1: Functional Class Differences Between Agencies
Roadway West Linn Clackamas County Metro
Salamo Road Minor Arterial Collector Collector of Regional
Significance
Figure 3-1: Current Functional Classification
Access Management
There is one major corridor in West Linn where some form of access management has been applied. This corridor is Highway 43, which has a significant portion of its frontage occupied by commercial and residential land uses. Previous work conducted for the City of West Linn identified an access management strategy for Highway 43 that included both capacity improvements and an access management policy. The city has included annual capital budget funding to implement the recommended management measures. The first stage of these improvements are under construction near Elliot Street as part of the new traffic signal installed at that location.
Contact Us | Return to Home Page
Existing Travel Activity
Existing Travel Activity
The existing transportation activity on the city’s transportation system was measured by collecting field data to review existing traffic speeds, volumes, travel times, and travel patterns during weekday peak hours. This data was analyzed and the findings are presented in the next section to determine how well the existing system meets today’s travel demands.
Traffic Speeds
Speed zones within the City of West Linn are summarized in Figure 3-2. There are two ways a speed zone can be established by statute. One is in a "residence district," which is vaguely defined in the
Oregon Vehicle code under 801.430, and the other is a school zone. A residence district can be posted at 25 mph and a school zone can be posted at 20 mph.
In all other cases, an engineering study is required to determine the appropriate speed zone (the basis is the 85th percentile speed). The study is typically done by the appropriate ODOT region office. The speed zone recommendation (based on the engineering study) is then forwarded from the ODOT region office to Salem to be approved by the State Traffic Engineer. If the jurisdiction requesting the speed study does not agree with the results of the engineering study and recommendation to the State Traffic Engineer, the jurisdiction can appeal the decision to the Speed Zone Review Panel. This panel only meets once a year to review appealed speed zone requests. For perspective on the magnitude of what this board does, this panel reviewed only four cases for the entire state of Oregon in 1997.
Vehicle speeds on several collector and residential streets are a concern for the community. As examples, the following streets have received numerous speeding complaints: Rosemont Road, 19th Street, Tannler Drive, and Salamo Road. In most cases, speeding becomes very noticeable when it is above 30-35 miles per hour. Speeding can usually be expected on local streets where the streets are wide and straight for long stretches or where downhill grades are extended.
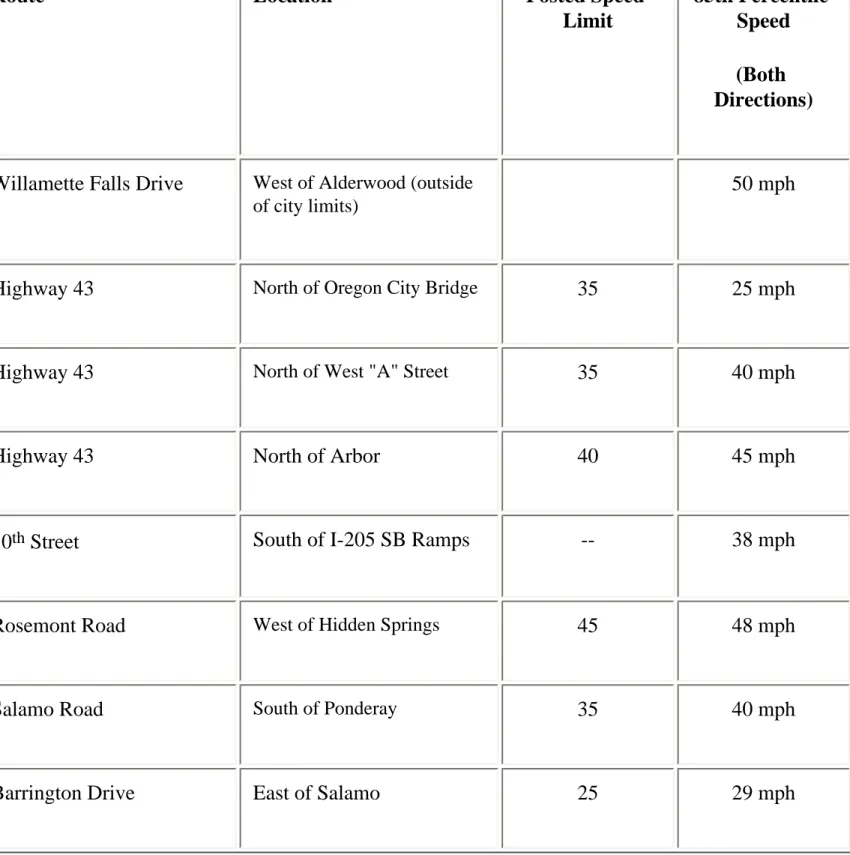
Speed surveys were conducted on several roadways in West Linn for this study. Table 3-2 summarizes the results of these surveys, showing the posted speed limit and the 85th percentile speed on each route. The 85th percentile speed represents the speed at which 85 percent of the vehicles are traveling slower and 15 percent of the vehicles are traveling faster. The 85th percentile speed is typically used as the posted speed and the speed that is used for traffic engineering analysis (i.e. for sight distance
calculations, etc.).
Table 3-2: Selected Traffic Speeds Surveys
Existing Travel Activity
Route Location Posted Speed
Limit
85th Percentile Speed (Both Directions)
Willamette Falls Drive West of Alderwood (outside of city limits)
50 mph
Highway 43 North of Oregon City Bridge 35 25 mph
Highway 43 North of West "A" Street 35 40 mph
Highway 43 North of Arbor 40 45 mph
10th Street South of I-205 SB Ramps -- 38 mph
Rosemont Road West of Hidden Springs 45 48 mph
Salamo Road South of Ponderay 35 40 mph
Barrington Drive East of Salamo 25 29 mph
Figure 3-2: Existing Speed Zones Traffic Volume
A complete inventory of peak hour traffic conditions was performed in the spring of 1998. The traffic counts conducted as part of this inventory provide the basis for analyzing existing problem areas as well
Existing Travel Activity
as establishing a base condition for future monitoring. The City of West Linn conducted morning (7:00 to 9:00 AM) and evening (4:00 to 6:00 PM) peak period turning movement counts at 26 locations to determine intersection operating conditions. Typically, the traffic volumes during the evening peak period are the highest hourly volumes of the day because of commute, retail and school activities all occur during that period.
On a typical day, I-205, Highway 43, Willamette Falls Drive, 10th Street, Salamo Road, Rosemont Road, and Hidden Springs Road are the most heavily traveled streets in West Linn. Overall, based on traffic counts at gateways to the City, about 73,000 vehicles enter and exit West Linn (about half in and half out) in a given day. As a comparison, daily traffic on I-205 is about 83,000 vehicles per day near the 10th Street interchange. Figure 3-3 shows average daily traffic (ADT) and peak hour volumes on several routes in West Linn.
Traffic data collected for this study were compiled into hourly volume charts that illustrate the typical fluctuations of traffic over the course of a day (see Technical Appendix). These charts show that traffic volumes generally tend to increase over the course of the day (through the evening peak period).Typical residential and regional routes areas are shown. These streets generally tend to peak in the morning and evening peak (commute) hours.
Figure 3-3: Existing Traffic Volumes Traffic Control
West Linn has six signalized intersections within the city limits (another signal is under construction on Highway 43 at Elliott Street). All six are located along Highway43 and they are owned and operated by the Oregon Department of Transportation. Intersection control is also accommodated by two-way, three-way or four-three-way stop signs. Figure 3-4 shows the signalized and all-three-way-stop controlled locations in the study area.
Traffic signals are valuable devices for the control of vehicle and pedestrian traffic. Properly located and operated traffic control signals can have one or more of the following advantages:
Advantages of Traffic Signal Control
● They provide for the orderly movement of traffic
● Where proper physical layouts and control measures are used, they can increase the traffic handling capacity of the intersection
● They reduce the frequency of certain types of accidents, especially right angle type
● Under favorable conditions, they can be coordinated to provide continuous or nearly continuous movement of traffic at a definite speed along a given route
● They permit minor street traffic, vehicular or pedestrian, to enter or cross continuous traffic on the major street
Existing Travel Activity
Improper or unwarranted signal installations may cause the following disadvantages: Disadvantages of Traffic Signal Control At Unwarranted Locations
● Excessive delay
● Disobedience of signal indications ● Circuitous travel of alternative routes
● Increased accident frequency, particularly rear-end type
Consequently, it is important that the consideration of a signal installation and the selection of
equipment be preceded by a thorough study and based on consistent criteria. The study must identify the need for left turn phasing, lanes and phase type. The justification for the installation of a traffic signal at an intersection should be based upon the warrants stated in the Manual on Uniform Traffic Control Devices (MUTCD). The MUTCD has been adopted by the State of Oregon and is used throughout the nation.
Figure 3-4: Existing Traffic Control
The same requirements for signalized intersections hold true for installation of stop sign traffic controls. Specific warrants identify conditions that may warrant two-way or multi-way stop sign installations. A stop sign is not a cure-all and is not a substitute for other traffic control devices. Guidelines and warrants for stop sign installations are outlined in the MUTCD.
Contact Us | Return to Home Page
Existing Service Levels
Existing Service Levels
The following sections review the performance of various key routes in West Linn in terms of volumes, capacity, accidents, intersection level of service, arterial level of service and general observations. The information is organized to provide a description in terms of functional classification, number of lanes, existing traffic volumes, accident locations and a summary of peak hour operating conditions. The calculations are based on the 1994 Highway Capacity Manual. Level of service calculation sheets are provided in a separate Technical Appendix.
Traffic Service Levels
Traffic volume analysis provides better understanding of the general nature of traffic in an area, but by itself indicates neither the ability of the street network to carry additional traffic nor the quality of service afforded by the street facilities. For this, the concept of level of service has been developed to subjectively describe traffic performance at intersections.
Levels of service categories are similar to report card ratings for intersection traffic performance. Intersections are the controlling bottlenecks of traffic flow and the ability of a roadway system to carry traffic efficiently is nearly always diminished in their vicinities.
Definition of Level of Service
. Level of service (LOS) is used as a measure of effectiveness for intersection operation. It is similar to a "report card" rating based upon average vehicle delay. Level of service A, B, and C indicate conditions where vehicles can move freely. Level of service D and E are progressively worse. Level of service F represents conditions where traffic volumes exceed the capacity of a specific movement. Level of service D or better is generally desirable for signalized intersections. Unsignalized intersections provide levels of service for major and minor street turning movements. For this reason, LOS E and even LOS F can be acceptable under conditions where traffic signal controls are not warranted or would adversely affect intersection operations. Levels of service descriptions for intersections are summarized in the appendix.
Evaluating Intersections Without Traffic Signals.
The unsignalized intersection level of service calculation evaluates each movement separately to identify problems (typically left turns from side streets). The calculation is based on the average stopped delay per vehicle for stop controlled movements. Level of service F indicates that there are insufficient gaps of suitable size to allow minor street traffic to safely enter or cross the major street. This is generally evident by long delays and queuing on the minor street. Level of service F may also result in more aggressive driving, with side street vehicles accepting shorter gaps. In such cases, some increase in conflicts and disruption to major street traffic can result. It should be noted that the major street traffic can still move effectively when LOS F is indicated for side street left turns, and that the side street volume may be only a small percentage of the total intersection volume. It is for these reasons that level of service results must be interpreted differently for signalized and unsignalized locations.
Table 3-3: 1998 Intersection Conditions
Existing Service Levels
AM Peak* PM Peak*
Intersection Delay LOS V/C Delay LOS V/C
Traffic Signal Controls (Average Condition for All Traffic Movements)
Highway 43/Marylhurst Drive 8.5 B 0.75 8.5 B 0.75
Highway 43/Cedar Oak Drive 17.3 C 0.94 4.6 A 0.64
Highway 43/Hidden Springs Road 10.8 B 0.68 10.8 B 0.78
Highway 43/McKillican Street 12.7 B 0.78 14.0 B 0.90
Highway 43/I-205 SB Ramps 15.5 C 0.67 27.5 D 0.95
Highway 43/I-205 NB Ramps 9.2 B 0.39 8.9 B 0.35
STOP Sign Controls (Major Street/Minor Street Most Delayed Movement)
10th Street/Blankenship-Salamo A/D A/D
10th Street/I-205 NB Ramps B/E A/F
10th Street/I-205 SB Ramps B/F A/F
Cornwall Street/Lancaster Road A/A A/A
Existing Service Levels
Highway 43/Dillow Road B/D B/D
Highway 43/Failing Street ** B/E B/E
Highway 43/Jolie Pointe B/E B/D
Highway 43/Mapleton B/C B/E
Highway 43/Pimlico Drive B/D B/F
Highway 43/West "A" Street ** B/F B/E
Highway 43/Willamette Falls Drive A/F A/F
Rosemont Road/Hidden Springs Road A/B A/B
Willamette Falls Drive/12th Street A/B B/B
Willamette Falls Drive/Dollar Street A/C A/C
Willamette Falls Drive/Sunset Avenue A/C A/C
Willamette Falls Drive/West "A" Street
A/D A/D
All-Way Stop Controlled Intersections (Average for All Movements)
Rosemont Road/Salamo Road A B
Existing Service Levels
Summit Street/Rosemont Road B A
10th Street/Willamette Falls Drive D C
*
Intersection LOS: Delay = Average Delay per Vehicle, LOS = Level of Service, V/C = Volume-to-Capacity Ratio
** Traffic signal controls under construction at Highway 43 and Elliott Street to remedy these poor conditions.
All signalized study intersections operate at LOS D or better in both peak hours. Field observations showed that the intersection of Highway 43/Hidden Springs intermittently generates southbound vehicle queues which extend back to the Highway 43/ Cedaroak Drive intersection, approximately 600 feet away, which creates poor operating conditions at both intersections. This queuing problem is not detectable in the intersection level of service
calculation (since the calculation is based on the volume that does pass through the intersection), but it is included in the travel time surveys conducted along Highway 43.
Many of the study area intersections controlled by STOP signs operate at level of service D or better during the evening peak hour; however, several intersections operate at LOS E or F for the minor street left turn movement in either the AM or PM peak hour (or both).
Intersection improvements are planned in the West Linn Capital Improvement Plan (1999-2001) for the following locations:
❍ Highway 43/Willamette Falls Drive Signal
❍ Highway 43/West "A" Signal (includes realignment with Elliott Street) ❍ Highway 43/Pimlico Signal
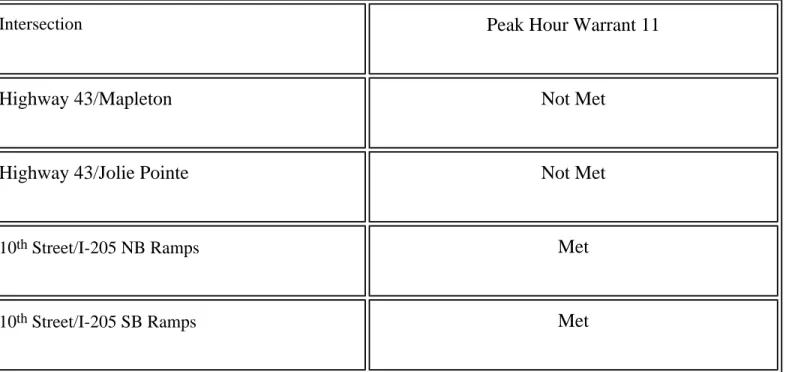
Other locations controlled by STOP signs that showed substantial delays for side street traffic during peak hours were reviewed to determine if traffic controls were appropriate. The standard for this assessment is published in the Manual on Uniform Traffic Control Devices (MUTCD). The traffic signal warrant number 11 (Peak Hour Volume Warrants) was checked for each STOP controlled intersection that operates at LOS E or F that is not scheduled for improvements. The results summarized below show that traffic signal controls are justified in the short-term at the 10th Street interchange. Detailed studies (further warrant checks) should be conducted at each of these locations to determine whether traffic signals should be installed at either or both of these intersections. The initial indication is that traffic signal controls are justified today at these two ramp junctions.
Table 3-4: Traffic Signal Warrant Review
Existing Service Levels
Intersection Peak Hour Warrant 11
Highway 43/Mapleton Not Met
Highway 43/Jolie Pointe Not Met
10th Street/I-205 NB Ramps Met
10th Street/I-205 SB Ramps Met
Highway 43 Traffic Performance
In addition to the traffic speed and volume data collected throughout the city, supplemental data was surveyed on Highway 43 to further understand how the city’s only principal arterial operates. The additional data included measurements of travel times, the mix of local and through traffic using the facility, and the number of occupants in each vehicle. These supplemental surveys were taken during peak commute periods since these are typically the most busy periods of the day for this facility.
Peak Hour Travel Speed
Vehicle travel speed information was collected as another indicator of roadway system performance on Highway 43. Travel time runs were conducted on Highway 43 between the Oregon City Bridge and Interstate 205 and the northern city limits during the PM peak period on a typical weekday. The surveys were limited to the p.m. peak hour since future travel forecasts can be made only during that period using the Metro travel demand model, and this information will be used as a baseline condition.
Arterial level of service was calculated according to the methods presented in the 1998 Highway Capacity Manual. The arterial performance is based on the average vehicle travel speed whereas the intersection level of service, as discussed in a later section, is based on average delay per vehicle. Overall, average evening peak hour travel speed southbound on Highway 43 ranged from about 12 miles per hour north of Hidden Springs Road to 34 miles per hour between Hidden Springs Road and Failing Street. Travel speeds in the opposite direction were generally higher, especially north of Hidden Springs Road. More information on level of service descriptions and calculations (both arterial and intersections) can be found in the appendix.
Table 3-5: Highway 43 Average Travel Speeds – PM Peak Hour
Existing Service Levels
Segment Boundary Northbound Southbound
Speed Level of
Service
Speed Level of
Service
Marylhurst to Hidden Springs 26 B 12 E
Hidden Springs to Failing 36 A 34 A
Failing to Oregon City Bridge 22 C 20 C
Overall Average 27 B 23 C
Source: Travel speeds sampled during weekdays in September 1998 during peak commute hours when schools was in session. Level of service based on Highway Capacity Manual methodology (Chapter 11) for Class 3 arterial facilities.
Origin-Destination Survey
Travel patterns were monitored on Highway 43 at three observation stations to determine the mix of local versus "through" traffic using this facility. Through traffic is defined as vehicles that do not begin or end their trips within the city limits, but use the highway as a regional facility to reach outside destinations. Video cameras were used to observe vehicle license plates during the peak hour of travel in the peak direction, i.e. northbound in the AM peak hour and southbound in the PM peak hour.
Table 3-6: Highway 43 Travel Patterns
Travel Description AM Peak Hour PM Peak Hour
Northbound Southbound
Existing Service Levels
Enters/Leaves City at Oregon City Bridge 100% 10%
Accesses onto I-205 78% 24%
Local Destination between I-205 and North City Limit 9% 66%
Leaves/Enters City at North City Limits 13% 100%
Travel Stream Components
Local Traffic (trip ends within the city) 9% 66%
Through Traffic (to/from Oregon City) 13% 10%
Through Traffic using I-205 78% 24%
Source: Traffic surveys taken in September 1998.
The findings summarized in the above table show that nearly 80 percent of the traffic crossing the Oregon City Bridge turned onto Interstate 205. Approximately 9 percent continued north on Highway 43 and made local stops, and the remaining 13 percent continued through to the northern city limit. In the opposite travel direction, 66 percent of the southbound traffic entering the corridor across the north city limit had local destinations during the p. m. peak hour. Approximately 24 percent traveled the length of Highway 43 than turned onto Interstate 205. The remaining 10 percent continued south all the way through the city to the Oregon City Bridge. In the morning peak hour, the reverse pattern did not occur. This data clearly shows that through traffic along the length of Highway 43 between Oregon City and Lake Oswego is a relatively small proportion of the total travel during peak hours. The majority of vehicles on Highway 43 have either local origins or destinations.
Average Vehicle Occupancy
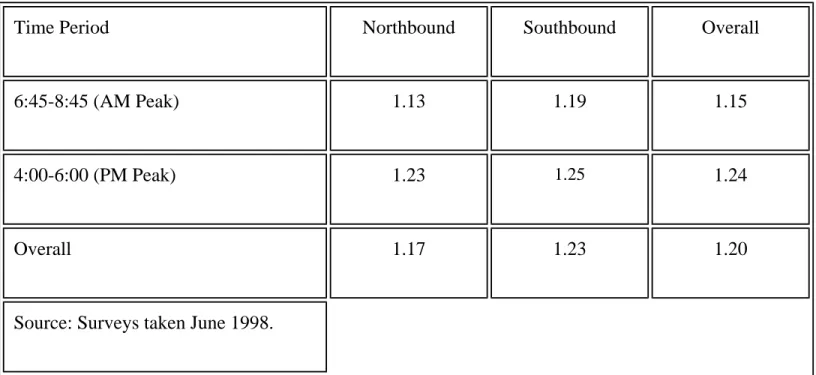
Average vehicle occupancy (AVO) was measured on Highway 43 north of Hidden Springs Road during both the morning and evening peak periods. Overall AVO measured at this location (in both directions, over both time periods) was 1.20. This rate is somewhat lower than observed typical ranges for auto occupancy in other suburban locations that range from about 1.31 to 1.54. A breakdown by time and direction is shown in the table on the next page.
Existing Service Levels
Table 3-7: Highway 43 Average Vehicle Occupancy
Time Period Northbound Southbound Overall
6:45-8:45 (AM Peak) 1.13 1.19 1.15
4:00-6:00 (PM Peak) 1.23 1.25 1.24
Overall 1.17 1.23 1.20
Source: Surveys taken June 1998.
Traffic Collision History
Reported vehicle collision data was obtained from the Oregon Department of Transportation Accident Data Unit for the period between January 1, 1995 and December 31, 1997. The table below summarizes collision severity, type, and frequency over this period within the City of West Linn. No fatal collisions were reported during the study period. Injury collisions have remained relatively constant, ranging from 57 to 66 occurrences each year. Property damage only collisions have actually dropped in the last reported year to 46 collisions, down from a high of 68 in 1995.
Table 3-8: West Linn Vehicle Collision Summary (1995-1997) Year Fatalities Major/Minor
Injury Property Damage Only Total 1995 0 57 68 125 1996 0 66 61 127 1997 0 66 46 112 Total 0 http://www.ci.west-linn.or.us/Services/Planning/longrange/TransportationPlan/htmls/tspservlev.htm (8 of 9)1/17/2006 3:52:51 AM
Existing Service Levels
Source: Oregon Department of Transportation, Accident Data Unit. Refer to Figure 3-5 for locations of collisions at intersections.
Figure 3-5 shows the locations for recorded collisions within 150 feet of an intersection. Only locations with more
than one reported collision between 1995 and 1997 are shown. The top ten intersections with the highest total number of collisions are:
Top Ten Vehicle Collision Intersections Highway 43 at Interstate 205 (2 intersections)
❍ 10th Street at 8th Avenue
❍ West "A" Street at Skyline Drive ❍ West "A" Street at McKillican Street ❍ Willamette Falls Drive at 12th Street ❍ Highway 43 at Cedaroak Drive ❍ Highway 43 at Arbor Drive
❍ Highway 43 at Hidden Springs Road ❍ Highway 43 at McKillican-Hood
Contact Us | Return to Home Page
Street System Summary
Street System Summary
West Linn major street facilities are described in the following section as to their functional classification, connectivity, volumes and speeds under existing conditions. Table 3-9 provides a summary matrix for reference.
Interstate Facilities
Interstate 205
is classified by ODOT as a State Highway with Interstate Level of Importance (LOI). It is classified as a Principal Arterial (Freeway) by Metro, as a Freeway/Expressway by Clackamas County and as a Principal Route by West Linn. I-205 provides a by-pass route to I-5 through the Portland
Metropolitan region and provides access to areas east of Portland and Vancouver proper. It connects between Tualatin and Vancouver. Near West Linn, it is two lanes in each direction. I-205 provides access between West Linn, the rest of the Portland region and other interstate routes. I-205 carries about 83,300 vehicles daily just east of the 10th Street interchange.
Arterial Facilities
Highway 43 (ORE 43)
is classified by ODOT as a District Level State Highway. It is posted and known locally as Willamette Drive but has been shown on old or non-local maps by various names to include Pacific Highway, Oswego Highway, and Portland Avenue. It is classified by Metro, Clackamas County and West Linn as a Major Arterial. Highway 43 provides access from West Linn to destinations north of town including Lake Oswego, the John’s Landing area of Portland, the Sellwood Bridge and downtown Portland. It is a two-lane, two-way street with bike lanes and sidewalks along most of its frontage and a posted speed of 45 miles per hour north of Cedaroak Drive and 35 miles per hour south of Cedaroak Drive. It carries approximately 21,000 ADT (Average Daily
Traffic) at the northern city limit line, with about 1,650 vehicles (two-way) during the evening peak hour. Just north of the Oregon City/West Linn Bridge, Highway 43 carries about 13,500 ADT, with about 1,200 during the evening peak hour.
Hidden Springs Road
is classified as a Minor Arterial by both Clackamas County and West Linn. It is a two-lane, two-way roadway, with left turn lanes at key locations. Its frontage is primarily residential. It has a posted speed of 25 miles per hour and generally has sidewalks on both sides. It carries about 2,450 vehicles daily near Rosemont Road and about 6,300 near Highway 43, with about 250 and 650 vehicles (two-way) during the evening peak hour, respectively.
Pimlico Drive
is classified by Clackamas County as a Minor Arterial between Summit Street and Highway 43 and as a Collector for the remainder of its length. It is http://www.ci.west-linn.or.us/Services/Planning/longrange/TransportationPlan/htmls/tspstrsys.htm (1 of 5)1/17/2006 3:52:57 AM
Street System Summary
classified as a Collector by West Linn. Pimlico Drive has a posted speed of 25 miles per hour. Pimlico Drive is generally fronted by residential development. It carries about 3,250 vehicles daily near Highway 43, with about 325 vehicles (two-way) during the evening peak hour.
West "A" Street
is classified as a Minor Arterial by both Clackamas County and West Linn. It is a two-lane, two-way roadway with a posted speed of 25 miles per hour. This roadway provides access to West Linn High School and residential areas in West Linn. It carries about 2,350 vehicles daily near Highway 43 (to the south) and about 1,000 vehicles daily near Highway 43 (to the north), with about 235 and 100 vehicles (two-way) during the evening peak hour,
respectively.
Willamette Falls Drive
is classified by Metro, Clackamas County and West Linn as a Minor Arterial. This route provides access to West Linn from Oregon City and provides access between disjointed parts of West Linn. It is a two-lane, two-way roadway with no shoulders, no bike lanes and only intermittent sidewalks along its frontage. Willamette Falls Drive parallels the Willamette River and is the most direct local street connection between the west and east halves of the city. Posted speeds vary from 25 to 35 miles per hour in the Willamette Area to 35 and 45 miles per hour near the east end . It carries approximately 10,000 vehicles daily near Highway 43, with about 1,000 vehicles (two-way) during the evening peak hour. Pavement conditions are generally fair to poor along most segments of the roadway.
10th Street
is classified by Metro as a Collector of Regional Significance and is classified by Clackamas County and West Linn as a Minor Arterial. 10th Street
provides access between areas north and south of I-205 within West Linn. It is primarily a two-lane, two-way roadway with left turn lanes at key locations and shoulders which serve as bike lanes. There is no posted speed limit on 10th Street. It has shoulders and sidewalks adjacent to the shopping centers, but
no continuous sidewalks from one side of the freeway to the other. There is a wide paved shoulder on either side of the undercrossing. Tenth Street carries approximately 13,300 vehicles daily south of I-205, with about 1,100 vehicles (two-way) during the evening peak hour.
Dollar Street
is classified as a Minor Arterial (East of Ostman) and a Collector (West of Ostman) by Clackamas County and as a Minor Arterial (for its length) by West Linn. It is a two-lane, two-way roadway with a posted speed of 25 miles per hour. It provides access to residential areas in the Willamette Area of West Linn. Dollar Street carries about 1,000-2,000 vehicles daily, with about 100-200 vehicles (two-way) during the evening peak hour.
12th Street/Tualatin Avenue
is classified as a Minor Arterial by both Clackamas County and West Linn. It is a two-lane, two-way roadway which provides access to West Linn from rural areas to the southwest. It has a posted speed of 25 miles per hour (20 mph when children are present in the school zone). 12th Street carries about
3,150 vehicles daily near Willamette Falls Drive, with about 315 vehicles (two-way) during the evening peak hour. http://www.ci.west-linn.or.us/Services/Planning/longrange/TransportationPlan/htmls/tspstrsys.htm (2 of 5)1/17/2006 3:52:57 AM
Street System Summary
Rosemont Road/Summit Street/Skyline Drive
– Rosemont Road is classified as a Collector of Regional Significance (west of Salamo Road) by Metro and as a Minor Arterial by Clackamas County and West Linn. Rosemont Road is a two-lane, two-way roadway with a posted speed of 45 miles per hour. South of Miles Drive the speed drops to 25 miles per hour and continues through the length of Summit Street and Skyline Drive. There are sidewalks adjacent to recently developed areas, but otherwise there are generally no sidewalks or bike lanes. Rosemont Road carries about 4,900 vehicles daily near Hidden Springs Road, with about 500 vehicles (two-way) during the evening peak hour.
Salamo Road
is classified as a Collector of Regional Significance by Metro and as a Minor Arterial by Clackamas County and West Linn. This roadway provides access to residential areas in West Linn from I-205. As of July 1, 1999, the former Day Road alignment was re-named to Salamo Road. It is typically a three-lane, two-way roadway with bike lanes and either a planted median or center left turn lane. It has a posted speed of 40 miles per hour near I-205 and 35 miles per hour near Rosemont Road. There are sidewalks in several locations (recently developed areas), but with limited connectivity. It carries about 4,800 vehicles daily near Ponderay Drive, with about 450 vehicles (two-way) during the evening peak hour.
Tannler Drive
is classified as a Minor Arterial by both Clackamas County and West Linn. It is a two-lane, two-way roadway with a posted speed of 25 miles per hour.
Blankenship Road (East of 19th)
is classified as a Minor Arterial by both Clackamas County and West Linn. It is generally a two-lane, two-way roadway with left turn lanes at key locations. It has a posted speed of 25 miles per hour. There are sidewalks adjacent to recently developed areas. Blankenship Road carries about 7,600 vehicles daily near 10th Street, with about 760 vehicles (two-way) during the evening peak hour.
Santa Anita Drive
is classified as a Minor Arterial by both Clackamas County and West Linn. It is a two-lane, two-way roadway, with left turn lanes at key locations. Its frontage is primarily residential. It has a posted speed of 25 miles per hour and generally has sidewalks on the west side. There are no bike lanes along Santa Anita Drive. It carries about 3,600 vehicles daily near Rosemont Road, with about 350 vehicles (two-way) during the evening peak hour.
Table 3-9: West Linn Street System Summary
Street Existing Classification Lanes ADT PM Peak** Posted Speed
Street System Summary
West Linn Clackamas County Metro*
I-205 Principal Route Freeway/ Expressway Principal Arterial (Freeway)
4 83,300 65/55 mph
Highway 43 Major Arterial Major Arterial Major Arterial 2/3 21,000 1,650 40/35 mph
Willamette Falls Drive Minor Arterial Minor Arterial Minor Arterial (west of 10th Street)
2/3 10,500 1,050 25/35/45 mph
10th Street Minor Arterial Minor Arterial (north of I-205)
Collector (Regional) 2/3 13,300 1,060 25 mph
Salamo Road (formerly Day Road) Minor Arterial Minor Arterial Collector (Regional) 2 5,600 560 35 mph
Rosemont Road/ Summit Street/ Skyline Drive
Minor Arterial Minor Arterial Collector (Regional) 2 5,000 500 25/45 mph
Salamo Road Minor Arterial Collector Collector (Regional) 2/3 4,800 450 35/40 mph
Tannler Drive Minor Arterial Minor Arterial 2 N/A N/A 25 mph
Blankenship Road (East of 19th) Minor Arterial Minor Arterial 2/3 7,600 760 25 mph
12th St/Tualatin Ave Minor Arterial Minor Arterial 2 3,150 315 25 mph
Street System Summary
Hidden Springs Road Minor Arterial Minor Arterial 2/3 6,300 630 25 mph
Santa Anita Drive Minor Arterial Minor Arterial 2/3 3,600 360 25 mph
West "A" Street Minor Arterial Minor Arterial 2 2,350 235 25 mph
Dollar Street Minor Arterial Minor Arterial (east of Ostman)
2 1,500 150 25 mph
Pimlico Drive Collector Minor Arterial (Santa Anita to Highway 43)
2 3,250 325 25 mph
Contact Us | Return to Home Page
http://www.ci.west-linn.or.us/Services/Planning/longrange/TransportationPlan/htmls/tspimps.htm
http://www.ci.west-linn.or.us/Services/Planning/longrange/TransportationPlan/htmls/tspimps.htm
Travel Demand Forecast
Travel Demand Forecast
This chapter summarizes the methodology used to obtain future year travel forecasts in the City of West Linn. The plan for street improvements within West Linn depends on determining existing needs and needs of future growth. As a first step in assessing future needs, Metro's urban area traffic forecast model was identified as a source for determining future traffic volumes in West Linn. This traffic forecast model translates land uses into roadway volume projections. These traffic volume projections form the basis for identifying potential roadway deficiencies and for evaluating alternative circulation improvements. This section describes the forecasting process, including key assumptions and the analysis of the land use
scenario developed from the current Comprehensive Plan development designations and allowed densities. Future change of these variables could significantly change the future travel forecast.
Projected Land Uses
Land use is an essential component in how the transportation system operates. The demands on the
transportation system vary depending on the amount of land developed, the type of uses and their location relative to other uses. Understanding the amount and type of land use is critical to maintain or enhance transportation system operation.
Projected land uses were developed for all areas within the urban growth boundary reflecting the
comprehensive plan 1999 update and the city's land use assumptions for year 2020. Complete land use data sets were developed for the following years consistent with the latest Metro travel demand model study years:
❍ Existing 1994 Conditions ❍ Year 2020
Metro’s base year model is updated every few years. For this study effort, the available base model provided by Metro was for 1994. For the horizon year planning, land uses were inventoried throughout West Linn (and the adjacent jurisdictions) by the city Planning Department as part of the Comprehensive Plan update process. It was found that the total allocations were very similar to the Metro allocations for each land use category, but the location of growth within the city was modified to better account for available vacant and re-developable lands.
The land use data applied for travel demand forecasting includes the number of dwelling units, number of retail employees and number of other employees. The city forecast was for 2017, and this essentially
represents build-out of the city within its Urban Growth Boundary. This refined city forecast data was input into Metro’s 2020 travel demand model that includes 2020 land use forecasts for all other jurisdictions in the region. Table3-12 summarizes the land uses for base year conditions and the horizon year scenario in the West Linn area. A detailed summary of the land uses for each Transportation Analysis Zone (for both the 1994 and 2020 model years) is listed in Table 3-13. These data are updated regionally providing
Travel Demand Forecast
information that is more detailed. As the land use data is updated in the future, TSP updates can reflect current conditions and new forecasts.
Urban Reserve Areas
It is appropriate to note that these land use forecasts do not include potential development in the designated urban reserve areas. Urban reserves 30 through 34 along the Rosemont Road or pending Stafford Basin reserve area lie outside of the current urban growth boundary and are not included in the land use forecasts used in the traffic projections. To fully understand the implications of adding these lands into the urban growth boundary, a separate transportation analysis will be required.
Future Travel Patterns
If land uses are significantly changed in proportion to each other (i.e. there is a significant increase in retail employment relative to households), there will be a shift in the overall operation of the transportation system. Retail land uses generate significantly higher numbers of trips than do households and other land uses. The location and design of retail land uses in a community can greatly affect transportation system operation. Additionally, if a community is homogeneous in land use character (i.e. all employment, all residential), the system must support export of trip making. Typically, there should be both residential type land uses as well as employment type land uses so that some residents may work locally, reducing the need for residents to commute long distances to work. West Linn has a mix of land uses; however, many
residents must travel outside the city for employment opportunities. The current balance of land uses in West Linn is predominantly residential (92 percent) with commercial uses (8 percent) in selected
neighborhoods. Also, the amount of employment based land uses such as offices buildings and industrial areas are very limited within the city.
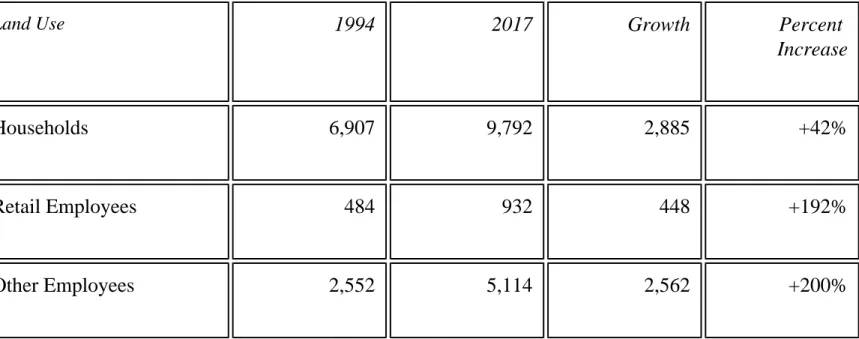
Table 3-12: West Linn Area Land Use Summary
Land Use 1994 2017 Growth Percent
Increase
Households 6,907 9,792 2,885 +42%
Retail Employees 484 932 448 +192%
Other Employees 2,552 5,114 2,562 +200%
Travel Demand Forecast Source
: City of West Linn, 1999. Subsequent adjustments to the residential land use forecasts were made in the later stages of the Comprehensive Plan update to be 10,137 households by 2017. The minor difference (3 percent) applied citywide would not significantly change the travel demand forecasts.
Table 3-12 indicates that a significant amount of growth is expected in West Linn area between 1994 and 2017. Approximately 1,008 residential dwelling units were constructed in West Linn between 1994 and September 1998. These land use quantities should be monitored to make sure that West Linn is working to achieve a balance of land use that is compatible with the available transportation system. This TSP
balances transportation needs with the forecasted 2020 land uses.
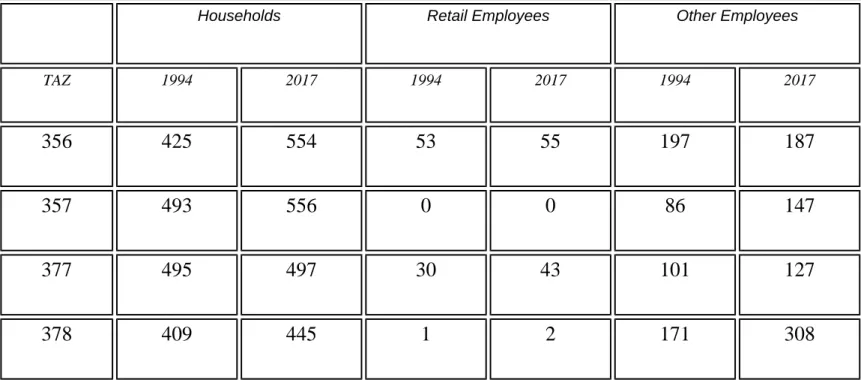
For traffic forecasting, land use data is stratified into geographical areas called transportation analysis zones (TAZs) which represent the sources of vehicle trip generation. Table 3-13 summarizes the land uses for base year conditions and the horizon year scenario by transportation analysis zones (TAZs). There are about 10-15 Metro TAZs which represent West Linn and its vicinity. These 10-15 TAZs were subdivided as part of this plan, into about 20-30 TAZs to more specifically represent land use in and around West Linn. The original Metro and refined model zone boundaries are shown in Figure 3-6. Metro uses
EMME/2, a computer based program for transportation planning, to process the large amounts of data for the Portland Metropolitan area.
Figure 3-6: West Linn Transportation Analysis Zones
Table 3-13: West Linn Land Use Summary by Transportation Analysis Zone
Households Retail Employees Other Employees
TAZ 1994 2017 1994 2017 1994 2017 356 425 554 53 55 197 187 357 493 556 0 0 86 147 377 495 497 30 43 101 127 378 409 445 1 2 171 308 http://www.ci.west-linn.or.us/Services/Planning/longrange/TransportationPlan/htmls/tsplanduse.htm (3 of 5)1/17/2006 3:53:41 AM
Travel Demand Forecast 379 220 326 8 16 39 66 380 217 541 3 17 8 40 381 367 582 3 6 62 119 382 295 389 4 12 28 79 1301 12 20 2 20 36 391 1302 195 710 2 8 49 170 1303 95 632 1 13 30 262 1304 243 343 4 10 29 65 1305 251 277 2 5 17 30 1306 348 439 15 41 110 274 1307 41 41 23 58 171 412 1308 10 72 51 118 127 270 1309 423 464 11 23 27 52 1310 284 369 6 15 16 35 1311 12 22 38 55 177 241 1312 252 315 62 100 288 430 1313 286 326 63 133 293 554 http://www.ci.west-linn.or.us/Services/Planning/longrange/TransportationPlan/htmls/tsplanduse.htm (4 of 5)1/17/2006 3:53:41 AM
Travel Demand Forecast 1314 433 575 1 2 118 255 1315 685 716 27 46 91 129 1316 197 289 0 0 21 22 1317 195 258 29 60 114 210 1318 23 36 44 72 147 240 Total 6,907 9,792 484 932 2,552 5,114
Source: City of West Linn, Planning Department, 1999
Contact Us | Return to Home Page
Metro Area Travel Demand Model
Metro Area Travel Demand Model
Future transportation system planning depends on accurate travel demand forecasts based on population and employment estimates. An effective transportation planning process provides city staff and decision-makers with necessary information about when and where improvements should be made in the
transportation system to meet travel demands.
Metro has developed an urban area travel demand model as part of the Regional Transportation Plan Update process to help identify street and roadway needs. Traffic forecasting can be divided into several distinct components that represent the logical sequence of travel behavior (Figure 3-7). These components and their general order in the traffic forecasting process follow:
● Trip Generation — the total amount of travel activity that begins or ends within a specific TAZ
during a given time period.
● Trip Distribution — identifies the most likely beginning TAZ and ending TAZ of a particular trip.
The TAZs can be inside the city or anywhere in the Metro region.
● Mode Choice — the preferred travel mode to complete the trip (auto, transit, pedestrian, or bicycle) ● Traffic Assignment — the travel route (combination of streets and highways) used to complete the
trip
The initial roadway network used in the traffic model was the existing streets and roadways. Future land use scenarios were tested and roadway improvements were added in to mitigate traffic conditions, using programmed improvements as a starting basis. Traffic forecasts during the PM peak hour traffic were produced for every major roadway segment within West Linn. Traffic volumes are projected on most arterial and collector streets. Some local streets are included in the model, but many are represented by special street connectors used in the model process.
Trip Generation
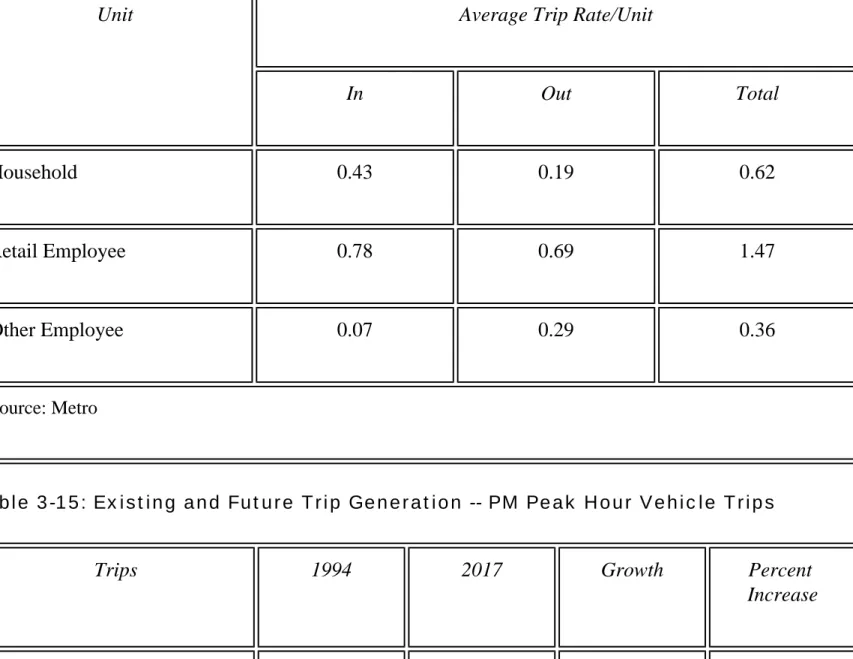
. The trip generation process translates land use quantities (in numbers of dwelling units and retail and other employment) into vehicle trip ends (number of vehicles entering or leaving a TAZ) using trip generation rates established during the model verification process. The trip rates were based on Portland regional rates developed by Metro with adjustments in the calibration process to account for local activity levels. The PM peak hour trip rates used in the Metro model are summarized in Table 3-14. Adjustments were made to reflect higher local rates based on a comparison of the average regional rates versus local generation as determined by Metro studies.
Table 3-15 shows the estimated growth in daily vehicle trips within West Linn, between 1994 and 2017. Vehicle trip generation in West Linn will grow by approximately 60 percent between 1994 and 2017 if the land develops according to the city's assumptions; this is a growth rate of about two-percent per year.
Metro Area Travel Demand Model
Table 3-14: Average PM Peak Hour Trip Rates Used in Metro Model
Unit Average Trip Rate/Unit
In Out Total
Household 0.43 0.19 0.62
Retail Employee 0.78 0.69 1.47
Other Employee 0.07 0.29 0.36
Source: Metro
Table 3-15: Existing and Future Trip Generation -- PM Peak Hour Vehicle Trips
Trips 1994 2017 Growth Percent Increase
West Linn Area 6,977 10,952 3,975 +57%
Source: Metro and DKS Associates
Figure 3-7: Traffic Forecasting Model Process
Trip Distribution.
This step estimates how many trips travel from one zone in the model to any other zone. The distribution is based on the number of trip ends generated in each zone pair, and the likelihood of travel between any two zones given the travel time between them.
Metro Area Travel Demand Model
In forecasting long-range future traffic volumes, it is important to consider how regional travel patterns may change as well as local patterns. The influence of growth in neighboring areas such as Lake Oswego, Tualatin, Oregon City, Portland and Washington County will affect the commute and shopping patterns in the next twenty years. Trips made outside of the city (external trips) and through trips (trips which pass through West Linn and have neither an origin nor a destination there) were estimated based on census data and traffic counts at the edge of the Metro Urban Growth Boundary.
Mode Choice.
This is the step where it is determined how many trips will be by single-occupant vehicle, transit or carpool. The 1994 mode splits were incorporated into the base model and adjustments to that mode split were made for the future scenario, depending on any expected changes in transit or carpool use. These considerations are built into the forecasts used for 2020.
Traffic Assignment.
In this process, trips from one zone to another are assigned to specific travel routes in the roadway network, and resulting trip volumes are accumulated on links of the network until all trips are assigned.
A separate travel demand model is used for auto assignment and another for transit assignment. Various techniques exist for auto assignment, such as all-or-nothing, stochastic, incremental capacity restraint and equilibrium capacity restraint. The EMME/2 package, among others, uses the equilibrium capacity restraint technique, which is considered to produce the most realistic network traffic loading of all the techniques. With this technique, the auto trips are assigned iteratively to the network in such a way that the final traffic loading will closely approximate the true network "equilibrium." Network equilibrium is defined as the condition where no traveler can achieve additional travel time savings by switching routes. Between iterations, network travel times are updated to reflect the congestion effects of the traffic assigned in the previous iteration. Congested travel times are estimated using what are called "volume-delay functions" in EMME/2. There are different forms of volume/delay functions, all of which attempt to simulate the
capacity restraint effect of how travel times increase with increasing traffic volumes. The volume-delay functions take into account the specific characteristics of each roadway link, such as capacity, speed, and facility type.
Model Verification
. The base 1994 modeled traffic volumes were compared against actual traffic counts on arterial streets and at major intersections. Most arterial traffic volumes are closely replicated, even down to turn movements by the model based upon detailed calibration. Based on this performance, the model was used for future forecasting and assessment of circulation changes.
Model Application to West Linn
Metro Area Travel Demand Model
Intersection turn movements were extracted from the model at important intersections for both year 1994 and year 2020 scenarios. These intersection turn movements were not used directly, but the increment of the year 2020 turn movements over the year 1994 turn movements was applied (added) to existing (actual 1998) turn movement counts in West Linn. Actual turn volumes used for future intersection analyses are provided in the Technical Appendix.
The resulting peak hour volumes on selected links and freeway ramps are shown in Figure 3-8 for the greater West Linn area. The values compare the 1998 traffic count volumes with the forecasted 2020 volumes at each location.
The initial 2020 test was performed on a street network that included existing roads plus those roadway improvements that are currently programmed and would likely be implemented before the 2020 scenario is reached. Refer to Table 3-10 and 3-11 for details of the planned roadway improvements.
Alternative Travel Assumptions
Travel forecasts included the highest level of transit service given regional funding constraints (as described in the Metro Strategic Regional Transportation Plan). This includes higher frequency transit service along Highway 43 between Oregon City and downtown Portland. The forecasts also assume that Transportation Demand Management (TDM) will occur within the region and the city (see Chapter 8 of the city’s Transportation System Plan for recommendations pertaining to modified parking standards and expanded park and ride lots).
Contact Us | Return to Home Page
Future Needs Analysis
Future Needs Analysis
Circulation and Capacity NeedsThe motor vehicle capacity and circulation needs in West Linn were determined for future conditions based on the travel forecasts described in the previous section. The process used for analysis is outlined below, followed by the findings and recommendations of the analysis. The extent and nature of the street improvements for West Linn are generally consistent with current transportation plans. This section outlines the type of street improvements that would be necessary as part of a long range master plan. Phasing of implementation will be necessary since improvements cannot all be done at once. This will require prioritization of projects and periodic updating to reflect current needs. Most importantly, it should be understood that the improvements outlined in the following section are a guide to managing growth in West Linn and defining the types of right-of-way and street needs that will be required as development occurs.
Future Needs
Future transportation conditions were evaluated in a similar manner to existing conditions. Improvements to
intersections, roadways between intersections, and brand new or extended facilities were considered and a package of recommended improvements was determined.
Forecasts of 2020 traffic volumes were developed using the forecast model. These data were reviewed and refined to produce detailed year 2020 PM peak hour traffic forecasts at intersections. When assigned to the roadway network, this level of traffic growth is expected to create the need for improvements at several locations.
Figure 3-8: Comparative Peak Hour Traffic Volumes--1998 and 2020
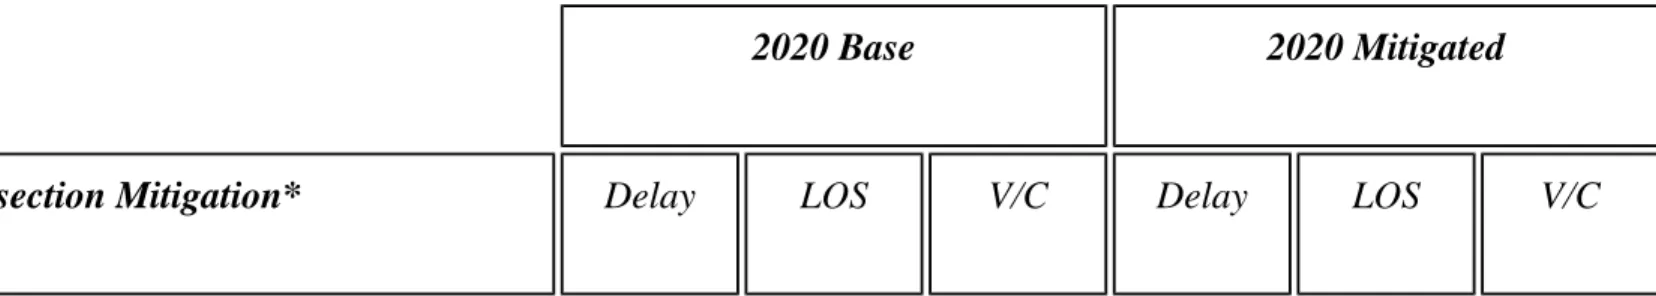
Tables 3-16 and 3-17 summarize the intersection levels of service for year 2020 using two scenarios. The first is base (unmitigated) future conditions and the second is, where required, a mitigated scenario. The notes in the tables indicate the type of mitigation measure that was applied to achieve the improved service level conditions. The complete intersection calculation worksheets are listed in the Technical Appendix. These mitigation measures are in a later section of this report for the Recommended Plan.
Table 3-16: 2020 Signal Controlled Intersection Conditions (PM Peak Hour)
2020 Base 2020 Mitigated
Intersection Mitigation* Delay LOS V/C Delay LOS V/C
Future Needs Analysis
Highway 43/Marylhurst Dr >60 F >1.0 >60 F >1.0
Highway 43/Cedaroak Dr (2) >60 F >1.0 29.3 D 0.99
Highway 43/Hidden Springs Dr (2) 24.9 C >1.0 28.0 D 0.99
Highway 43/Elliott Street >60 F >1.0 >60 F >1.0
Highway 43/McKillican St (2) >60 F >1.0 22.0 C 0.99
Highway 43/I-205 SB Ramps (2,3) >60 F >1.0 23.0 C 0.95
Highway 43/I-205 NB Ramps 19.7 C 0.95 19.7 C 0.95
Highway 43/Willamette Falls Drive (2,3)
>60 F >1.0 47.2 E >1.0
10th Street/Blankenship-Salamo** (4) 17.0 C 0.71 34.4 D 0.99
10th Street/I-205 SB Ramps** (2,4) >60 F >1.0 -- --
--10th Street/I-205 NB Ramps (2) >60 F >1.0 20.4 C 0.85
Notes: Delay = Average Delay per Vehicle, LOS = Level of Service, V/C = Volume-to-Capacity Ratio
* Mitigation Measures = (1) Access Restrictions, (2) Upgrade or Install Traffic Signal Controls; (3) Add Turn Lane Channelization; (4) Road Re-alignment or Extension
** Salamo Road/Blankenship Road/10th Street intersection combined with I-205 SB Ramp intersection to form one intersection. This calculation assumes traffic signal controls, but a roundabout design is a viable alternative for this location.
Future Needs Analysis
The Highway 43 intersections generally exceed planned capacity for three lanes throughout the length of the city by 2020. All but two of the monitored intersections will drop to Level of ServiceF conditions. Other minor street intersections not included in this analysis will also have severe delays for the side streets entering the highway during peak hours (see Table 3-17). Table 3-16 also shows that the 10th Street interchange ramps will exceed their capacity.
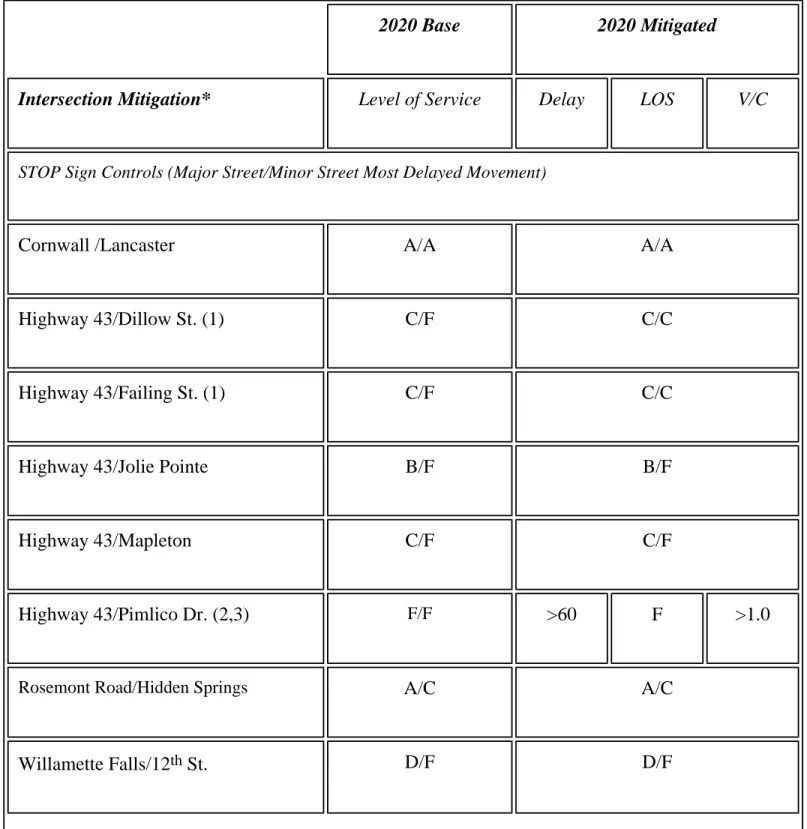
Table 3-17: 2020 Non-Signal Controlled Intersection Conditions (PM Peak Hour)
2020 Base 2020 Mitigated
Intersection Mitigation* Level of Service Delay LOS V/C
STOP Sign Controls (Major Street/Minor Street Most Delayed Movement)
Cornwall /Lancaster A/A A/A
Highway 43/Dillow St. (1) C/F C/C
Highway 43/Failing St. (1) C/F C/C
Highway 43/Jolie Pointe B/F B/F
Highway 43/Mapleton C/F C/F
Highway 43/Pimlico Dr. (2,3) F/F >60 F >1.0
Rosemont Road/Hidden Springs A/C A/C
Willamette Falls/12th St. D/F D/F
Future Needs Analysis
Willamette Falls/Dollar St. B/D B/D
Willamette Falls/Sunset Av. (2,3) F/F 17.5 C 0.91
Willamette Falls/West "A" St. (2,3) B/F >60 F >1.0
All-Way-Stop Controlled Intersections (Average for All Movements)
Rosemont Rd/Salamo Rd. (2,3) F 16.1 C 0.75
Summit St./Rosemont Rd. A A
10th St./Willamette Falls (2,3) F 36.1 D 0.98
Notes: Delay = Average Delay per Vehicle, LOS = Level of Service, V/C = Volume-to-Capacity Ratio * Mitigation Measures = (1) Access Restrictions, (2) Upgrade or Install Traffic Signal Controls; (3) Add Turn Lane Channelization; (4) Road Re-alignment or Extension
Referring to Table 3-17, the street improvement measures on Highway 43 were limited to an ultimate 3-lane street cross-section. The forecasted peak hour volumes on Highway 43 cannot be adequately served at several locations, even with the addition of traffic signal controls (e.g., Elliott Street and Pimlico Drive). Moreover, intersections without traffic signals will have severe delays (LOS F) for left-turning movements onto the highway during this period.
Traffic Signal Guidelines
Traffic signal warrant analyses were performed for all unsignalized intersections operating at LOS E or worse under future base (2020) conditions. The results listed in Table 3-18 show that all of these intersections will exceed the minimum traffic volume warrants by 2020. Traffic signal warrants were based on the Manual on Uniform Traffic Control Device’s (MUTCD) Warrant 11 (Peak Hour Volume). All traffic control devices should meet MUTCD standards prior to their installation. On arterial streets, signals should generally be spaced at least 1,000 feet apart for efficient operation. A detailed traffic engineering evaluation shall be conducted before the installation of any traffic signal. ODOT signal design and signal phasing guidelines should be followed for all traffic signal installations.
Future Needs Analysis
Table 3-18: Traffic Signal Warrants – MUTCD Peak Hour Volume Warrant
Intersection Warrant Met 1998? Warrant Met 2020?
10th Street/I-205 NB Ramps Yes Yes
10th Street/I-205 SB Ramps Yes Yes
10th Street/Willamette Falls Drive No Yes
Highway 43/Pimlico Drive No Yes
Highway 43/Willamette Falls Drive Yes Yes
Rosemont Road/Salamo Road No Yes
Willamette Falls Drive/Sunset No Yes
Note: Traffic volumes should be monitored on a periodic basis to determine when the minimum warrant levels will be reached. Traffic signals should not be installed at any location until traffic volumes meet or exceed these levels.
Contact Us | Return to Home Page