Durham Research Online
Deposited in DRO:05 December 2016
Version of attached le:
Published Version
Peer-review status of attached le:
Unknown
Citation for published item:
Gorard, S. and Siddiqui, N. (2016) 'Grammar schools in England : a new approach to analysing their intakes and outcomes.', Project Report. Durham University, Durham.
Further information on publisher's website: https://www.dur.ac.uk/education/
Publisher's copyright statement: Additional information:
Use policy
The full-text may be used and/or reproduced, and given to third parties in any format or medium, without prior permission or charge, for personal research or study, educational, or not-for-prot purposes provided that:
• a full bibliographic reference is made to the original source
• alinkis made to the metadata record in DRO
• the full-text is not changed in any way
The full-text must not be sold in any format or medium without the formal permission of the copyright holders. Please consult thefull DRO policyfor further details.
Durham University Library, Stockton Road, Durham DH1 3LY, United Kingdom Tel : +44 (0)191 334 3042 | Fax : +44 (0)191 334 2971
1 Grammar schools in England: a new approach to analysing their intakes and outcomes
Stephen Gorard and Nadia Siddiqui Durham University
s.a.c.gorard@durham.ac.uk
Abstract
This paper forms part of a larger investigation of indicators of disadvantage and how they may be improved or supplemented in order to track school intakes and results better. Here our evolving dataset based on the National Pupil Database in England over 11 years is used to assess the impact of selective schools. At time of writing, the UK government is planning to increase the number of pupils attending state-funded selective grammar schools via a number of routes. They claim that this will assist overall standards, reduce the poverty attainment gap and so aid social mobility. Using the full 2015 cohort of pupils in England, this paper shows how stratified the pupils attending grammar schools actually are (worse than previous estimates) in terms of poverty, ethnicity, language, special educational needs, and even their age in year. It also shows that the results from grammar schools are no better than expected, once these differences are taken into account. There is no evidence base for a policy of increasing selection; rather the UK government should consider phasing the existing selective schools out.
Introduction
The authors are currently completing an ESRC-funded project, looking at different ways of estimating disadvantage in schools in England based on existing datasets, creating new variables to encompass individual ‘trajectories’ of disadvantage, and applying these to analyses of school intakes and outcomes. For example, we take a variable such as whether a pupil is eligible for free schools meals (FSM) in any year (or whether data is missing), and collate this for every year the pupil was in compulsory schooling. The results can be used to create new variables, such as how many years a child has been FSM-eligible, for the individual and for those they go to school with. We do the same thing with other background variables such as living or going to school in a deprived area, having a special educational need, having English as an additional language, and even ethnic classification. We are also linking our new records to other datasets such as the Longitudinal Study of Young People in England (LSYPE) to see how well our new trajectory variables match the richer data, such as parental occupation and income, in such smaller datasets. We have already shown that our new approach can explain the apparent difference in school performance between the more deprived North East and less deprived South East of England. The claim that schools in the NE were doing worse with equivalent pupils was shown to be false because, by relying on flag variables such as FSM-eligible or not, their evidence did not take account of the depth of poverty concerned (Gorard 2016a, 2016b).
Policy
This paper applies the same kind of approach to an analysis of the 164 selective state-funded grammar schools in England. Historically grammar schools were widespread in the UK, set up as part of a planned tri-partite system after 1944 which actually became a two-tier system
2 of grammar schools and secondary-moderns. Children took a series of tests at age 10/11 (the 11+), and those with high scores were selected to attend grammar schools, with the remainder going to secondary-moderns.
The system has largely been abolished in Scotland and Wales, but retained in Northern Ireland, where it is made more segregated by having sectarian grammar schools for catholic and protestant families (Gallagher and Smith 2000). Secondary age educational outcomes in Northen Ireland are very variable in terms of academic performance, and pupils from deprived backgrounds or with special educational needs are under-represented in the grammar schools there (Borooah and Knox 2015).
In England, the number of grammar schools peaked in 1966, and then dropped to the current level by 1980. The 164 remaining schools are disproportionately Academies, and single-sex with a sixth form, and their pupil intake has increased since 1980 (Bolton 2016). These schools are over-subscribed and popular with many local parents (Lloyds Bank 2016). At time of writing this is a topical issue, because the UK government has declared an intention to change the law to allow more selective schools to be created, and permit existing schools to become grammar schools under certain conditions.
In September 2016, the UK Prime Minister announced that the law banning state-funded schools in England (other than the 164 grammars in place in 1997) from using academic selection to allocate their pupil places will be removed (Foster et al. 2016). Instead, new schools such as free schools and academies would be able to become, in effect, new grammar schools. This was described by the PM and the Department for Education (DfE) as a way to provide more good school places through “schools that work for everyone” (https://engage.number10.gov.uk/good-school-places/). They see it as a responsibility of the state to provide especially for pupils who are gifted and talented, and they feel that a comprehensive school environment cannot fully nurture the potential of such datasets. There is a fall-back plan to allow the existing grammar schools to expand further by opening satellite schools, and this policy does not require direct legislation, and £50 million has already been earmarked to fund it.
The claims used to try and justify this change of policy were that:
Pupils generally perform better at grammar schools than they do at non-selective schools
The poorest children attending grammar schools do even better so that such schools actually reduce the poverty attainment gap and promote social mobility
And that there is little or no harmful consequence for the other pupils in the rest of the schools.
This paper considers these three claims using a national dataset for England, and a number of new variables developed by the authors specifically for this kind of analysis. The paper starts by looking at some of the prior evidence on selective schools, their effectiveness and implications for other types of school. It then summarises the methods and data used, before presenting the most up-to-date evidence on each of the three claims, and it ends by considering the implications for policy and practice in England and elsewhere.
3 Grammar schools use examinations to select children aged 10 or 11 who are predicted to do well in subsequent examinations at age 16. They select well, as evidenced by the high raw-scores outcomes of these pupils five years later. This seems to confuse some commentators, members of the public and even policy-makers who assume that the good results are largely due to what happens in the school rather than the nature of the children selected. Of course, this is not so, and a counterfactual is needed to tell us what wold have happened to these children if they had attended a different school. This is often attempted by looking not at raw-score outcomes but the amount of progress made by each pupil while at the school (the ‘value-added’ model).
Some value-added studies comparing grammar schools with comprehensive or other types of school have suggested that the former have better pupil outcomes even once prior attainment is accounted for (Prais 2001). However, these same value-added results appear if the model is still based on pupils attending grammar schools but uses their Key Stage 1 (KS1) results for prior attainment when aged 7, and their KS2 results when aged 11 as the outcome. This cannot be due to attending a grammar school because pupils only move after KS2, and so this odd result suggests that the purported grammar school effect is in fact a form of unmeasured pre-selection (Manning and Pischke 2006). This study also exemplifies how hard it is to assess whether one school or type of school is genuinely more effective than other, once the prior attainment and other characteristics of school intakes been accounted for. Even if a difference is found in results, it may still be due to unknown or unconsidered prior differences in intakes. If the intakes to grammar schools really are already on a path to success based on their KS1 results, then that subsequent success at KS4 at age 16 must not be mistakenly attributed to having attended a grammar school in the meantime.
Anyway, such school effectiveness analyses are error-ridden (Gorard 2010), and very sensitive to assumptions about errors (Televantou et al. 2015). Their ensuing school ‘effects’ are small, volatile across years, inconsistent across different kinds of achievement (Marks 2015), and heavily dependent upon the model used (Darling-Hammond 2015). Therefore, published school performance measures based on value-added scores are likely to be profoundly misleading, particularly for those such as parents and policy-makers unfamiliar with the high level of uncertainty in the estimates for individual schools (Perry 2016).
What is really needed is a series of robust randomised evaluations (Gorard et al. 2017). But allocating pupils to selective schools or not at random is not really feasible for quite good practical and ethical reasons. Instead, it should be possible to gain access to the 11+ scores and use a regression discontinuity design but the scores are not currently being made available to us. A close alternative occurs when over-subscribed schools allocate places by lottery. Using such an approach, it has been shown that the lauded Charter schools in the US are no better than other schools, perhaps slightly worse (Clark et al. 2015). In fact, detailed analyses using as much data as possible, have tended to show little or no substantive difference between the effectiveness of any types of schools within a national school system (Rutt and Styles 2013). Schools differ largely in terms of who attends them (Gorard and See 2013), and this seems to include grammar schools. They did not confer a real advantage in the past and in their prime (Halsey and Gardner 1953, Halsey et al. 1980), and they do not do so now (Coe et al. 2008, Sullivan et al. 2014). They do not increase social mobility in comparison to comprehensive schools, and do not assist working-class pupils with social class mobility, although the figures for income mobility are not so clear (Boliver and Swift 2011).
4
Segregation
The foregoing work seems to contradict, for the most part, the first argument (above) for retaining and expanding grammar schools. What about the third argument, that there are no harmful consequences for others? Internationally, it is quite clear that the extent to which pupils are clustered together with others like them socially and ethnically as well as in terms of ability is much higher in countries with selective systems (Jenkins et al. 2008, OECD 2014). Such ‘segregation’ tends to be low in developed countries with little or no diversity of schooling such as those in Scandinavia, linked to low achievement gaps, higher average attainment and also the highest percentage of very skilled students (Alegre and Ferrer 2010). Segregation tends to be high in countries with tracking or selection at a young age such as Germany, Austria, Belgium and Hungary.
In England, the still largely comprehensive system means that social, racial and economic segregation between schools is lower than in the latter group of countries (Gorard 2015a). But there is considerable variation between areas such as local authorities. The few authorities that have retained selection and grammar schools have the highest level of SES segregation in England. The correlation between FSM segregation and the number of grammar schools in any area is 0.62 (Gorard et al. 2013). In areas that have grammar schools, those living in the most disadvantaged parts are less likely to attend a grammar even where they have high prior attainment scores (Cribb et al. 2013). Of course, grammar schools are not the only kinds of schools in England (or elsewhere) that have heavily stratified intakes. Faith-based schools, fee-paying schools, and even the most popular comprehensive schools can create as big a problem (Coe et al. 2008, Gorard 2015b).
There is also a clear link between relative attainment at school and the age of a pupil in their year group (Gorard 2015c). Younger children have lower test scores, worse non-cognitive skills on average, are rated weaker by their teachers, and are less happy and more often bullied at school (Crawford et al. 2011). This is all worsened by selecting pupils by ability, as is done in grammar schools at the young age of 10 or 11 when their age in year matters more (Campbell 2014).
This segregation of pupils of different types between schools is not merely a question of who goes to school with whom. Segregation whether racially, or by religion or social class, can have alarming and dangerous consequences for the school system and for society more widely longer term.
Selective schools can make pre-existing inequalities worse by providing differential opportunities to learn (Schmidt et al. 2015), teachers’ responses to children (Strand and Winston 2008), poorer instruction at school, less qualified teachers, and substandard resources for the lower tracks (Harris and Williams 2012, Kalogrides and Loeb 2013). The kind of stratification created by grammar schools can widen the gap between privileged and not so privileged in terms of civic knowledge (Collado et al. 2015,), emotional and behavioural problems (Muller and Hofmann 2014), and even achievement in some studies (Goldsmith 2011, Condron 2013, Danhier and Martin 2014, Mendolia et al. 2016, Yeung and Phuong Nguyen-Hoang 2016). They can increase the impact of SES and low expectations (Parker et al. 2016), and affect relationships between pupils and teachers in the remaining schools (Vieluf et al. 2014), and between pupil peers, leading to poorer social skills (Gottfried 2014).
5 This all contradicts the third argument about no damage caused by having selection (above). What is needed as a priority is more evidence about the second argument. Do grammar schools do well for poor children?
Methods
The new research presented here is based on the National Pupil Database for England – specifically the 2015 Key Stage 4 cohort, with attainment, school and background information for every year that they have been in compulsory schooling. There are 549,203 pupils with relatively complete records, of whom 75,787 (14%) are listed as eligible to receive free school meals (FSM). There are 171,397 in local authority areas that contain at least one grammar school, of which 22,402 attended a grammar school at KS4. The same analyses (below) have also been conducted with the 2014 KS4 cohort with the same substantive results.
The original pupil-level variables involved in the headline analyses are: School attended
Local authority area
Birth month and year – used to compute age in year Sex – girls tend to have better results than boys Ethnic origin or group
English as an additional or second language Special needs with a statement
Special needs without a statement
Whether the pupil moved to the school in the last two years
FSM-eligibility at KS4 – a flag variable showing whether a pupil is from a home officially classified as below the poverty line
EverFSM6 – whether a pupil has been eligible for FSM in any of the past 6 years IDACI score – a measure of average deprivation for the area where the pupil lives or
goes to school
KS1 points score – attainment at age 7 KS2 points score – attainment at age 11
KS4 capped points score – attainment at age 16 Pupil-level variables derived from the data are:
The month of birth in the school year – to distinguish between summer and winter born pupils
The number of years in total a pupil was eligible for FSM up to KS4 – a more accurate measure of poverty
Whether a pupil goes to school in an area with grammar schools Whether a pupil goes to a grammar school
The data are considered for two geographical areas – all pupils in England, and those going to school in an area with grammar schools (a “selective area”). The real number variables (above) are averaged for each area and for pupils attending grammar schools or not. The differences are converted into simple ‘effect’ sizes by dividing them by the overall standard
6 deviation for each variable. The categorical variables are used to create odds ratios – the number in each category in a grammar school times the number not in that category and not in a grammar school, divided by the number not in each category but in a grammar school times the number in each category not in a grammar school. This kind of analysis demonstrates the differences between the pupil intakes for grammar schools and the rest. These differences must be taken into account when considering the relative ‘effectiveness’ of grammar schools.
The effectiveness of grammar schools and grammar school areas is assessed via four regression models based on four different groups of pupils – all pupils in England, FSM-eligible pupils in England, all pupils in selective areas, and FSM-FSM-eligible pupils in selective areas. Each model has the same basic structure. The outcome variable to be explained is the KS4 attainment score for each pupil. The predictors for all models at the first stage are all of the other variables listed above, except for the last two. These include prior attainment and the background characteristics of each pupil.
The first two models then add a second step with one more potential explanatory variable – whether the pupil goes to school in a selective area. The last two models do not, as they only concern pupils in selective areas. The last step for all four models also has one potential explanatory variable – whether the pupil attends a grammar school. In this way, the amount of variation explained at each stage, and the coefficients for the explanatory variables, provide an estimate of the impact of attending a grammar school or not, shorn of the known differences in the intakes to each type of school.
Results
The intakes to grammar schools
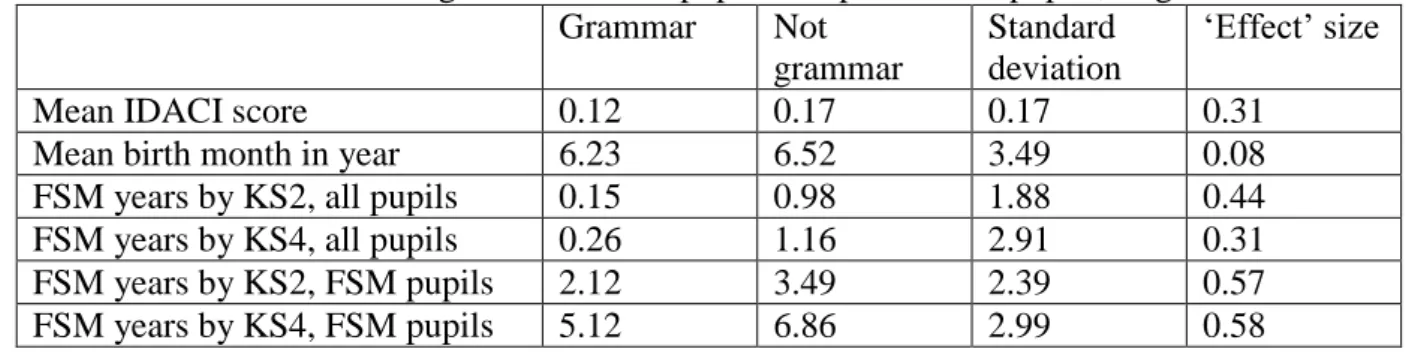
It is immediately apparent from Tables 1 and 2 that the characteristics of pupils attending grammar schools are markedly different in many ways from those attending other state-funded schools in England. Those attending grammar schools, on average, live in less deprived areas, are older in their year group, and even where they are FSM-eligible they will have been so for fewer years. The latter point, that even the level of poverty of pupils officially defined as living in poverty is different, is particularly important and will be discussed further below in terms of the attainment of grammar school pupils.
Table 1 – Characteristics of grammar school pupils compared to all pupils, England 2015
Grammar Not
grammar
Standard deviation
‘Effect’ size
Mean IDACI score 0.12 0.17 0.17 0.31
Mean birth month in year 6.23 6.52 3.49 0.08
FSM years by KS2, all pupils 0.15 0.98 1.88 0.44
FSM years by KS4, all pupils 0.26 1.16 2.91 0.31
FSM years by KS2, FSM pupils 2.12 3.49 2.39 0.57
FSM years by KS4, FSM pupils 5.12 6.86 2.99 0.58
Those attending grammar schools, on average, are less likely to be White UK or Black in ethnic origin, less likely to have English as an additional language, much less likely to report
7 any special educational need, especially statemented ones, and are substantially less likely to be FSM-eligible in the first place.
Table 2 – Characteristics of grammar school pupils compared to all pupils, England 2015
Grammar Not grammar Odds ratio
Non-White UK 25.1% 19.3% 1.40 White any 74.5% 80.5% - Black any 3.0% 5.0% - Pakistani/Bangladeshi 14.7% 8.8% - Chinese 1.5% 0.3% - Other/mixed 6.2% 5.5% - EAL students 11.3% 14.0% 0.78
SEN students with statement 0.3% 3.9% 0.07
SEN students no statement 5.3% 12.7% 0.38
EverFSM11 7.3% 31.5% 0.17
EverFSM6 5.3% 25.6% 0.16
FSM2015 2.4% 14.3% 0.15
Of course, some of these differences could be due to the kind of pupil populations in areas where the minority of 164 grammar schools remain, which could differ from the rest of the country. To assess this, Tables 3 and 4 compare those attending grammar schools with only those pupils in areas with grammar schools. These make it clear that the differences in Tables 1 and 2 are not produced by the geography of where grammar schools still exist. In fact, pupils in grammar schools are even less representative of their local areas than they are of pupils in England as a whole (the ‘effect’ sizes are the same or larger, especially for the IDACI scores, and the odds ratios are lower, especially for FSM-eligibility).
Table 3 – Characteristics of grammar school pupils compared to pupils in selective areas, 2015 Grammar Not grammar Standard deviation ‘Effect’ size
Mean IDACI score 0.12 0.22 0.16 0.61
Mean month in year 6.23 6.54 3.48 0.09
FSM years by KS2, all pupils 0.15 0.97 1.81 0.45
FSM years by KS4, all pupils 0.26 1.60 2.81 0.48
FSM years by KS2, FSM pupils 2.12 3.45 2.40 0.55
FSM years by KS4, FSM pupils 5.12 6.81 3.00 0.56
Table 4 – Characteristics of grammar school pupils compared to pupils in selective areas, 2015
Grammar Not grammar Odds ratio
Non-White UK 25.1% 18.1% 1.52 White any 74.5% 81.7% - Black any 3.0% 4.0% - Pakistani/Bangladeshi 14.7% 8.8% - Chinese 1.5% 0.3% - Other/mixed 6.2% 5.2% - EAL students 11.3% 12.8% 0.87
8
SEN students no statement 5.3% 13.0% 0.37
EverFSM11 7.3% 31.5% 0.17
EverFSM6 5.3% 25.7% 0.16
FSM2015 2.4% 14.4% 0.15
Children aged 10 or 11 are put forward and then tested for entry to grammar schools on the basis of their ability, prior attainment and motivation. However, this selection process indirectly also selects for a wide range of other characteristics most of which should not be relevant. It is understandable that pupils with serious learning challenges will be less likely to pass an 11+ test of ability or attainment, even assuming it is a fair test in that respect. It is also understandable that children born later in the school year and those for whom English is not their first language will tend to do worse – although the test can and should make allowance for this. But it is harder to see why the family income, ethnic origin, and precise area of residence should be so stratified. For the present, the key point is that those who go to grammar schools differ from the rest of the schools in England by far more than their talent as tested by the 11+. Therefore, grammar schools cannot be said to be obtaining better results with equivalent pupils even once that prior ability and attainment, as demonstrated in the 11+ test, is taken into account.
This also means that grammar schools and the areas they are in are much more segregated by any of these indicators than the rest of England is. For example, the segregation residual (Gorard et al. 2003) in terms of FSM eligibility in 2015 was 0.00002 averaged across all schools, whereas it was double that (0.00004) in areas with grammar schools, and ten times that (0.00022) in grammar schools. However good grammar schools are (or not) this must be set against the real dangers from such a deliberate policy of socio-economic segregation between schools.
The outcomes from grammar schools
The KS4 attainment of pupils in selective areas and the rest of England is very similar. The mere existence of grammar schools in an area does not seem to drive up standards or reduce the gap between FSM-eligible pupils and the rest (Table 5). As would be expected, because they are selected by ability, pupils in grammar schools have higher than average attainment at KS4 showing that the 11+ test is reasonably good at selecting those who will do well 5 years later.
Table 5 – Comparison of KS4 attainment (total capped points) by FSM, England 2015
Not FSM-eligible EverFSM6 Standard deviation ‘Effect’ size England 328 260 98 0.69 Selective areas 334 259 99 0.76 Grammar schools 413 395 44 0.41
However, Table 5 also shows that FSM-eligible pupils, using the official DfE measure of EverFSM6, have better KS4 scores in grammar schools to such an extent that the ‘effect’ size or poverty attainment gap is noticeably lower there. This is the basis of the second argument for grammar schools – that they aid social mobility.
Another way of looking at this can be seen in Table 6. The link between prior attainment (KS1) and results aged 16 (KS4) is considerably lower in grammar schools than in schools
9 more generally. This is presumably at least partly because they have a much smaller range of prior attainment (being selective). This will be addressed in the regression models that follow. But the link between KS4 results and FSM-eligibility in grammar schools is also lower. Again, this could partly be because very few pupils in grammar schools have been FSM-eligible for their entire school career. For example, in 2015 only 41 pupils in all grammar schools (0.2%) had been FSM-eligible for nine of the previous years. The figures for England are 12,350 such pupils (2.2%). Grammar schools not only take very few FSM pupils (see above) they also only take the less chronically poor even in those few (here by less than a tenth of their fair share). One consequence is that the correlations between poverty, prior attainment and KS4 results are higher in selective areas than they are in England on average, despite the lower correlations in grammar schools. The differences may appear small but it must be recalled that the number of pupils in selective areas not in grammar schools will be around five to ten times as many as the number in grammar schools. If there is any advantage from grammar schools for disadvantaged pupils in the models that follow it would tend to be zero-sum.
Table 6 – Correlation between KS4 attainment, KS1 and number of years FSM-eligible
KS4 attainment points Years FSM-eligible KS1 attainment points
England all pupils -0.31 0.68
England FSM pupils -0.15 0.51
Selective areas all pupils -0.33 0.70
Selective areas FSM pupils -0.16 0.63
Grammar schools all pupils -0.08 0.34
Grammar schools FSM pupils -0.01 0.23
The relevance of how many years a pupil has been FSM-eligible (i.e. living in poverty) is illustrated well in Figure 1. Pupils who have never been known to be eligible for FSM (on the far left) have a much higher level of KS4 attainment than any pupil with even one year of FSM-eligibility. This is well-known. Less well-known is the fact that, on average, KS4 attainment declines with every year of FSM-eligibility. This matters because grammar schools are not only taking only a fraction of their fair share of FSM pupils, the few FSM pupils they do take are disproportionately those towards the left of Figure 1 who are likely to do better anyway whatever school they attend. And this means that the other schools in selective areas are not only taking more than their fair share of FSM pupils, but are also disproportionately dealing with the more chronically poor in their areas.
Figure 1 – Crossplot of the number of years any pupil is FSM-eligible (x) and the average KS4 point score (y)
10 In order to take all of this into account, we ran four multi-variate regression models and the headline results are in Table 7. The R value using all of the pupil background and prior attainment variables listed in the previous section of the paper, for all pupils in England, was 0.81 (66% of total variation in KS4 outcomes explained). It was about the same for only those pupils in selective areas (0.82 or 68%) and slightly lower when considering the FSM-eligible subset of pupils in either group (0.72 or 59%). This is similar to usual educational effectiveness models. Additional background variables could improve this somewhat, but there will always be an error term due to missing data, measurement errors and so on (Gorard 2010). The first model in each category is slightly better than it would be traditionally due to knowledge of exactly how many years each pupil has been FSM-eligible rather than using the traditional binary classification (and this approach will be refined further and applied to other explanatory variables in future papers).
Table 7 – R from multi-stage regression models predicting total capped KS4 points, England
All pupils FSM pupils Pupils in
selective area
FSM pupils in selective area
Background predictors 0.81 0.77 0.82 0.77
Whether in selective area 0.81 0.77 - -
Whether in grammar school 0.81 0.77 0.82 0.77
None of the models improves at all when knowledge is added of whether a pupil goes to school in a selective area or not. This means that if grammar schools are at all differentially effective, their effect is indeed zero-sum and wiped out by exactly equivalent harm done to the rest of the nearby school system. However, adding knowledge of whether a pupil goes to a grammar school also improves none of the four models at all. With only 164 grammar schools, it could be argued that they would not be expected to add much to the full model for all pupils in England. But they do not add anything to the smaller model restricted only to areas with grammar schools either. On this basis, grammar schools appear to be no more or less effective than other schools, once their clear difference in intake has been taken into account. And this is true both for FSM-eligible and non FSM-eligible pupils.
200 220 240 260 280 300 320 340 0 2 4 6 8 10 12
11 Table 8 makes much the same point, by showing the standardised coefficients (equivalent to ‘effect’ sizes) for each variable in the four models. Prior attainment at KS2 is by far the best predictor of KS4 outcomes, following by prior attainment at KS1, the number of years eligible for FSM, and whether a pupil has any kind of special need. The least important variables, with almost negligible ‘effect’ sizes, are the date of birth in the school year, the level of deprivation in the area, whether the school is in a selective area, and whether it is a grammar school. However, the level of deprivation would increase in importance if FSM-eligibility were not available because the two are correlated. Similarly, the month of birth in year appears far less important than in reality because the prior attainment scores are acting as proxy to a great extent (younger pupils do less well at KS1, KS2 and KS4).
Table 8 – Standardised coefficients from four multi-stage regression models predicting total capped KS4 points, England
All pupils FSM pupils Pupils in selective area FSM pupils in selective area
KS2 average points (prior attainment) 0.57 0.50 0.55 0.49
KS1 average points (prior attainment) 0.10 0.10 0.11 0.11
Sex of pupil 0.08 0.07 0.07 0.08
Month in year (summer born) 0.04 0.03 0.04 0.03
Number of years known to be FSM-eligible -0.10 -0.06 -0.10 -0.06
IDACI scores (deprivation) -0.05 -0.02 -0.05 -0.03
Special need (SEN) -0.10 -0.14 -0.10 -0.14
Mean number of years FSM-eligible, school -0.05 -0.06 -0.07 -0.08
Joined school in last two years (mobility) -0.08 -0.10 -0.07 -0.09
English as an additional language 0.08 0.11 0.06 0.09
Non-White UK (ethnic minority) 0.06 0.09 0.05 0.08
Schooled in a selective area -0.01 -0.01 - -
Attends grammar school 0.04 0.03 0.07 0.06
Conclusions
On the basis of the prior evidence and the new analyses presented here, the policy of selective schools has little to recommend it. Dividing children into the most able and rest from an early age does not appear to lead to better results for either group, even for the most disadvantaged. The new variable created for this analysis – the number of years each pupil has been eligible for FSM by KS4 – explains at least part of the difference between grammar schools results and those of other schools, over and above the obvious difference in prior attainment. Not only do grammar schools in England take only a tiny proportion of pupils who are or have even been eligible for FSM, those that they do take have been eligible for fewer years.
Every grammar school creates a much larger number of schools around it that cannot be comprehensive in intake, of necessity, because they are denied a supply of so many of the most high-attaining children. It does not matter whether these schools are officially designated as ‘secondary-modern’ schools, or whether they offer different curricula or not. And the two sets of co-existing schools will and must differ in terms of a whole set of other pupil characteristics that appear to be related to selection at 11+ but are not directly selected for. These include special needs, first language and, less obviously, ethnicity and poverty.
12 Policy-makers and unthinking advocates always focus on grammar schools, whereas an equivalent claim to ‘we must have more grammar schools’ would be ‘we must have a lot more schools that are deprived of the most talented 15-20% of pupils in their catchment areas’. In areas with selective schools, the system is a clear driver towards increased social and economic segregation between schools, and all of the dangers that this entails – such as lower self-esteem and aspiration, poorer role models, poorer relationships and distorted sense of justice (Gorard and See 2013).
Put together, these two findings mean that grammar schools in England endanger social cohesion for no clear improvement in overall results. The policy is a bad one and, far from increasing selection, the evidence-informed way forward would be to phase out the existing 164 grammar schools in England, and their peers in Northern Ireland. This is not to decry the schools that are currently grammars, or the work of their staff. But overall, they are simply no better or worse than the other schools in England once their selected and privileged intake is accounted for. Nor do the findings of this paper and others mean that schools should not use any form of internal ‘setting’ by ability in any phase. In the absence of grammars it is still currently possible for high ability pupils to be taught together for at least some of the week (and whether that is an effective approach would be another paper). But the richer and more able pupils currently in grammar schools would then mix with a wider range of peers, especially those with learning challenges, to the mutual benefit of all, in all classes and years that did not use setting, all vertical structures such as ‘houses’, and in sports, play and extra-curricular activities. The importance of inclusion is not just about those with learning difficulties or disabilities; it can also be about the most able at age 11.
Of course, there are other factors leading to stratified entries to schools. Some of these, such as changes in the local economy, transport in rural areas, and residential segregation, are beyond a quick policy or educational fix (Gorard et al. 2015). But some, such as the continued existence (and planned expansion) of schools that are selective by religion, could be abolished at a stroke. Any improvement in one is likely to have a beneficial impact on the others (via the ‘Belfast model’, Gorard et al 2003), but none of these further problems is an argument for making the stratification worse by retaining or expanding grammar schools.
Acknowledgements
The work reported here was conducted as part of ESRC grant ES/N012046/1.
References
Alegre, M. and Ferrer, G. (2010) School regimes and education equity: some insights based on PISA 2006, British Educational Research Journal, 36, 3, 433-461
Boliver, V. and Swift, A. (2011) Do comprehensive schools reduce social mobility?, The British Journal of Sociology, 62, 1, 89-110
Bolton, P. (2016) Grammar school statistics, House of Commons Library Briefing Paper 1398
Borooah, V. and Knox, C. (2015) Segregation, inequality, and educational performance in Northern Ireland: Problems and solutions, International Journal of Educational Development, 40, 196-206
13 Campbell, T. (2014) Stratified at seven: in-class ability grouping and the relative age effect,
British Educational Research Journal, 40, 5, 749-771
Clark, M., Gleeson, P., Tuttle, C., and Silverberg, M. (2015) Do Charter schools improve student attainment? Educational Evaluation and Policy Analysis, 37, 4, 419-436
Coe, R., Jones, K., Searle, J., Kokotsaki, D., Mohd Kosnin, A. and Skinner, P. (2008) Evidence on the Effects of Selective Educational Systems, London: Sutton Trust
Collado, D., Lomos, C. and Nicaise, I. (2015) The effects of classroom socioeconomic composition on student’s civic knowledge in Chile, School Effectiveness and School Improvement, 26, 3, pp.415-440
Condron, D. (2013) Affluence, inequality, and educational achievement, Sociological Spectrum, 33, 73-97
Crawford, C., Dearden, L. and Greaves, E. (2011) Does when you are born matter? The impact of month of birth on children’s cognitive and non-cognitive skills in England, Report to the Nuffield Foundation
Cribb, J., Sibieta, L. and Vignoles, A. (2013) Entry into Grammar Schools in England,
Institute for Fiscal Studies, https://www.ifs.org.uk/docs/Grammar_Schools2013.pdf Danhier, J. and Martin, E. (2014) Comparing compositional effects in two education systems:
the case of the Belgian communities, British Journal of Educational Studies, 62, 2, 171-189
Darling-Hammond, L. (2015) Can value added add value to teacher evaluation?, Educational Researcher, 44, 2, 132-137
Foster, D., Long, R. and Roberts, N. (2016) Grammar schools in England, House of Commons Library Briefing Paper 7070
Gallagher, T. and Smith, A. (2000) The effects of the selective system of secondary education In Northern Ireland, Bangor: Department of Education, http://www.education.gg/CHttpHandler.ashx?id=97491&p=0
Goldsmith, P. (2011) Coleman revisited: School segregation, peers, and frog ponds, American Educational Research Journal, 48, 3, 508-535
Gorard, S. (2010) Serious doubts about school effectiveness, British Educational Research Journal, 36, 5, 735-766
Gorard, S. (2015a) The uncertain future of comprehensive schooling in England, European Educational Research Journal, 14, 3-4, 257-268,
http://eer.sagepub.com/cgi/reprint/14/3-4/257.pdf?ijkey=6QSxgjXEXzExZC2&keytype=finite
Gorard, S. (2015b) The complex determinants of school intake characteristics, England 1989
to 2014, Cambridge Journal of Education, 46, 1, 131-146,
http://dx.doi.org/10.1080/0305764X.2015.1045446
Gorard, S. (2015c) The easy way to help kids born in summer keep up at school, New Scientist, 17th October 2015, p.28
Gorard, S. (2016a) A cautionary note on measuring the pupil premium attainment gap in England, British Journal of Education, Society and Behavioural Sciences, 14, 2, DOI: 10.9734/BJESBS/2016/23618
Gorard, S. (2016b) Challenging Perceptions of a North South Regional Divide in School Performance in England, BERA Annual Conference, Leeds, September 2016
Gorard, S. and See, BH. (2013) Overcoming disadvantage in education, London: Routledge Gorard, S., Hordosy, R. and See, BH. (2013) Narrowing the determinants of segregation
between schools 1996-2011, Journal of School Choice, 7, 2, 182-195
Gorard, S., See, BH and Siddiqui, N. (2017) The trials of evidence-based education, London: Routledge
14 Gorard, S., Taylor, C. and Fitz, J. (2003) Schools, Markets and Choice Policies, London:
RoutledgeFalmer
Gottfried, M. (2014) Does classmate ability influence students’ social skills?, School Effectiveness and School Improvement, doi: 10.1080/09243453.2014.988731
Halsey, A. and Gardner, L. (1953) Selection for secondary education and achievement in four grammar schools, The British Journal of Sociology, 4, 1, 60-75
Halsey, A., Heath, A. and Ridge, J. (1980) Origins and destinations, Oxford: Clarendon Press Harris, D. and Williams, J. (2012) The association of classroom interactions, year group and
social class, British Educational Research Journal, 38, 3, 373-397
Jenkins, S., Micklewright, J. and Schnepf, S. (2008) Social segregation in secondary schools: how does England compare with other countries?, Oxford Review of Education, 34, 1, 21-37
Kalogrides, D. and Loeb, S. (2013) Different teachers, different peers, Educational Researcher, 42, 6, 304-316
Lloyds Bank (2016) Parents willing to pay £53,000 more to live near a top school, http://www.lloydsbankinggroup.com/Media/Press-Releases/2016-press-releases/lloyds-bank/house-prices-near-schools/
Manning, A. and Pischke, J. (2006) Comprehensive versus selective schooling in England in Wales: What do we know?, IZA Discussion Paper No. 2072. Available at SSRN:http://ssrn.com/abstract=898567
Marks, G. (2015) The size, stability and consistency of school effects, School Effectiveness and School Improvement, 26, 3, 397-414
Mendolia, S., Paloyo, A. and Wlaker, I. (2016) Heterogeneous effect of high school peers in educational outcomes, IZA Discussion Paper 9795, http://ftp.iza.org/dp9795.pdf
Muller, M. and Hofmann, V. (2016) Does being assigned to a low school track negatively affect psychological adjustment?, School Effectiveness and School Improvement, 27, 2, 95–115
OECD (2014) Education at a Glance 2014: OECD Indicators, OECD Publishing, http://www.oecd-ilibrary.org/education/education-at-a-glance-2014_eag-2014-en
Parker, P., Jerrim, J., Schoon, I. and Marsh, H. (2016) A multination study of socioeconomic inequality in expectations for progression to Higher Education, American Educational Research Journal, 53, 1, 6-32
Perry, T. (2016) English Value-Added Measures: Examining the Limitations of School
Performance Measurement, British Educational Research Journal,
http://onlinelibrary.wiley.com/doi/10.1002/berj.3247/full
Prais, S. (2001) Grammar schools' achievements and the DfEE's measures of value-added: an attempt at clarification, Oxford Review of Education, 27, 1, 69-73
Rutt, S. and Styles, B. (2013) Analysis of academy school performance in the 2011 and 2012 GCSEs, Slough: NFER
Schmidt, W., Burroughs, N., Zoido, P. and Houang, R. (2015) The role of schooling in perpetuating educational inequality: an international perspective, Educational Researcher, 44, 7, 371-386
Strand, S., and Winston, J. (2008) Educational aspirations in inner city schools, Educational Studies, 34, 4, 249-267
Sullivan, A., Parsons, S., Wiggins, R., Heath, A. and Green, F. (2014) Social origins, school type and higher education destinations, Oxford Review of Education, 40, 6, 739-763 Televantou, I., Marsh, H., Kyriakides, L., Nagengast, B., Fletcher, J. and Malmberg, L.
(2015) Phantom effects in school composition research, School Effectiveness and School Improvement, 26, 1, 75-101
15 Vieluf, S., Hochweber, J., Klieme, E. and Kunter, M. (2014) Who has a good relationship
with teachers?, Oxford Review of Education, 120.1080/03054985.2014.992874
Yeung, R. and Phuong Nguyen-Hoang, P. (2016) Endogenous peer effects: Fact or fiction?, The Journal of Educational Research, 109, 1, 37-49