Investigating an intervention, informed by variation theory, into the Grade
11 learners’ interpretation of algebraic functions.
Mampotse Shirley Ramaisa
A research report submitted to the Faculty of Science, in partial fulfilment of the
requirements for the degree of Master of Science University of the
Witwatersrand, Johannesburg.
Johannesburg
DECLARATION
I declare that this research report is my own work. It is submitted for the degree of Master of Science in the University of the Witwatersrand, Johannesburg. It has not been submitted before for any degree or examination in any other University.
Signature
ABSTRACT
This study investigates to what extent and how teaching informed by variation theory could improve the Grade 11 learners’ interpretation of algebraic functions. The study adopted a learning study approach, where learner difficulties are elicited in a pre-test, and on the basis of the results of the pre-test, a lesson is planned, informed by variation theory, to make it possible for learners to discern what they found difficult.
In this study, a pre-test on functions was given to three groups of Grade 11 learners (85 learners in all) in the researcher’s school that enabled the identification of aspects of
functions learners found to be most problematic. The lesson was then taught successively to each group. A post-test at the end of each lesson, together with reflection on the lesson led to refinements for the next lesson to the next group.
The study describes the changes made to the lessons, and the results of the pre and post tests for each of the three groups. The results showed that while each group improved in the post test, the third group outperformed the others, confirming that an intervention, informed by variation theory, did improved learning. All learners were afforded the opportunity to discern the object of learning and their interpretation of functions improved, with the third group improving the most.
DEDICATION
ACKNOWLEDGEMENTS
It is my pleasure to thank these people who made this dissertation possible.
I am grateful to my supervisor Professor Jill Adler and co-supervisor, Mr. Vasen Pilay, for providing opportunity for development and deeper understanding of the subject. I thank them for their tireless support and intellectual contributions, for the time they invested in the supervision and reading of my work and for their tactful ways of correcting the expressions I made and their reference to some of the important and relevant readings I needed to pursue this study.
I am grateful to the funding that the University of the Witwatersrand provided in the process of making this report become a reality. Funding from the University made it possible for me to invest time into completing this report. I would like to thank the Wits Maths Connect for opening doors for me to grow academically and interact with other researchers who made me want to pursue and complete this study.
I would like to extend my regards and blessings to my mother Sis Martha, my sister Sibongile my daughter Mpho, son Lejakane, and not forgetting my grandson Neo, who continuously motivated, supported and encouraged me throughout the study. I am grateful for their good wishes towards me and desire for me to study.
I am indebted to the mathematics teachers who willingly gave of their time to be part of this research by forming the panel of observers that observed my lessons,
moderated the tests and reflected on the lessons. Without their input and dedication, this study would not have been possible. Their contribution to this study is priceless.
Table of contents
DECLARATION ... II ABSTRACT ...III DEDICATION ... IV ACKNOWLEDGEMENTS ... V CHAPTER ONE. ... 1 1. INTRODUCTION. ... 1 1.1 AIM. ... 1 1.2 PERSONAL DILEMMAS. ... 31.3 INTRODUCTION TO THE RESEARCH PROBLEM. ... 6
1.4 PROBLEM STATEMENT. ... 12
1.6 CRITICAL QUESTIONS. ... 13
1.6.1. WHAT ASPECTS OF FUNCTIONS DO LEARNERS FIND TO BE PROBLEMATIC? ... 13
1.6.2. WHICH OF THESE ASPECTS APPEAR MOST PROBLEMATIC? ... 13
1.6.3. HOW DOES A VERSION OF A LEARNING STUDY (WHICH IS FRAMED BY VARIATION THEORY) IMPROVE THE GRADE 11 LEARNERS’ INTERPRETATION OF ALGEBRAIC FUNCTIONS AND TO WHAT EXTENT? 13 1.7 RATIONALE. ... 13
1.8 OUTLINE OF THE STUDY BY CHAPTERS. ... 15
CHAPTER TWO. ... 18
LITERATURE REVIEW.... 18
2.1 INTRODUCTION. ... 18
2.2 LITERATURE ON FUNCTIONS. ... 19
2.2.1 WHYMULTIPLEREPRESENTATIONSOFFUNCTIONSARESO IMPORTANT? ... 20
2.3 THE SOUTH AFRICAN CURRICULUM ON FUNCTIONS. ... 23
2.3.1 FUNCTIONSFORGRADE11’SINTHESOUTHAFRICANCURRICULUM. ... 24
2.4 LEARNER MISCONCEPTIONS. ... 27
2.4.1 MISCONCEPTIONSRELATEDTOTHEDEFINITIONOFAFUNCTION. ... 29
2.4.2 MISCONCEPTIONSRELATEDTOTHECONSTANTFUNCTION. ... 33
2.4.4 MISCONCEPTIONSONMULTIPLEREPRESENTATIONSOFFUNCTIONS. ... 37
2.4.5 MISCONCEPTIONSONINTERPRETATIONOFFUNCTIONS. ... 46
2.5 A TEACHING PERSPECTIVE. ... 49
2.5.1 THEDUALNATUREOFFUNCTIONS. ... 49
2.6 RELEVANCE OF THE LITERATURE REVIEW TO THE STUDY. ... 55
2.7 SUMMARY ... 57
CHAPTER THREE... 59
3.1 INTRODUCTION. ... 59
3.2 THE FOCUS OF THE STUDY. ... 59
3.3 THEORETICAL FRAMEWORK ... 59
3.3.1 OBJECTOFLEARNING. ... 60
3.3.2 VARIANCEANDINVARIANCE. ... 61
3.3.3 FEATURESOFVARIATIONTHEORY. ... 62
3.4 EXAMPLE SPACE. ... 65
3.4.1 THESPACEOFLEARNING. ... 65
3.4.2 CHOICEOFEXAMPLES. ... 66
3.5 THE PATTERNS OF VARIATION. ... 67
3.5.1 SEPARATION. ... 67 3.5.2 CONTRAST... 68 3.5.3 GENERALIZATION. ... 70 3.5.4 FUSION. ... 71 3.5.5 SIMULTANEITY. ... 71 3.6 A LEARNING STUDY. ... 72 3.7 SUMMARY. ... 73 CHAPTER FOUR ... 74 METHODOLOGY ... 74 4 INTRODUCTION. ... 74 4.1 RESEARCH PARADIGM. ... 74 4.2 RESEARCH DESIGN. ... 75
4.3 SAMPLE AND SETTING. ... 77
4.4 DATA COLLECTION STRATEGIES. ... 78
4.4.1 THEDIAGNOSTIC/PRE-TEST... 79
4.4.2 THEINTERVENTIONLESSONS. ... 83
4.4.3 THEPOST-TEST. ... 85
4.5 ETHICAL CONSIDERATIONS. ... 86
4.7 CHALLENGES DURING DATA COLLECTION. ... 89
4.8 VALIDITY. ... 89
4.9 RELIABILITY.... 90
4.10 LIMITATIONS OF THE STUDY. ... 91
4.11 SUMMARY. ... 92
CHAPTER FIVE. ... 93
THE ANALYSIS AND DISCUSSION OF THE INTERVENTION LESSONS. ... 93
5.1 INTRODUCTION. ... 93
5.2.1 INTERVENTIONLESSON1(GROUPA). ... 95
5.2.2 ATABLEOFTHEINTERVENTIONLESSON1FORGROUPA. ... 98
5.2.3 REFLECTIONANDDISCUSSIONOFLESSON1. ... 100
5.3 INTERVENTION LESSON 2 (GROUP B). ... 102
5.3.1 INTRODUCTION... 102
5.3.2 ATABLEOFTHEINTERVENTIONLESSON2FORGROUPB. ... 103
5.3.2 REFLECTIONANDDISCUSSIONOFLESSON2. ... 104
5.4 LESSON 3 (GROUP C). ... 105
5.4.1 INTRODUCTION... 105
5.4.2 ATABLEOFTHEINTERVENTIONLESSON3FORGROUPC. ... 108
5.4.3 REFLECTIONSANDDISCUSSIONOFLESSON3. ... 109
5.5 DISCUSSION OF THE INTERVENTION LESSONS WITH COLLEAGUES. ... 110
5.6 SUMMARY. ... 111
CHAPTER SIX.... 114
ANALYSIS AND INTERPRETATION OF TEST DATA. ... 114
6.1 INTRODUCTION. ... 114
6.2 MIXED METHODS DESIGN OF DATA ANALYSIS. ... 115
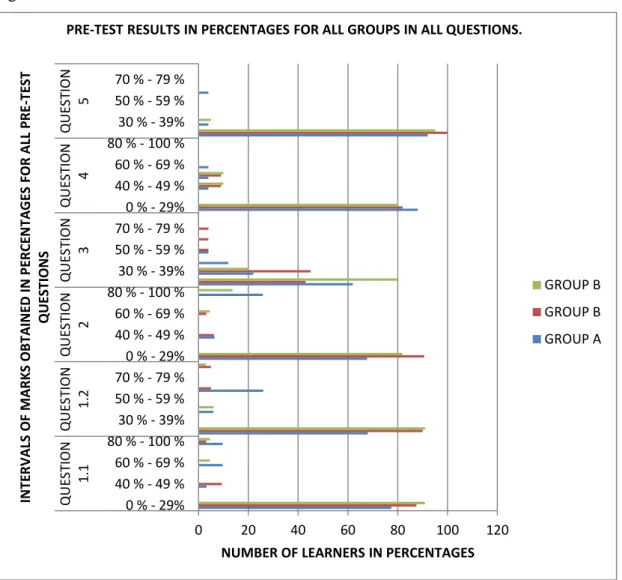
6.2.1 QUANTITATIVEANALYSISOFTHEPRE-TEST. ... 115
6.2.2 RESULTSOFTHEDIAGNOSTIC/PRE-TEST. ... 116
6.3 PERFORMANCE OF THE GROUPS IN EACH PRE-TEST QUESTION. ... 119
6.3.1 QUESTION1.1 ... 119
6.4 DISCUSSION OF THE PRE-TEST. ... 142
6.5 DISCUSSION OF THE POST-TEST. ... 145
6.5.1 THE POST-TEST. ... 145
QUESTION 1 ... 145
6.5.2 DISCUSSION OF THEINTERVENTION LESSONS WITH RESPECT TO THE POST-TEST. 147 6.6 RESULTS OF THE POST-TEST. ... 149
6.7 COMPARISON OF THE PRE-TEST AND THE POST-TEST IN EACH GROUP. ... 152
6.7.1 COMPARISONOFTHEPRE-TESTANDTHEPOST-TESTFORLESSON1(GROUPA). ... 153
6.7.2 INTERPRETATIONOFTHEDATAAFTERLESSON1 FOR ... 155
6.7.3 COMPARISONOFTHEPRE-TESTANDTHEPOST-TESTFORLESSON2(GROUPB). ... 156
6.7.4 INTERPRETATIONOFTHEDATAAFTERLESSON2(GROUPB)... 158
6.7.5 COMPARISONOFTHEPRE-TESTANDTHEPOST-TESTFORLESSON3(GROUPC). ... 159
6.7.6 INTERPRETATIONOFTHEDATAAFTERLESSON3(GROUPC)... 162
6.8 DISCUSSION AND INTERPRETATION OF DATA. ... 163
6.9 SUMMARY. ... 164
CHAPTER SEVEN. ... 165
7.1 INTRODUCTION. ... 165
7.2 REFLECTIONS. ... 168
7.3 RECOMMENDATIONS. ... 172
REFERENCES. ... 173
APPENDIX A ... 183
INFORMATION SHEET AND CONSENT LETTERS: PARENTS/GUARDIAN ... 183
APPENDIX B ... 186
INFORMATION SHEET AND CONSENT LETTERS: LEARNERS ... 186
APPENDIX C ... 189
INFORMATION SHEET AND CONSENT LETTERS: EDUCATORS ... 189
APPENDIX D. ... 191
PRE-TEST ON FUNCTIONS. ... 191
APPENDIX E. ... 200
MEMORANDUM FOR PRE-TEST ... 200
APPENDIX F ... 204
POST-TEST ON FUNCTIONS. ... 204
APPENDIX G. ... 206
MEMORANDUM TO POST-TEST ON FUNCTIONS. ... 206
APPENDIX I. ... 208 INTERVENTION LESSONS. ... 208 LESSON 1 (GROUP A) ... 208 LESSON 2 (GROUP B) ... 211 LESSON 3 (GROUP C) ... 215 TABLE 1. ... 219
OBSERVATION SCHEDULE WITH THE SUMMARY OF THE KEY ASPECTS OF THE VIDEOTAPED LESSON. ... 219
TABLE 2. ... 220
OBSERVATION SCHEDULE PER LESSON OF 60 MINUTES.... 220
TABLE 3. ... 221
TABLE OF SPECIFICATION FOR THE PRE-TEST. ... 221
TABLE 4. ... 222
TABLE OF SPECIFICATION FOR THE POST TEST. ... 222
TABLE 5. ... 223
FIGURE 2.6: THE QUESTIONNAIRE USED IN THE EXPERIMENTAL AND THE CONTROL GROUPS.... 223
TABLE 6. ... 224 FIGURE 2 .7: RESULTS OF THE QUESTIONNAIRE FOR THE CONTROL GROUP AND THE EXPERIMENTAL GROUP. ... 224
LIST OF FIGURES:
Figure 1: Overall achievement rates in Mathematics from 2008-2011. 7
Figure 2.1: Connecting the definition of a function to the graphical representation. 20
Figure 2.1.2: Mathematical representations and scientific representations. 21
Figure 2.2(a): Visual representation of a physical structure. 21
Figure 2.2(b): Visual representation of a physical structure. 21
Figure 2.2: A quarter circle as a function or non-function. 30
Figure 2.3: Half a circle as a function or non-function. 30
Figures 2.4: Connecting the definition of a function to the graphical representation. 30
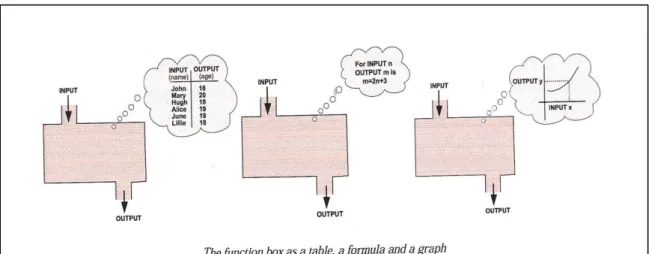
Figure 2.5: Representation of the function machine/box as a formula. 38
Figure 2.6: The function machine/ box as a table, a formula and a graph. 38
Figure 4.1: The Convergent parallel design paradigm. 75
Figure 4.2: Action research spiral as identified by Mills (2011) p. 19. 77
Figure 4.3: The 12 directions of equivalence of functional notation as depicted
by Van Dyke & Craine (1997). 79
Figure 6.1: Questions 1 to 5 results for the diagnostic test for all groups. 115
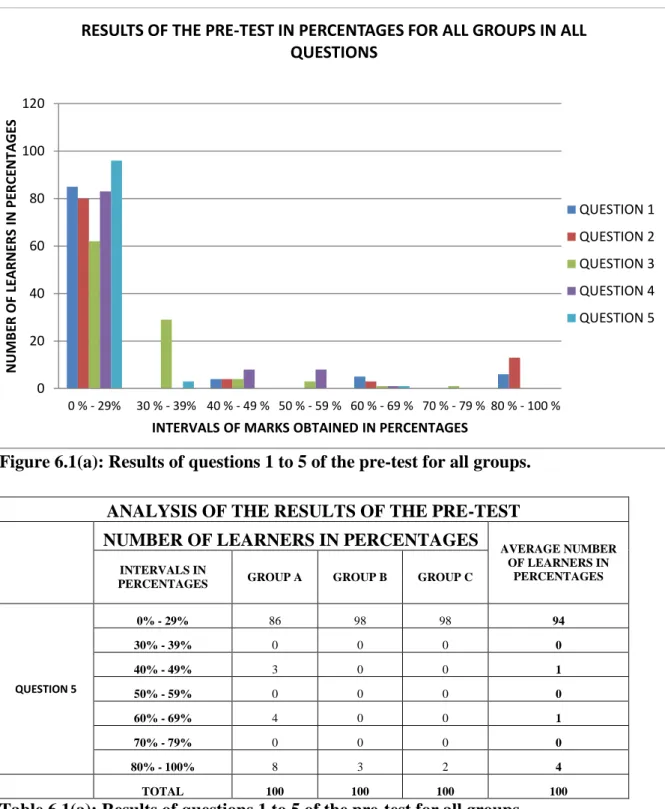
Figure 6.1(a): Results of questions 1 to 5 of the pre-test for all groups. 117
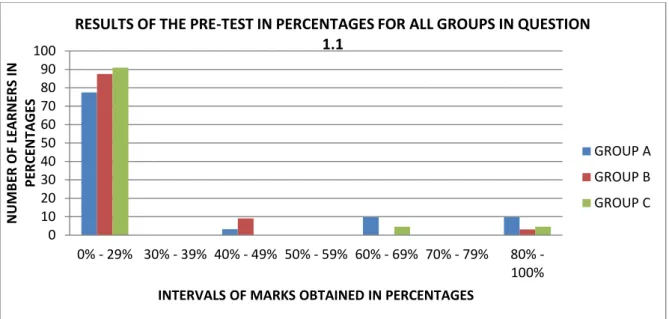
Figure 6.2(a): Results of the learner responses for question 1.1 of the pre-test for all the
groups. 120
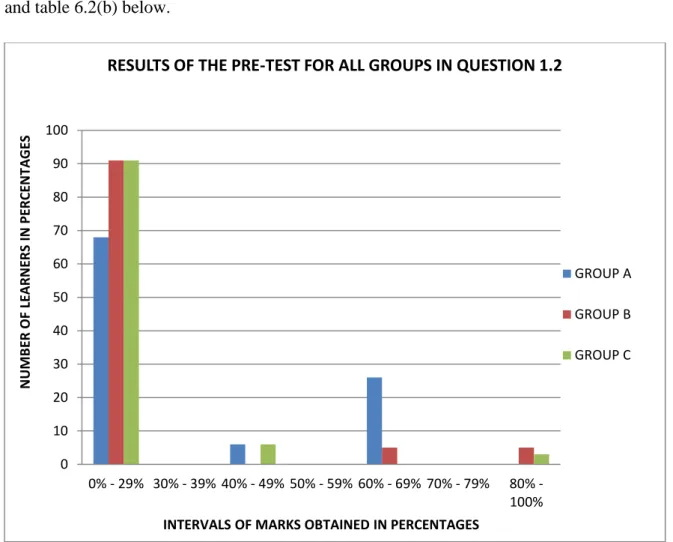
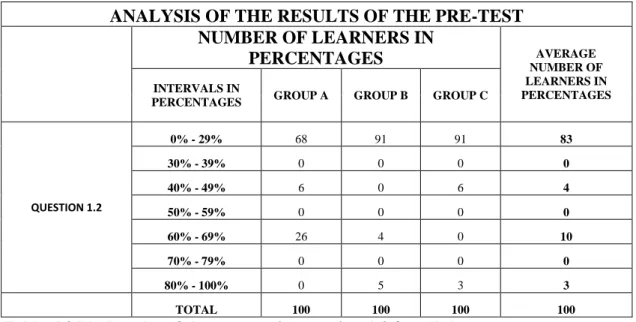
Figure 6.2(b): Results of the pre-test in question 1.2 for all the groups. 123
Figure 6.2(c): Results of the pre-test question 2 for all the groups. 126
Figure 6.3(a): Results of the pre-test for all the groups in question 3. 129
Figure 6.4: Results of the pre-test in question 4 for all the groups. 132
Figure 6.5(a): Results of the pre-test in question 5 for all the groups. 134
Figure 6.5(b): Results of the pre-test in question 5.1 for all the groups. 136
Figure 6.5(c): Results of the pre-test in questions 5.2 to 5.7 for all the groups. 138
Figure 6.6(a): Post-test results in questions 1, 2 and 3 for all the groups. 146
Figure 6.6(b): Comparison of the averages of the results of the pre-test and post-test in
all questions for all groups. 146
Figure 6.7(a): Comparison of the results of the pre-test and post-test in all questions
for group A. 148
Figure 6.7(b): Comparison of the results of the pre-test and post-test in all the
Figure 6.8(a): Comparison of the results of the pre-test and post-test in all questions
for group B. 151
Figure 6.8(b): Comparison of the results of the pre-test and post-test in all the
questions for group B. 152
Figure 6.9(a): Comparison of the results of the pre-test and post-test in all the
questions for group C. 155
Figure 6.9(b): Comparison of the results of the pre-test and post-test in all the
LIST OF TABLES:
Table 2.2: An example of the tabular representation of the values of a function. 42
Table 4.1: The sample used in the study. 77
Table 5.2: A detailed table of the first part of the changed intervention lesson for
group B adapted from the PowerPoint presentation in appendix I. 103
Table 5.3: A detailed table of the intervention lessons adapted from the Microsoft
PowerPoint presentation. 108
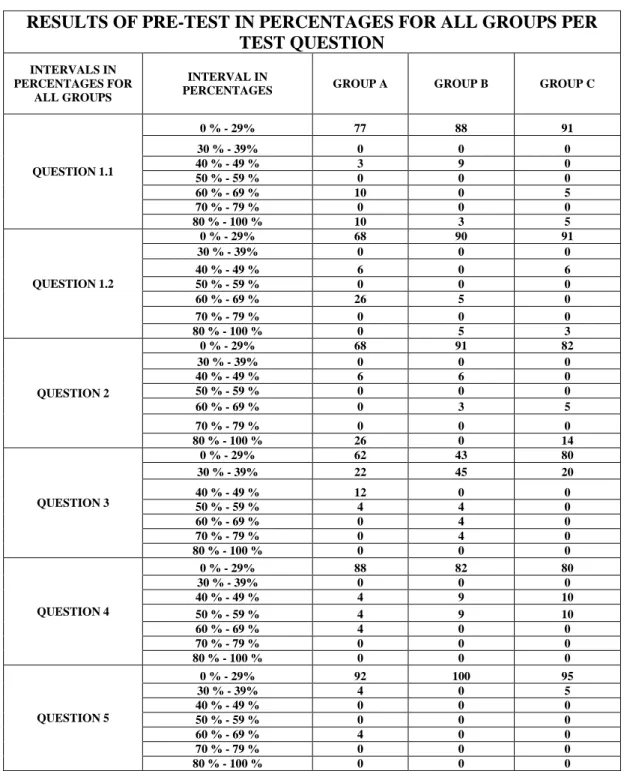
Table 6.1: Results of the pre-test in percentages for all groups in all five questions. 116
Table 6.1(a): Results of questions 1 to 5 of the pre-test for all groups. 117
Table 6.2(a): Results of the learner responses for question 1.1 of the pre-test for all the
groups. 120
Table 6.2(b): Results of the pre-test in question 1.2 for all the groups. 123
Table 6.2(c): Results of the pre-test question 2 for all the groups. 126
Table 6.3(a): Results of the pre-test for all the groups in question 3. 129
Table 6.4: Results of the pre-test in question 4 for all the groups. 132
Table 6.5(a): Results of the pre-test in question 5 for all the groups. 134
Table 6.5(b): Results of the pre-test in question 5.1 for all the groups. 136
Table 6.5(c): Results of the pre-test in questions 5.2 to 5.7 for all the groups. 138
Table 6.6(a): Post-test results in questions 1, 2 and 3 for all the groups. 146
Table 6.6(b): Comparison of the averages of the results of the pre-test and post-test in
all questions for all groups. 146
Table 6.7(a): Comparison of the results of the pre-test and post-test in all questions
for group A. 148
Table 6.7(b): Comparison of the results of the pre-test and post-test in all the
questions for group A. 149
Table 6.8(a): Comparison of the results of the pre-test and post-test in all questions
for group B. 151
Table 6.8(b): Comparison of the results of the pre-test and post-test in all the
questions for group B. 152
Table 6.9(a): Comparison of the results of the pre-test and post-test in all the
questions for group C. 155
Table 6.9(b): Comparison of the results of the pre-test and post-test in all the
ABBREVIATIONS:
AS
Assessment Standards
CK
Curricula Knowledge
DBE
Department of Basic Education
DoE
Department of Education
GDBE
Gauteng Department of Basic Education
GET
General Education and Training
HESA
Higher Education South Africa
FET
Further Education and Training
ICU
Intensive Care Unit
LO
Learning Outcome
NCS
National Curriculum Statement
NSC
National Senior Certificate
PCK
Pedagogic Content Knowledge
SAQA
South Africans Qualifications Authority
SAG
Assessment Guideline
SBA
School Based Assessment
SMK
Subject Matter Knowledge
CHAPTER ONE.
1.
INTRODUCTION.
1.1 AIM.
“A student’s failure or lack of understanding can be understood in the light of un-discerned aspects. So the discernment of critical aspects is essential for learning. From this theoretical point of departure, in a learning study, the teachers try to find out what the critical aspects are and how they should be brought out in the learning situation in a way that makes discernment possible.”
(Runneson, Kullberg & Maunnula, 2006, p. 266).
The above quotation alludes to the idea that because teachers engage in the process of teaching, they should provide opportunities for learners to discern the critical aspects of the concept in a lesson. The failure of learners to discern the critical aspects of the concept in a lesson can result in the learners failing to understand the concept or the learner’s lack of understanding of the critical aspects of the concept. The issues of discernment, and affording learners the opportunity to discern the critical aspects of a concept, are explained in Chapters 4 and 5.
The notions of discernment and critical aspects of a concept emerge from variation theory developed in Sweden which is extensively applied by researchers like Marton, Runesson & Tsui (2004) in their research on teaching and learning of concepts. These aspects have been put to use in various Learning Studies1, which is a focus of this research. These aspects of variation theory are discussed in detail in Chapter 3. The principles that are inherent in variation theory and the challenges of the researcher’s own teaching through a version of a Learning Study are very intriguing. I was intrigued by the principles inherent in variation theory and decided to look at my own teaching through a version of a Learning Study.
1
A learning study involves a group of teachers coming together to plan and teach a topic that has been identified as problematic to the learners.
The ideas as stated by the quote above clearly emphasise the fact that teaching and learning in general is not a simple and straight forward activity. The ability to teach any subject
successfully requires more than the knowledge of the particular subject. Teaching and learning involve the knowledge of how to apply the knowledge of that subject so that the learners can make sense of it, understand it and eventually be able to apply it. What the teachers know and do to make the knowledge of the subject accessible for their learners is of the utmost importance. This study is concerned with mathematics as a subject, and in
particular, the teaching of the concept of “function”.
“The desire of teachers to achieve meaningful teaching and learning that results in learners’ understanding of concepts in any subject, especially in the teaching of mathematical
concepts, does not mean that procedural knowledge should be ignored” (Even, 1990, p. 526). Resnick and Ford (1984, p. 52) assert that the “memorisation of certain facts and procedures is important not so much as an end to itself, but as a way to extend the capacity of the working memory”.
The memorisation of certain procedures is important in the development of a deep
understanding of the concept that is to be learned, particularly in this study, the concept to be learned is the notion of parabolic functions. Parabolic or quadratic functions require the application of certain algebraic procedures to the equation of a parabolic function. These procedures include the factorisation of the equation of the quadratic function to generate the -intercepts of the parabola. Other procedures involve placing the x-values of the parabolic equation to zero to generate the -intercept of the parabola as well as completing the square on the quadratic function to generate the turning point and the axis of symmetry of the parabola.
A common issue for mathematics education everywhere in the world is to manage both procedural and conceptual understanding of any concept. Learners need to know what a concept is, why it is that, as well as how to do and carry out procedures in relation to that particular concept. Managing all of these in a classroom can be quite difficult. For all educators that are trying to reform mathematics education, including those in South Africa, this is the key challenge.
Procedural understanding has been emphasised and has been the focus of mathematical teaching and it can be said that relaying procedural understanding is being done successfully. The key issue in the learners’ acquisition of mathematical proficiency is by mastering
procedural understanding and conceptual understanding of a concept (Kilpatrick, Swafford & Findell, 2001). Kilpatrick et al. (2001) identified ways in which both procedural and
conceptual understanding of any concept could be mastered in order for the learners to become mathematically proficient. One of the ways in which this could be achieved is through strands of mathematical proficiency.
Strands of mathematical proficiency involve learners’ ability to “apply knowledge to solve problems, learn new concepts and skills, adapt the knowledge they acquire to different situations, apply mathematical reasoning to different problems and to view mathematics as a useful tool that must constantly be sharpened” ( Kilpatrick, et al., 2001, p. 144). These
strands are: conceptual understanding; procedural proficiency; strategic competence; adaptive reasoning and productive disposition. As these strands are intertwined, they do not have to be acquired by the learners in any specific order. The importance of the strands of mathematical proficiency for this study are that learners’ ability to flexibly convert from one functional representation to the next is one of the main factors that contribute towards learners’ ability to interpret functions in all their various representations.
This study explores one possible way in which learners’ conceptual understanding could be enhanced. Conceptual understanding allows learners to adapt their knowledge of concepts in order to solve problems in any given situation. Hopefully this study will help in contributing to the approach teachers could apply in the teaching of functions. In doing so, learners could be provided with better opportunities to learn what educators intend for them to learn, which, in this study, is the notion of functions and the parabolic function in particular.
1.2
PERSONAL DILEMMAS.
As the researcher of this study, there is a personal aspect to my role in this study. I am an experienced teacher who has been teaching Mathematics at secondary school level for twenty eight years (28 years). I teach in a school where learner performance is known to be poor. Due to the persistent poor performance of learners, the school has been classified as an under-performing school and has been put in the ‘Intensive Care Unit2’ (ICU) by the Department of
2 A school that is persistently exhibiting poor performance of learners is classified as an under-performing
Basic Education (DBE). A school that has been put under the ICU is one that is constantly visited and monitored by the DBE facilitators to ensure that teaching and learning is
constantly taking place and that the teachers adhere to the requirements of the work schedules as designed by the DBE. This monitoring of teaching and learning will continue until the performance of the learners improves to the satisfaction of the DBE.
I also consider myself as a dedicated and hardworking teacher. The learners in my school come from an underprivileged home environment that is based in a community that is riddled with crime and substance abuse by both the learners and some of the members of the
community. Some learners come from child-headed households. These factors make conditions in the school where I teach difficult and trying. I began my study in 2012 by administering a diagnostic test to my own class of Grade 11 learners. This test was
administered after the section on functions was taught to my Grade 11 learners in 2012 and they performed poorly. The details of the diagnostic test appear in Appendix D.
The aspects of functions that the learners were tested on were based on the sections that I refer to as algebraic functions. By algebraic functions I refer to those functions taught in school that can be represented by an algebraic equation and specifically the line, parabola, hyperbola and the exponential functions.
The Umalusi report of the Grade 12 performances on the algebraic functions from the year 2008 up until the year 2011 included the section on algebraic functions as one of the
problematic areas over the years. This report consists of the problematic areas that the Grade 12 learners experienced (from 2008 – 2011) in the National Senior Certificate (NSC)
examinations. The contents of the report are elaborated on later in this chapter and the problematic areas in the topic of functions as identified in the report, form the focus of my study.
To my surprise, my learners did much worse than I had expected considering the fact that I had taught them myself. This was very difficult for me to comprehend and accept as these learners were taught by me. I have to say that I was shocked by what I saw and as I could not blame anyone but myself, I was encouraged to improve my teaching more than ever.
This study is based on my experience as a teacher, specifically about focussing on the object of learning (what the lesson intends the learners to be aware of and ultimately discern). In this study, the object of learning is focussed on the interpretation of the key features of a
parabolic function in a lesson. This study focusses on the parabolic function as this happened to be the area where my learners appeared to have the most problems with. I was interested in improving my practice as I could not blame anybody else for the poor performance of my learners after the shocking results of the diagnostic test on functions that was given to my learners.
I structured my teaching, thinking and focussing on a version of a learning study that is mainly used for variation theory. Variation theory concentrates on identifying the object of learning and then with the help of variance and invariance, separation, generalisation, fusion, simultaneity and contrast as the patterns of variation, the learners are provided with
opportunities to discern the object of learning. These patterns of variation are elaborated on in Chapter 3, which deals with the theoretical framework that informs this study.
This study is concerned with the aspects of the parabolic function that the learners should discern and the study aims to discover whether this approach will make a difference in the way that my learners performed on the post-test that was written immediately after each intervention lesson, which were planned using the principles of variation theory. This forced me to go back and think more about what I did differently in the lesson(s) that brought about a difference in the learners’ performance compared to the lesson(s) prior to the test I my learners underwent in which they performed so poorly.
I did not suddenly change my personality nor did I suddenly become a teacher who uses group work as an approach to teaching. This study is about what it is that I changed in the presentation of my lesson(s), how I changed it, why I changed it and what affect it had on my teaching and my learners’ performance. Looking at this study I noticed that the changed approach and structure of my lesson did make a difference but it wasn’t immediately very clear to me what exactly the difference was.
I discussed the results of the lessons with my supervisor who pushed me to identify the changes in the lesson(s). I realised that one thing that did change was how I structured my lesson(s) and not so much how I delivered the lesson(s) that brought about the change in the learners’ performance. This study is therefore an interesting illustration of how an educator can improve their teaching and learners’ learning without uprooting everything that they know.
I taught in the way I normally do and I used the computer as a resource to present the lesson on presentation slides using Microsoft PowerPoint 2010 to prepare the presentation slides. This form of presenting the lesson saved a lot of time brought about by writing on the chalkboard and simultaneously talking to the learners. What really helped in the success of the lessons was that the lessons were well-prepared beforehand with all the critical aspects clearly stated and neatly placed on the slides in presentation form.
The key aspects of the lessons were presented on slides that were introduced one at a time and explained as one sentence at a time giving the learners enough time to concentrate on one key aspect of the lesson. In so doing the learners were afforded the opportunity to discern the variation from one form of the key aspect of the parabolic function to the next one. The lessons were in line with the construct of the theory of variation that is explained in full in Chapter 5 where the intervention lessons are discussed.
As was previously mentioned, the school is an underprivileged school that was recently presented with laptops for being part of a teaching and learning improvement plan initiated by the Wits Maths Connect (WMC) project situated at the Wits University’s Department of Mathematics Education, which is aimed at improving the achievement of learners from underprivileged schools in mathematics. The WMC afforded the school a set of tools that enable the practice of teaching and learning of mathematics while using different resources. In this report, the process that unfolded and how I was provided an opportunity to think carefully and act deliberately in improving my teaching is discussed. I have briefly attempted to introduce the areas that this study focussed on. In the following section, the factors that led to the choice of my research topic and the critical questions that underpin this study are explained explicitly.
1.3
INTRODUCTION TO THE RESEARCH PROBLEM.
The 2012 National Senior Certificate (NSC) report (Umalusi, 2012, p. 98) shows that Mathematics attainment throughout South Africa from the year 2008 to the year 2011 was
poor as is graphically depicted in Figure 1.
Figure 1: Overall achievement rates in Mathematics from 2008-2011.
The focus of this study is on the section of mathematics concerning ‘algebraic’ functions and graphs. Algebraic functions constitute about 33% of the overall Mathematics mark for both papers one and two of the Mathematics examination and is therefore an important section of the Mathematics curriculum for learners to be able to obtain a pass percentage in the final matriculation papers. Questions on algebraic functions and their graphs were generally poorly answered by learners in the NSC Grade 12 examination papers in the past years as reported at the beginning of the year road shows.
The road shows are sessions organised by the Gauteng Department of Basic Education (GDBE) at the beginning of each year to inform educators of the learners’ performance in the previous year’s Grade 12 NSC examinations in selected subjects. The “comprehensive” report on the performance of learners in each question relating to the National Senior Certificate (NSC) Mathematics examination are discussed in relation to the analysis of the results of the NSC and jointly reported by Umalusi and the Higher Education South Africa (HESA) and is published by the Department of Basic Education (DBE).
The Umalusi report is presented for use by teachers, subject advisors, circuit managers and district managers in their preparation of the learners for the current years’ NSC examinations. The report contains the overall quantitative analysis of the achievement rates in the subject for the previous years that the curriculum on the subject was written to show an overall trend of learners’ performance in the particular subject, the general qualitative overview of learner performance and the qualitative analysis of learner performance in individual questions in all the papers written in that subject.
For each question, the common errors and misconceptions of learners are analysed and suggestions for improvement on those errors and misconceptions are highlighted. As this
0.0 20.0 40.0 60.0
%
of
le
ar
ners
2008 2009 2010 2011Mathematics
% Achieved @ 30% and above % Achieved @ 40% and above
study was conducted in the year 2012, for functions and graphs in Mathematics, in the previous years’ papers prior to the year 2012, the report found that for the end of 2011 final Mathematics examinations, learners could not deal with inequalities. It was reported that learners could not express the inequality relating to the intervals where the values of constituted the interval depicting where the given function was positive. Learners also had difficulties when they were required to find the coordinates of the intercepts with both the axes as they wrote the answers to both questions as a unit instead of as separate sections. The case under discussion was where the learners had to consider the function
( ) . Learners had to calculate the coordinates of both the -intercepts and - intercepts of this hyperbolic function. The learners responded to this question by giving the coordinates of the -intercepts as one point consisting of the asymptotes of the hyperbola. The response to the coordinates of the x-intercepts was given as ( ) rather than
specifically answering the individual questions as the coordinates of the one - intercept to be ( ) where and and the coordinates of the -intercept as ( )
representing the coordinates of the other -intercept where and , which was required by the questions (Umalusi, 2012). This difficulty is a result of the learners’ inability to use the functional notation correctly, their interpretation of the different functional
notations as well as the meaning associated with each form of functional notation. The difficulty with the inequalities arose where learners were required to find the interval where the function ( ( ) ), meaning the interval where the function was above the -axis. The answer to this question was that this happened in the interval when
Learners who attempted to answer this question failed to notice that should also be less than 3 (Umalusi, 2012). This error was evident in the pre-test that I gave to my learners in a question that required learners to determine the interval at which the parabolic function was decreasing and for which values of two functions ( ) ( ), for . The learners could not globally interpret the trends where the given functions satisfied the required inequalities.
Questions that required the average gradient between two points on the curve, learners made errors where arbitrary coordinates were used for the points where was equal to and into the equation ( ) ( ). Learners needed to calculate the values of ( ) and ( ) by
substituting the -values into the given equation while the intercept was known instead of substituting and and solving for for both values (Umalusi, 2012). This finding is not surprising, based on my experience of dealing with functions, when learners were asked to identify the types of functions when given the functions: ( ) ; ( ) ; ( ) ; ( ) . Based on their answers, it can be said that learners are sometimes able to correctly classify the functions as parabola; hyperbola; exponential and straight line respectively but when required to interpret the meaning of ( ) in some of the equations above, they could not explain that this was representative of the point on the particular graph where the coordinate of was . Learners are expected to be able to identify and name these functions by the time they reach the Further Education and Training band (FET), which consists of Grades 10, 11 and 12.
According to the Umalusi report, some learners found a question requiring them to draw a sketch graph of the function where difficult to answer because the equation consisted of parameters only. This also happens when learners are required to find the solution to the equation which has two equal roots as the solution. This question expects learners to be able to interpret their knowledge of the nature of the roots and to make use of the discriminant .
The aims of the questions are to find out whether the learners have the global understanding of the equation of the quadratic function. This presented a problem to the learners as the parameters of the function and the equation were stated in general form and some learners were not used to working with general parameters and therefore found the question
unfamiliar. Most learners found the questions unfamiliar and therefore omitted them. Those learners who did attempt the questions managed to score a few marks.
Learners could not link the general function and its equation form to the importance of the nature of the roots, given by the discriminant , as an approach to such questions. The discriminant stipulates that the roots of the quadratic function/equation will be: real and equal if ; real and unequal if and a perfect square; real, irrational and unequal if and not a perfect square and non-real if .
Suggestions to improve on these problems were that teachers should be aware that in the Subject Assessment Guideline (SAG) document it is stipulated that there existed a need for learners to know the effect of the various parameters in the general equation of the parabola.
The SAG suggests that learners should first know the basic curve, called the “parent” curve, and then be given ample opportunity to investigate the effects of changing the values of the various parameters as part of an investigative School Based Assessment (SBA) in Grade 11 (Umalusi, 2012, p.101).
The report also emphasises the need for teachers to ensure that the learners are familiar with the standard formulae and defining equations of the various families of functions. These should be taught in such a way that the learners can have a visual picture of the graph from the standard formula of the function and that learners should be exposed to more situations where they are required to “convert flexibly between the various multiple representations of functions (words, symbols, graphs and tables)” (Umalusi, 2012, p. 102).
The report further states that the learners need to pay attention to the notation of the function and that many learners struggled with the derivation of the equation of a cubic function when given a cubic graph and the turning points ( ) and ( ). The learners were required to show that and for the cubic function: ( )
. Learners did not know how to use the given information in order to arrive at the given values, because they did not know which form(s) of the cubic function they were expected to use (Umalusi, 2012, p. 103).
This problem resurfaced with my learners in the pre-test when they were required to show that the values of a parabola: ( ) , and for a given sketch of a parabolic function with turning point ( ) and another point ( ) on the parabola. My learners did not know which form of the parabolic equation to use in order to show these values, but instead used the given values as if they were originally given without showing how the values were acquired. This is an indication that the learners do not know which form of the equation of an algebraic function should be used given different points of an algebraic graph.
Another problem that was evident for most learners was that when learners were given a function and required to complete the square on the right hand side of the function in order to find the turning points of the parabola, they solved the right hand side as they would solve a quadratic equation where the - value was equal to zero. The learners divided each term on the right hand side by negative one, thereby ignoring the fact that this was not a quadratic equation equal to zero. When they multiply the right hand side by a
negative number they should get the answer of ( ) instead of the answer as it would be if this was an equation where the value of . This is an indication that the learners do not know the difference between an equation and a function (Umalusi, 2012, p. 104).
Suggestions to improve the way learners understand these variations were that teachers needed to introduce learners to graphical interpretation questions as per the Examination Guideline Document. The importance of understanding the difference between an equation and a function should also be stressed from the General Education and Training (GET) phase (Grades 8 and 9).
This study was conducted before the end of the 2012 National Senior Certificate (NSC) examinations. The 2012 Umalusi report on functions brings out similar problems. According to the 2012 report, these problems persist, which is an indication that the interpretation of functions still remains an area of difficulty beyond the year 2012 which is the year this study was conducted.
In my experience as a Mathematics teacher, I also identified that learners seem to have difficulties in recognising relationships between variables in terms of numerical, graphical, verbal and symbolic representations and to flexibly convert between these representations (tables, graphs, words and formulae). The pre-test that I gave to my learners also confirmed these errors.
The aspects of functions that were tested in the pre-test consisted of:
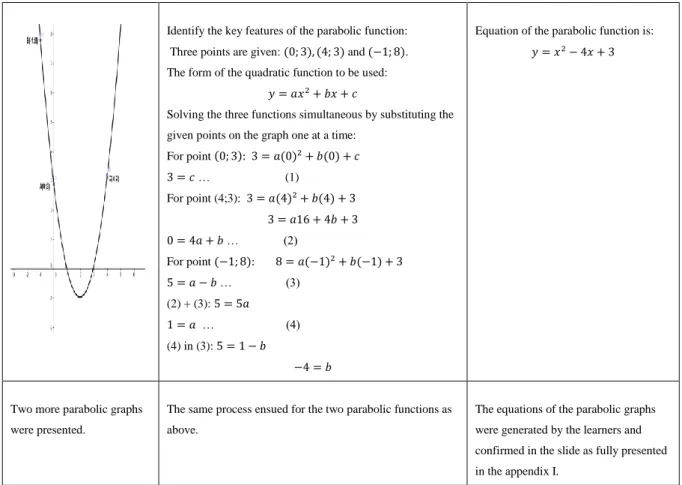
Finding the equations of parabolic sketches given three points on the parabola.
Finding the equations of parabolic sketches given the -intercepts and another point on the parabola.
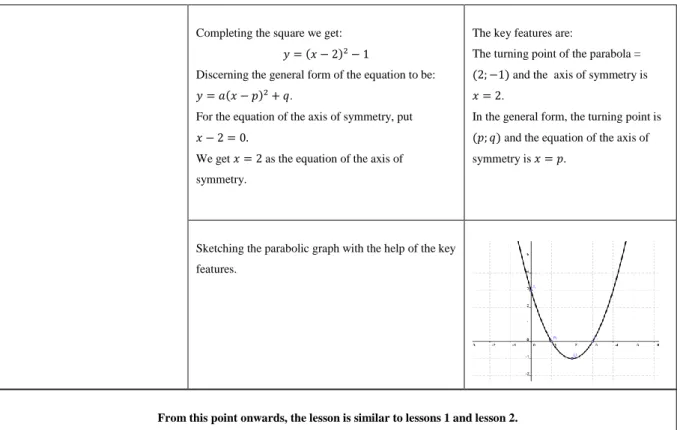
Finding the equations of parabolic sketches given the turning point and another point on the parabola.
Sketching the graph of the given exponential equation of the graph and explaining what happened to the graph when the horizontal transformation of the exponential function is given.
Matching different algebraic graphs from one column with their appropriate representations in the next column.
Interpreting a contextual problem on the exponential function and determining the intervals in which the linear, parabolic and exponential functions were greater or less than the other.
Finding the distance between two points.
The most pertinent problem that informs this study is the inability of learners to interpret the algebraic functions, specifically the quadratic function from different representations. The functional representations that are the impetus for this study consist of the graphical representation of the parabola and its related equation form, and the interpretation of the different forms of the equation of the parabolic function with regards to the graphical representation.
The pre-test administered to the Grade 11 learners at the beginning of this study revealed that the most problematic area relating to the function concept was that:
(i) Learners tended to substitute the given values of the points on the sketch of the parabola in the wrong general form of the quadratic function.
(ii) When learners were required to find the equation of a parabolic function when they were given the sketch of a parabolic function showing the coordinates of the turning point of the parabola and another point on the parabola, learners tended to substitute the given values of the turning points in the wrong form of the quadratic function.
(iii) This occurrence was also evident when they were required to find the equation of a sketch of a parabolic function where the coordinates of the - intercepts and another point on the sketch of a parabolic function were given and when the coordinates of any three points on the sketch of a parabolic function were given.
The following section elaborates on the problem statement that underpins this study and the research questions that this study pursues and intends to answer.
1.4
PROBLEM STATEMENT.
With regards to the preamble on the areas of the concern described by the above report as well as my experience in the teaching of mathematics at FET level, I then decided on
conducting a study on algebraic functions. The Mathematical problem that this study focusses on is the interpretation of algebraic functions, specifically quadratic functions, by learners
when these functions are presented to them in different representations (graphical and
equation form). The study also focussed on the features of algebraic (quadratic) functions, the manipulation of quadratic functions using algebraic processes involving factorisation
(resulting in the coordinates of the - intercepts of the parabola) and completing a square of the quadratic function (resulting in the coordinates of the turning point).
The identification of the different characteristics of the quadratic functions when given the parabola in graphical form and interpretation of the different forms of the parabolic equation and the respective features presented by each form of the parabolic equation are investigated. These aspects of the quadratic function were identified to be problematic for my learners after the learners’ dismal performance in the pre-test given to them to find out the areas of
functions that they had problems with.
The following section articulates the research questions and the critical questions that inform this study.
1.5 RESEARCH FOCUS.
This study investigates an intervention, informed by variation theory, of Grade 11 learners’ interpretation of algebraic functions.
1.6 CRITICAL QUESTIONS.
1.6.1. What aspects of functions do learners find to be problematic? 1.6.2. Which of these aspects appear most problematic?
1.6.3. How does a version of a learning study (which is framed by variation theory) improve the Grade 11 learners’ interpretation of algebraic functions and to what extent?
1.7 RATIONALE.
This study was selected because of the discoveries made from the diagnostic test of my Grade 11 learners. From the results of this test on functions, it was discovered that learners did not
know how to find the equation of a parabolic function when they were given the graphical representation of a parabola. The learners also did not know which form of the quadratic function to use in order to find the equation of a parabolic function and also could not interpret the critical aspects and key features related to each form of a quadratic equation. This resulted in the learners’ inability to answer most of the questions on the parabolic function or any graphical representation of an algebraic function.
The study is important within the field of Mathematics Education as it might contribute to enhancing the learners’ knowledge and interpretation of graphs in Mathematics, Physical Science, Natural Science, Mathematical Literacy and life in general. It could contribute to enabling other educators to reinvestigate their approach to their teaching of algebraic
functions. Additionally, the study could inform teachers about the potential of action research informed by variation theory in the teaching of the concept of functions and other
Mathematical concepts.
The suggested distribution of marks for Grade 12 in the NSC question papers for Learning Outcome 2 (LO2): Functions, graphs and modelling is 33% of the paper. This has a large influence on the mark in the curriculum and if learners do not attempt this section of the paper, their chances of achieving a promotional percentage in the paper are reduced.
This study also carries some personal weight for the researcher as an educator as it helped to identify the learners’ conceptions of a function and the interpretation of functions, including the factors that affect the smooth transition of learner’s conceptions of functions from the GET to the FET phase. It helped the researcher to improve the approach to the teaching of algebraic functions, their interpretation and other concepts in Mathematics as well.
The study is also important in South Africa currently, because it could help to improve the teaching of the concept of algebraic functions in the GET and the FET phase. It could contribute to the enrichment of the knowledge base on the topic of functions for
education/curriculum planners/ teachers and learners, because a strong understanding of the concept of algebraic function is essential for any student hoping to understand calculus, which is a critical course for the development of future scientists, engineers, and
1.8
OUTLINE OF THE STUDY BY CHAPTERS.
In Chapter 1, the justification and relevance of the study, the aim of the study, the topic of the study and the critical questions that the study aims at answering is discussed.
Chapter 2 describes the literature base that informs the study. The focus is on functions and the research undertaken on functions by other researchers on how and why learners find it difficult to understand, interpret and apply the notion of functions in their daily lives.
Chapter 3 presents at the theoretical framework that informs the study. Research on variation theory is also explored, with a focus on the use of variation theory in learning studies in Mathematics. As the study is informed by variation theory, the patterns of variation that could be employed during the lessons on functions and the dimensions of the function that could be varied are fully discussed.
Chapter 4 looks at the research methodologies applied and all the data collection techniques employed to obtain answers to the critical questions: “what aspects of functions do learners find problematic?” and “which of these aspects appear most problematic”? Challenges during data collection are highlighted and the question of rigor which includes reliability and
validity of the data, generalisation and ethical considerations taken are also discussed. After the identification of the most problematic aspect of functions from the results of the diagnostic test, the setting of the research project is explained in greater detail. This
explanation gives insight into how and why the data collection instrument is used and what transpired during the intervention to explore the question “to what extend does a version of a learning study framed by variation theory improve the Grade 11 learners’ interpretation of algebraic functions?”
In Chapter 5, the intervention lessons are fully described and it is explained how these lessons were aligned with variation theory. What transpired in the lessons is noted and the reflections of each lesson are also discussed. The transformations that occurred to the lessons after the each consultation with the observers taking part in the study are also described. A summary of the intervention lessons is presented according to the processes followed and presented by Tall & Bakar (1991) without the use of the function machine.
The observation schedules used by the three observers that were involved in the study were also used in the discussion of the intervention lessons and the changes that were to be implemented. The post-test was also used to ascertain where the changes to the intervention lessons could be applied. The limitation of the action research in the form of a version of a learning study is also discussed.
Chapter 6 presents the analysis and explanations of the use of the mixed methods research analysis to analyse the data from the diagnostic/pre- test and the post-test. The features of the diagnostic test are discussed and analysed and the results of the test are analysed. Each question of the diagnostic test and the post-test is analysed and interpreted with reference to the researchers who had done some research on the type of questions being analysed. The sample of learners is divided into three groups and the results of the learners are analysed per group, per question using descriptive statistics.
The three questions in the post-test consists of questions 1.1 and 1.2 and question 5.1 of the pre-test. The first two questions are exactly the same as those in the pre-test; only the numbering had changed from 1.1 and 1.2 to questions 1 and 2 respectively. The third
question in the post-test was a modified version of question 5.1 in the pre-test. This question concentrated on testing the ability of learners to flexibly convert between functional
representations. The results of the three groups of learners’ performance in pre-test and the post-test are compared to ascertain whether the intervention lessons had any impact on the learners’ performance.
In Chapter 6, the results of both the pre-test and the post-test are discussed with reference to the literature review. Reference to the analytical and theoretical framework of the study is further elaborated on with regards to the results. The different approaches used in the intervention lessons are compared with the results of the learners’ results in both tests. The incorporation of the theoretical framework from the variation theory is fully explained with respect to the learners’ results in both tests.
The results of both tests are used to propose answers to the research question, the focus of the study and the critical questions. The intervention lessons, the literature review, the research question and the critical questions of the study are all combined to give results for the main focus of the study. The recommendations as well as the limitations of the study are discussed in relation to the study as a whole.
Chapter 7 concludes the study by reflecting on the findings from the intervention lessons and the comparison of the pre-test and the post-test results. The implications that the findings of this study have for teachers in their teaching and curriculum planners in general are
discussed. The difficulties that were experienced by the researcher when undertaking the study and how these difficulties were overcome are also addressed. Recommendations for further research are articulated.
CHAPTER TWO.
LITERATURE REVIEW.
2.1
INTRODUCTION.
This study is concerned with the Grade 11 learners’ interpretation of algebraic functions, specifically the version of a learning study (described further below) conducted on a particular sample of the Grade 11 learners that was used in this study. In this chapter, discussions prevalent in the research literature in as far as the notion of functions is
concerned are reviewed. In particular, the aspects of algebraic functions that were found to be problematic to the learners from the results of the diagnostic/pre-test and the researchers are discussed.
The literature review is structured along the lines of what the literature informs us about why functions are important and how functions are structured in the South African curriculum. Learners’ difficulties in working with functions, as seen by other researchers, are discussed. The learners’ misconceptions and what contributes to these misconceptions regarding functions are further explored. Teaching perspectives, what it is that teachers should think about when teaching functions, is explored.
The exploration of literature commences with the definition of a function and will proceed to how these aspects relate to the study. This study is about ‘the interpretation of functions’ beginning with ‘what aspects of functions learners find problematic’ and then moving on to ‘which of these aspects appear to be most problematic to the learners. All of these aspects are reflected in the results of the diagnostic/pre-test.
The importance of functions and why functions should be taught in school, which aspects of functions are emphasised in the curriculum and misconceptions related to the function concept are discussed. The misconceptions include misconceptions arising as a result of the definition and functional notation. The literature related to multiple representations of functions, in particular the equation and the graphical representation, are discussed.
Literature about learner misconceptions of the constant function brought about by the misinterpretation of the definition of a function is considered. Literature pertaining to the misconceptions of the multiple representations of functions brought about by the prototypes used when functions are first introduced to learners is highlighted. Literature on the
misconceptions that learners acquire with regards to the functional notation leading to the problems that learners encounter in their dealings with the function concept also is referred to.
Literature on the nature of functions that leads to learners’ inability to interpret functions when they are presented in different ways and the interpretation of functions and the research pertaining to these aspects of functions is explored. The features of functions that emerge as critical for learners to discern the object of learning are discussed. The function that is appropriate to this study is specifically the parabolic function. Additionally, the features of functions that make functions an important topic to be studied are discussed as the focus of this study.
The features of the functions that are referred to are the intercepts with the axes, the shape of the function and the turning point of the function. These features are discussed specifically with regards to the parabolic function in this study. These features are explored in relation to the equation of the parabolic function and the graphical representation of the parabolic function and how the different forms of the equation of the quadratic function can be interpreted. Studies conducted by Mathematics Education researchers on functions with regard to the aforementioned topics are dealt with and their findings are identified and explored.
2.2
LITERATURE ON FUNCTIONS.
A lot of research has been done on the topic of functions and the findings of the research are beneficial to teaching and research in this particular field. Nonetheless, the difficulties associated with the teaching and learning of functions persists as is evident in the Umalusi report that is discussed in Chapter 1. The difficulties are also clear based on the
Many reasons have been given for why learners may find it difficult to develop a deep understanding of functions. Some of the reasons given by the researchers are in related to the definition of a function; the multiple representations of functions; the nature of functions; the interpretation of functions; functional notation and the way in which functions are taught.
The aim of this study is however about teaching and students learning of algebraic functions. Therefore, the teaching and learning of algebraic functions should be done in such a way that it enables learners to interpret the parabolic function when it is represented in different ways (specifically from the equation form to the graphical form and from the graphical form to the equation form). The teaching and student learning of functions should afford learners the ability to interpret the different forms of the parabolic equations.
The following section elaborates on the importance of multiple representations of functions and what researchers have found on the importance of functions in school learning and in everyday life.
2.2.1 WHY MULTIPLE REPRESENTATIONS OF FUNCTIONS ARE SO IMPORTANT?
The rationale behind the subject of this study alludes to the fact that a strong understanding of the concept of algebraic function is essential for any student who hopes to pursue
Mathematics at tertiary level. The literature also supports the fact that the understanding of functions is important, as expressed in the following quotation: “A strong understanding of the function concept is central to undergraduate mathematics, is a foundation to modern mathematics and essential in related areas of the Sciences. In other words, it is a gateway for any student hoping to understand calculus, a critical course for the development of future scientists, engineers and mathematicians” (Oerhrtman, Carlson & Thompson, 2008, p.151). According to Leinhardt, Zaslavsky & Stein (1990, p.2) “there are aspects of learning and teaching specific content that are unique and more conspicuous to the particular topic than to the general field of teaching and learning as a whole”. The authors focus on the topics of functions and graphs as they discovered that these topics were not dealt with until the
elementary grades or later. Functions and graphs focus on the use of a variety of symbolic systems which can be expanded to other learning areas as well.
Graphing is considered to be important in Mathematics learning as it “enables learners to acquire the transformational notion that is important in regrouping and expanding the number system from counting numbers to rational numbers, adding and subtracting numbers,
multiplying and dividing these numbers. These concepts are transferable to other parts of Mathematics as well as other learning areas” (Leinhardt, et al., 1990, p. 5).
Furthermore, Oehrtman, Carlson, & Thompson (1998) state that functions and their graphs should not be construed as isolated concepts as they complement and illuminate each other. The authors surmise that the Mathematical representations and the scientific representations of concepts often follow the processes to flexibly move from one representation to another representation in the fields of Mathematics and Science. This idea is represented in Figure 2.2 below:
Mathematical Scientific
Figure 2.2: Mathematical representations and scientific representations of concepts.
These Mathematical and Scientific representations, when construed as isolated concepts, result in learners who are capable of solving graphical and functional problems in
Mathematics being unable to access their knowledge in other learning areas such as Science. Based on this explanation, it becomes important for the teaching of functions to be integrated with other learning areas so as to avoid the isolation of the notion of functions from other related areas. These Mathematical and Scientific representations of functions and their graphs take into consideration the ability of learners to flexibly move from one representation of a
Ordered pairs Graph Algebraic function rule Observation Data array Ordered pairs Scale construction of graph Function
function to another. The approach to integrate learning areas is elaborated on by various researchers.
As far as functions are concerned, Even (1998); Goldin (1987); Janvier (1978); Lesh, Post & Bohr (1987); Marchovits, Eylon, & Bruckheimer (1983); Monk (1988) all address the critical problem of transitioning between and within representations. All these researchers agree that the flexibility in moving from one representation of a concept to another is intertwined with other kinds of knowledge and understanding of problems. Functions are important, because they enable learners to distinguish between visual attributes and physical attributes of physical structures.
This is proved in various research findings. Researchers like (Carlson, 1998; Monk, 1992; Monk & Nemirovsky, 1994) discovered that students have difficulties in distinguishing between visual attributes and graphical representations of physical structures and similar perceptual attributes of a graph of a function modelling a situation.. An example of such a situation is the representation of the side view of a person cycling up a hill, as depicted in Figure 2.3(a).
d e f c g
a b h i
Figure 2.3(a): Visual representation of a physical structure.
The research shows that approximately 88% of A- students make mistakes of representing this scenario as a parabolic function, as shown in Figure 2.3(b) (Monk, 1992):
The students tend to copy features from the diagram into the graph directly. This is a result of “conflating” the shape of the graph with the visual attributes of a situation under
consideration (Monk, 1992; Monk & Nemirovsky, 1994; Carlson, 1998).
It is apparent from the literature, that it is imperative that learners become acquainted with the notion of a function so that they are able to interpret functions in their multiple
representations and various attributes. The interpretation of functions forms an important factor that contributes to the importance of the teaching and learning of functions. The interpretation of functions enables learners to interpret many contextual problems that appear and are experienced by learners in their everyday life (Oehrtman et al., 2008).
The literature clearly described why the teaching and learning of functions is so important. Based on this, the South African curriculum is analysed to discover how functions are dealt with in the teaching and learning of specifically algebraic functions.
2.3
THE SOUTH AFRICAN CURRICULUM ON FUNCTIONS.
Before articulating what the South African curriculum suggests in terms of the teaching and learning of functions, it is important to understand what is meant by the word “curriculum”. The curriculum or (curricula) is what the state deems to be important for its citizens to learn and consists of four components. The first component is “Goals”, which include the
“benchmarks or expectation for teaching and learning and are designed in a form of a scope and sequence of skills to be addressed”. The second component is “Methods” which includes specific instructional methods for the teacher that appears in Teacher’s Editions of the
curriculum. Thirdly, the “Materials” consist of media and tools to be used for teaching and learning. And the fourth component is “Assessment”, which aims to measure the student’s progress (Eisner, 1994, p. 96).
However, “the South African curriculum takes as its starting point a clear political agenda and the need to transcend the curriculum of the past, which perpetuated race, class, gender and ethnic divisions. It emphasised separateness, rather than common citizenship and nationhood”. (Department of Education, 1997, p. 1). The old curriculum included the four components: goals; methods; material and assessment as described above. The South African
curriculum is based on the seven critical outcomes as described by the South Africans
Qualifications Authority (SAQA) of 1995 whose primary objective is the promotion of a high quality education and training system in South Africa that embraces the concept of lifelong learning for all.
According to these critical outcomes, learners are required to be able to:
Identify and solve problems and make decisions using critical and creative thinking
Work effectively with others as members of a team, group, organisation and community
Organise and manage themselves and their activities responsibly and effectively
Collect, analyse, organise and critically evaluate information
Communicate effectively using visual, symbolic, and/or language skills in various modes
Use science and technology effectively and critically, showing responsibility towards the environment and the health of others
Demonstrate an understanding of the world as a set of related systems by recognising that the problem solving contexts do not exist in isolation.
The teaching of the concept of a function satisfies all of these critical outcomes as outlined by the SAQA of 1995. The next section outlines what the South African curriculum expects teachers to concentrate on when teaching functions. It also defines what the learners should know in this regard in the Further Education and Training (FET) phase (Grades 10 to 12).
2.3.1 FUNCTIONS FOR GRADE 11’S IN THE SOUTH AFRICAN
CURRICULUM.
TheSouth African curriculum is divided into Learning Outcomes and related Assessment Standards. Functions are part of learning outcome 2 (LO2). Learning outcome 2 and the assessment standards pertaining to it (as prescribed by the National Curriculum Statement (NCS) of South Africa for the learning area of Mathematics in the FET phase for the topic on functions) are detailed and represented in Appendix H.
The aspects of functions that are included in the South African curriculum require learners to understand various types of functions, to find values of the dependent variable by finding