LSL Property Services/Acadametrics
England & Wales
House Price
Index
MAY 2013
STRICTLY UNDER EMBARGO UNTIL 00.01 FRIDAY 14TH JUNE 2013
Y 10TH JUNE 2011
House prices rise to highest on record in May
Beats previous peak in February 2008
House prices £6,125 higher than May 2012; sales up 10,000 year-on-year
But it is London driving most of the increase – northern regions are still struggling
House Price Index Monthly Change % Annual Change %
£233,061 237.3 0.4 2.7
David Newnes, director of LSL Property Services plc, owner of Your Move and Reeds Rains estate agents, comments: “House prices rose in May to the highest on record. Even taking inflation into account, the record high price is symbolic of the significant improvement in the housing market over the past year. Prices are £6,125 higher than in May last year, sales are up 19% over April, and prices have only dropped one month out of the past eighteen. The catalyst for all this has been significant improvement in mortgage availability. Life for first-time buyers is noticeably easier than it was six months ago. An abundance of great mortgage deals are on offer and lenders are more willing to lend to high LTV borrowers, which has led to a substantial rise in first-time buyer activity. Schemes like Help to Buy and Funding for Lending have acted like a steroid injection for the mortgage market and made it markedly stronger than last year.
“But it is not quite as good as it looks. Take London out of the equation and the average price falls dramatically. The red hot London market is giving the property market as a whole a deceptively healthy glow. London still leads the way in terms of house price rises with growth in 31 out of 33 London boroughs annually, and is the only region in England with average prices above previous record levels. The North/South divide is actually becoming more prominent as time goes on, and as the London market is more exposed to a wider audience of potential foreign buyers flocking to the capital. A strong economy is vital for the health of the property market and it is performing much better in London than in other less resilient parts of the UK, which are suffering from public expenditure cuts. More needs to be achieved to help banks lend to new buyers, as a strong improvement in first-time buyer lending is the crucial catalyst for a full market recovery.
“On top of that, the supply of mortgage finance is still constrained, despite improvements over the past year. Many buyers remain locked out of the market because they can’t afford to meet strict mortgage requirements and save enough for a deposit, which is why cash buyers still account for a high proportion of the total number of sales. Lenders’ caution will not disappear, as new regulations and controls continue to hamper their ability to lend. The only real solution is a sustained improvement in the wider economy which will help increase the supply of mortgage finance and improve demand for it.”
House price index: historical data
Table 1. Average House Prices in England & Wales for the period May 2012 – May 2013 link to source Excel
House Price Index Monthly Change % Annual Change %
May 2012 £226,936 231.0 1.1 3.6 June 2012 £227,083 231.2 0.1 4.4 July 2012 £226,996 231.1 0.0 3.7 August 2012 £226,351 230.4 -0.3 2.6 September 2012 £226,851 231.0 0.2 2.9 October 2012 £227,352 231.5 0.2 2.9 November 2012 £227,545 231.7 0.1 3.6 December 2012 £228,044 232.2 0.2 3.8 January 2013 £228,868 233.0 0.4 3.8 February 2013 £230,439 234.6 0.7 4.1 March 2013 £231,215 235.4 0.3 3.5 April 2013 £232,160 236.4 0.4 3.4 May 2013 £233,061 237.3 0.4 2.7
Press Contacts:
Melanie Cowell, LSL Property Services 01904 715 326 melanie.cowell@lslps.co.uk
David Pickles, Acadametrics 020 8392 9082 david.pickles@acadametrics.co.uk
Further commentary by Dr Peter Williams
Dr Peter Williams, housing market specialist and Chairman of Acadametrics, comments: House prices
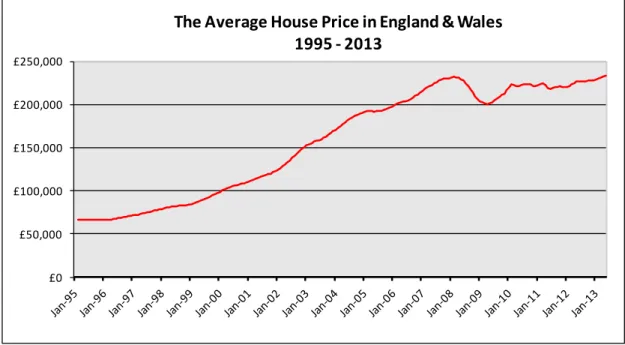
The average house price in England & Wales in May is £900 (0.4%) higher than that in April. It now stands at £233,061, a new record level for England & Wales, exceeding the previous peak reached in February 2008 at the height of the last housing boom. This gives a real sense of how far the recovery in the housing market has come, and sets an important context against which to evaluate government input, and what impact further measures may have on the market. In Figure 2 below we explore the degree to which this new peak is reflected in the separate regions, and in each London Borough and Unitary Authority area (Tables 3 and 4). However, we begin by placing the current average nominal house price into its historical context. Figure 1 below illustrates how the average house price has increased from February 1995 to the present day.
Figure 1. The Average House Price in England & Wales, Feb 1995 – May 2013 link to source Excel
In February 1995, some eighteen years ago, the average house price in England & Wales was £66,456. As the above graph demonstrates, house prices increased from month to month on a relatively consistent basis from 1995 until February 2008, when the lending crisis began to have an impact. On a monthly basis, during the period March 1995 – February 2008 (13 years or 156 months), house prices fell only eight times, with four of those falls taking place in the first twelve months. However, from March 2008 prices fell for fourteen consecutive months, such that prices in April 2009, at £200,234, were 13.6% below the peak seen in February 2008. Since April 2009 average prices have resumed their upward trajectory, albeit less smoothly than prior to the 2008/09 decline, and have now reached a new high of £233,061.
Figure 2. The % off the Peak Average House Price by Region, based on April 2013 prices link to source Excel
£0 £50,000 £100,000 £150,000 £200,000 £250,000
The Average House Price in England & Wales
1995 - 2013
-11.3% -10.8% -10.1% -9.7% -8.5% -7.6% -6.4% -2.2% -0.5% 0.0% 0.0% -12.0% -10.0% -8.0% -6.0% -4.0% -2.0% 0.0%Further commentary by Dr Peter Williams
As Figure 2 above shows, however, it is only in Greater London that average prices have reached a new record level, with all the other regions still having prices below their previous peaks, ranging from a shortfall of 11.3% in The North to 0.5% in the South East. Nevertheless, the impact of the Greater London region means that the average house price in England & Wales as a whole has also reached a new peak.
Table 2. The April 2013 average house price by Region, compared to the peak average house price by Region. link to source Excel
Region
April 13 Price
Peak
Price % off Peak Date
The North £142,526 £160,729 -11.3% Mar-08
Wales £151,821 £170,286 -10.8% Oct-07
Yorks & Humber £153,470 £170,651 -10.1% Dec-07
North West £152,243 £168,662 -9.7% Oct-07
East Midlands £162,319 £177,360 -8.5% Oct-07
West Midlands £172,018 £186,228 -7.6% Oct-07
South West £223,630 £238,903 -6.4% Oct-07
East Anglia £207,224 £211,944 -2.2% Feb-08
South East £276,123 £277,632 -0.5% Feb-08
Greater London £448,443 £448,443 0.0% Apr-13
All England & Wales £232,160 £232,160 0.0% Apr-13
As Table 2 above shows, most regions recorded peak house prices in the period October 2007 – March 2008. The sole exception was Greater London, achieving a new peak price in April 2013 and in turn pushing the average prices for England & Wales as a whole to new record levels. Moreover, there is a distinct North/South divide to the figures. Although the peak prices in the last housing boom occurred within a six month period across the whole of England & Wales, the recovery from the price falls in 2008/09 has been far more varied across the country, with regions in the South Eastern part of the UK recovering at a much faster rate than those in the North. Another trend to note from Table 2 is the inverse relationship between the value of the average house by region and the extent to which that price remains short of its peak. The lowest average house price is to be found in the North, where prices are furthest off their peak by 11.3%, while conversely prices in Greater London are the highest of all the regions, but now stand at their peak.
So why are prices currently at a new peak in Greater London, but not in the North? London’s role as a global city draws substantial numbers of wealthy purchasers from around the world. It is regarded as a safe haven for families and property, has a favourable exchange rate and taxation regime, and remains the epicentre of the UK economy. As the pivotal point of government, financial services, media and so on, London has a much stronger economy than other parts of the UK, fuelled constantly by new migrants drawn from both within Britain and abroad. Little wonder then that incomes and confidence are higher in London - and put together with the super rich already discussed, this means stronger house price growth - albeit not uniformly across London, as we have shown.
There is a view exemplified in the latest Economist house price index (May 2013) that housing in Britain is still overvalued. The Index suggests that house prices are overvalued by 19% against rents, and by 11% against income when compared to the long run averages on both measures. Certainly, using a simple price-to-earnings ratio property remains very costly, not least in London. However, on a mortgage cost-to-income ratio the picture looks much better, reflecting hugely reduced mortgage costs on the back of decreases in interest rates. With falls in house prices in both nominal and real terms there was every likelihood that affordability ratios would have drifted downwards over the next few years, hence bringing prices and wages into better alignment. However, with falling real wages, lower inflation and rising nominal house prices, that adjustment may be coming to an end. Indeed, with the arrival of the Help to Buy schemes - the equity loan scheme started in April - and the mortgage guarantee scheme due to start in January 2014, there have been increasingly upbeat comments on the future course of UK housing prices. The investment bank Morgan Stanley has recently made a central case for an 8% rise in 2014, and there has been extensive commentary on the possible impact of Help to Buy mortgage guarantees on price rises. Certainly, with housing supply still far too low relative to demand there is a risk we will see effective demand rise and with it house prices. The government is clearly aware of the tensions and is trying to balance the stimulation of growth and confidence alongside cautious stewardship, and this is no easy task. We will continue to monitor the situation closely. As our charts and tables show there are probably parts of the UK where both local authorities and communities would like to see more price inflation, which in turn would boost confidence and transactions. Historically we have seen London lead the recovery, but the difference this time is whether the
Further commentary by Dr Peter Williams
continued cut back in public expenditure will prevent the much less resilient parts of the UK - highly reliant upon such expenditure - from enjoying the fruits of a sustained recovery.
Housing Transactions
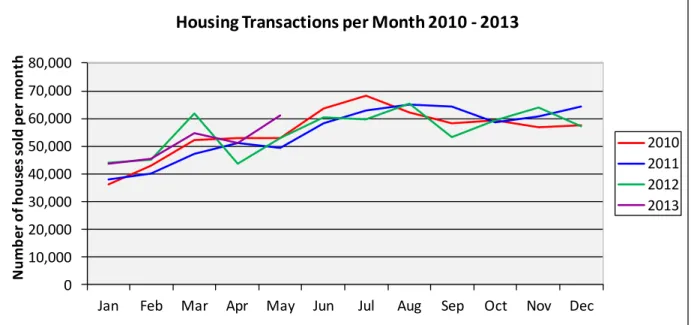
Based on statistics from the last eighteen years, transactions in May are on average 9% higher than in April. There is a bias towards the summer months in the purchase of homes, with May normally heralding an increase in housing transactions. This year we estimate that May transactions have increased by 19% over April, meaning that the May 2013 market is proving to be stronger than average, although the April figures this year were more subdued than normal, perhaps as a result of the cold spring.
Figure 3. Number of properties sold per month in England & Wales, Jan 2010 – May 2013. Source Land Registry link to source Excel
Figure 3 illustrates the number of housing transactions per month for the period January 2010 – May 2013. In general terms, the number of transactions appears to be similar across the four years. Looking at the detail we note that transactions in March 2012 were exceptionally high, but this was due to the change in stamp duty for first time buyers, when the tax holiday for properties costing between £125,000 - £250,000 came to an end. This caused a flurry of activity in March 2012, with a corresponding decrease in purchases the following month. One can also note that 2013 has seen activity levels at the top end of the scale covering the last four years, with May of this year in particular being more buoyant than in the previous three years, by some 10,000 properties. One possible reason for transaction levels rising is an underlying increase in activity by first time buyers. Although the March 2012 figures were distorted by the ending of the tax holiday for first time buyers, the CML reports that “First-time buyer activity in the first quarter of 2013 was at nearly the same level as last year - when figures were buoyed by the end of the stamp duty holiday. This suggests that the market continues to be favourable for many of those looking to buy their first home.First-time buyers also continued to account for an increasing proportion of all house purchase loans - increasing to 45% in March from 43% in February.”
The buy-to-let sector of the market is also making steady progress. Again, quoting the CML, “Gross mortgage lending of £4.2 billion across 33,500 mortgages was advanced to buy-to-let landlords in the first quarter of 2013. This compares with £3.7 billion in the first quarter of last year. Nearly half of this lending was for remortgage, rather than house purchase. Nevertheless, the buy-to-let sector continued to grow, and loan performance improved.
“By the end of March, buy-to-let lending accounted for 13.4% of total outstanding mortgage lending in the UK - up from 13% in the previous quarter and 12.9% at the end of the first quarter of 2012. There are now approximately 1.46 million buy-to-let mortgages in the UK, accounting for around 13% of the total estimated stock of 11.26 million mortgages.”
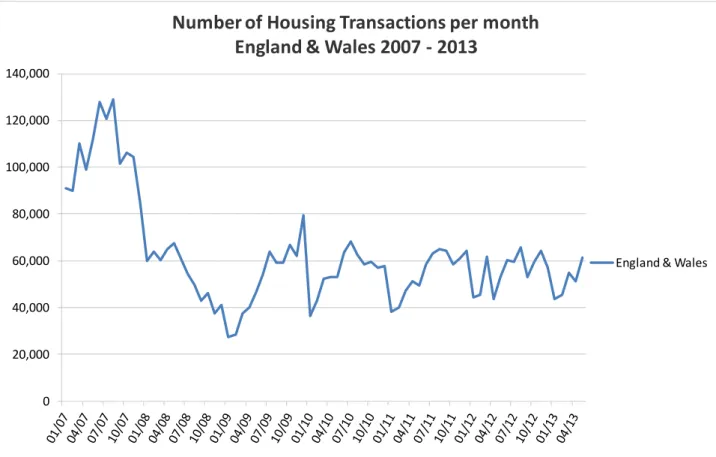
It will be interesting to observe the housing transaction figures next month, and see if the increase in transactions in May 2013 is a one-off occurrence, or the start of a sustained recovery in the market, with sales returning to levels seen prior to the housing crises of 2008/09. Figure 4 below amply demonstrates the extent to which
0 10,000 20,000 30,000 40,000 50,000 60,000 70,000 80,000
Jan Feb Mar Apr May Jun Jul Aug Sep Oct Nov Dec
N u mb er o f h o u se s so ld p er mo n th
Housing Transactions per Month 2010 - 2013
2010 2011 2012 2013
Further commentary by Dr Peter Williams
transactions have fallen since 2007. We should perhaps emphasize that the level of transactions in 2007 was not considered ‘exceptional’ at the time, with the housing market prior to 2008 consistently seeing volumes in excess of 100,000 sales per month.
A key issue will be the supply of mortgage finance. Cash transactions still account for around 40% of the total according to the latest RICS statistics. The government schemes are boosting mortgage supply as well as encouraging the building of more new homes: subject to what happens to cash transactions, mortgage availability will be key to the future state of the market. Some have suggested that the combination of new regulations and controls plus greater lender caution is ‘hard wiring’ lower levels of activity into the housing market. Only time will tell what effect this may or may not have.
Figure 4. The number of housing transactions by month in England & Wales, 2006-2013 (not seasonally adjusted) link to source Excel
NOTES
1. LSL Acad E&W HPI is the only house price index to use:
the actual prices at which every property in England & Wales was transacted, including prices for properties bought with cash, using the factual Land Registry data as opposed to valuation estimates or asking prices
the price of every single relevant transaction, as opposed to prices based upon samples LSL Acad E&W HPI is a price series as opposed to a value series.
2. the current month LSL Acad E&W HPI comprises a forecast of the LR outcome, using an academic “index of indices” model, pending release of sufficient real data from the Land Registry.
3. LSL Acad E&W HPI forecasts are progressively replaced with real data, until every transaction reported to the Land Registry has been recorded and we have provided our LSL Acad E&W HPI “ultimate” data. All LSL Acad E&W HPI numbers, published prior to receipt of all transaction data, are subject to change; in publishing precise numbers for a number of reasons, we do not claim precision.
4. the accuracy of our forecasts is shown monthly on the Acadametrics website www.acadametrics.co.uk in our “Development of Forecasts” and in our “Comparison of Indices”, which shows how each index, including the LSL Acad E&W HPI “forecast” , compares with the LSL Acad E&W HPI, once sufficient factual Land Registry data have replaced forecast data, to enable LSL Acad E&W HPI to approach the “ultimate” results.
5. the Acadametrics website enables comparisons of selected indices over selected timescales to be undertaken here with ease and provides historic results and other information.
6. Acadametrics is an independent privately owned consultancy working with Dr Stephen Satchell, Economics Fellow Trinity College Cambridge, and specialises in the assessment of risk in property and mortgage portfolios.
7. Acadametrics Prices and Transactions (sample here), which exclude any forecast element, underlie the LSL Acad E&W HPI data and are available upon subscription for organisations needing the factual month by month Land Registry prices, at county/London borough level by property type, for e.g. property portfolio valuation, planning and advisory purposes.
0 20,000 40,000 60,000 80,000 100,000 120,000 140,000
Number of Housing Transactions per month
England & Wales 2007 - 2013
Comparison of indices
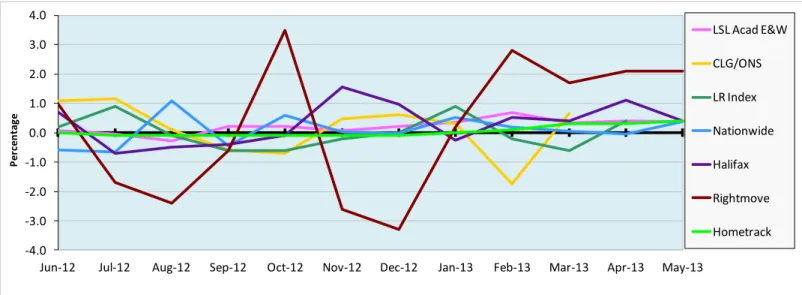
Figure 5. ANNUAL CHANGE IN HOUSE PRICES - COMPARISON OF INDICES CHART link to source Excel
Figure 6. MONTHLY CHANGE IN HOUSE PRICES - COMPARISON OF INDICES CHART link to source Excel -3.0 -2.0 -1.0 0.0 1.0 2.0 3.0 4.0 5.0
Jun 12 Jul 12 Aug 12 Sep 12 Oct 12 Nov 12 Dec 12 Jan 13 Feb 13 Mar 13 Apr 13 May 13
P er cen ta ge LSL Acad E&W CLG/ONS LR Index Nationwide Halifax Rightmove Hometrack -4.0 -3.0 -2.0 -1.0 0.0 1.0 2.0 3.0 4.0
Jun-12 Jul-12 Aug-12 Sep-12 Oct-12 Nov-12 Dec-12 Jan-13 Feb-13 Mar-13 Apr-13 May-13
P er cen ta g e LSL Acad E&W CLG/ONS LR Index Nationwide Halifax Rightmove Hometrack
Regional analysis of house prices
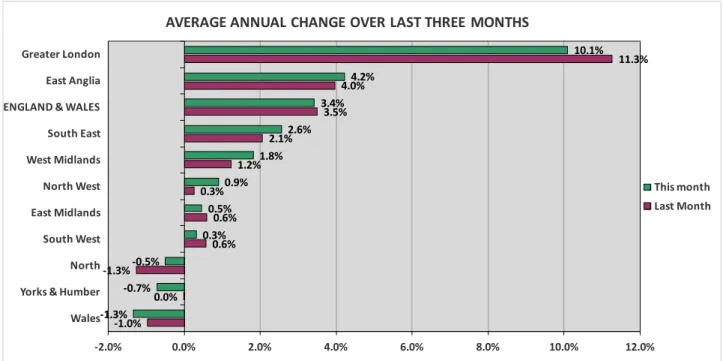
Greater London continues to dominate the housing market in terms of annual price change, with house price inflation over twice that of any other region of England & Wales. For the fourth month running, East Anglia takes second place and joins Greater London in being one of only two regions in the country with annual price increases higher than the average for England & Wales as a whole. The region with the largest fall in annual house prices is Wales, down 1.3% over the year, marginally below Yorkshire & Humberside where prices have fallen by 0.7%. This month there are five regions showing an increase in the annual price change compared to last month, and five regions showing a decrease. This is perhaps indicative of the current housing market in England & Wales, where aside from Greater London and East Anglia, there is no clear indication of the direction of any price change.
Figure 7. The annual change in the average house price, analysed by region link to source Excel
ANNUAL CHANGE IN PRICE BY REGION
Figure 8. A comparison of the annual change in house prices, by region for the period January 2001 – April 2013 link to source Excel
Note that individual regions can be compared using our “National and Regional series from 1995 with Interactive Charts”, linked from page 6 NOTE 5 above and from our covering email; timescales can be varied for clarity. Numerous other comparisons are facilitated in this and other interactive charts available through the same links.
-1.0% 0.0% -1.3% 0.6% 0.6% 0.3% 1.2% 2.1% 3.5% 4.0% 11.3% -1.3% -0.7% -0.5% 0.3% 0.5% 0.9% 1.8% 2.6% 3.4% 4.2% 10.1% -2.0% 0.0% 2.0% 4.0% 6.0% 8.0% 10.0% 12.0% Wales Yorks & Humber North South West East Midlands North West West Midlands South East ENGLAND & WALES East Anglia Greater London
AVERAGE ANNUAL CHANGE OVER LAST THREE MONTHS
This month Last Month -20.0 -15.0 -10.0 -5.0 0.0 5.0 10.0 15.0 20.0 25.0 30.0 35.0
Regions Annual %
England & WalesNorth North West East Midlands West Midlands Wales
Yorks & Humber South West East Anglia South East Greater London
London boroughs
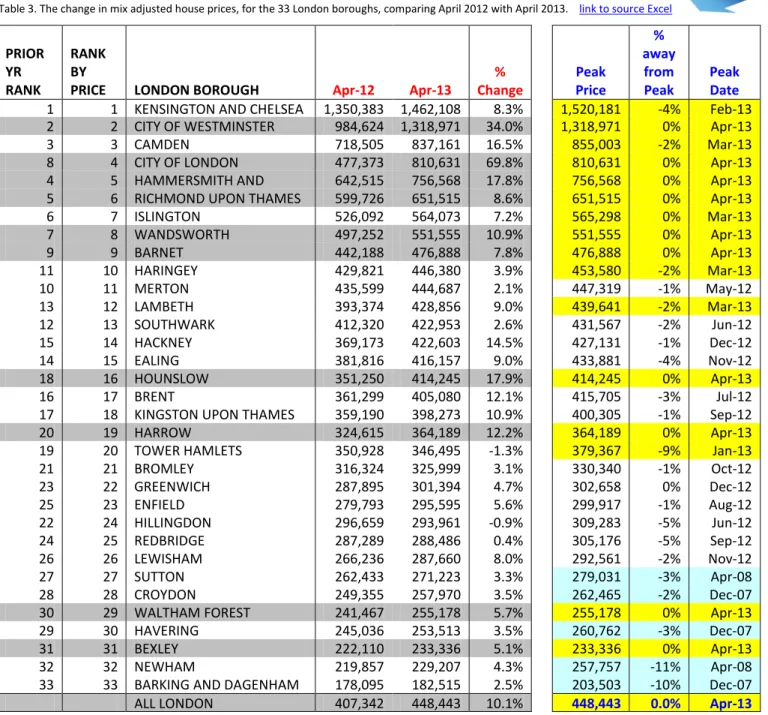
Table 3. The change in mix adjusted house prices, for the 33 London boroughs, comparing April 2012 with April 2013. link to source Excel
PRIOR YR RANK
RANK BY
PRICE LONDON BOROUGH Apr-12 Apr-13
% Change Peak Price % away from Peak Peak Date 1 1 KENSINGTON AND CHELSEA 1,350,383 1,462,108 8.3% 1,520,181 -4% Feb-13 2 2 CITY OF WESTMINSTER 984,624 1,318,971 34.0% 1,318,971 0% Apr-13 3 3 CAMDEN 718,505 837,161 16.5% 855,003 -2% Mar-13 8 4 CITY OF LONDON 477,373 810,631 69.8% 810,631 0% Apr-13
4 5 HAMMERSMITH AND
FULHAM
642,515 756,568 17.8% 756,568 0% Apr-13
5 6 RICHMOND UPON THAMES 599,726 651,515 8.6% 651,515 0% Apr-13
6 7 ISLINGTON 526,092 564,073 7.2% 565,298 0% Mar-13 7 8 WANDSWORTH 497,252 551,555 10.9% 551,555 0% Apr-13 9 9 BARNET 442,188 476,888 7.8% 476,888 0% Apr-13 11 10 HARINGEY 429,821 446,380 3.9% 453,580 -2% Mar-13 10 11 MERTON 435,599 444,687 2.1% 447,319 -1% May-12 13 12 LAMBETH 393,374 428,856 9.0% 439,641 -2% Mar-13 12 13 SOUTHWARK 412,320 422,953 2.6% 431,567 -2% Jun-12 15 14 HACKNEY 369,173 422,603 14.5% 427,131 -1% Dec-12 14 15 EALING 381,816 416,157 9.0% 433,881 -4% Nov-12 18 16 HOUNSLOW 351,250 414,245 17.9% 414,245 0% Apr-13 16 17 BRENT 361,299 405,080 12.1% 415,705 -3% Jul-12 17 18 KINGSTON UPON THAMES 359,190 398,273 10.9% 400,305 -1% Sep-12 20 19 HARROW 324,615 364,189 12.2% 364,189 0% Apr-13 19 20 TOWER HAMLETS 350,928 346,495 -1.3% 379,367 -9% Jan-13 21 21 BROMLEY 316,324 325,999 3.1% 330,340 -1% Oct-12 23 22 GREENWICH 287,895 301,394 4.7% 302,658 0% Dec-12 25 23 ENFIELD 279,793 295,595 5.6% 299,917 -1% Aug-12 22 24 HILLINGDON 296,659 293,961 -0.9% 309,283 -5% Jun-12 24 25 REDBRIDGE 287,289 288,486 0.4% 305,176 -5% Sep-12 26 26 LEWISHAM 266,236 287,660 8.0% 292,561 -2% Nov-12 27 27 SUTTON 262,433 271,223 3.3% 279,031 -3% Apr-08 28 28 CROYDON 249,355 257,970 3.5% 262,465 -2% Dec-07
30 29 WALTHAM FOREST 241,467 255,178 5.7% 255,178 0% Apr-13
29 30 HAVERING 245,036 253,513 3.5% 260,762 -3% Dec-07 31 31 BEXLEY 222,110 233,336 5.1% 233,336 0% Apr-13 32 32 NEWHAM 219,857 229,207 4.3% 257,757 -11% Apr-08 33 33 BARKING AND DAGENHAM 178,095 182,515 2.5% 203,503 -10% Dec-07
ALL LONDON 407,342 448,443 10.1% 448,443 0.0% Apr-13
Table 3 above shows the average house price by London borough for April 2012 and April 2013, along with the percentage change over the year. We also show the peak average price relating to each borough and the month in which this peak price ocurred. The boroughs highlighted in grey in the left-hand part of the table have recorded peak prices in April 2013. The boroughs highlighted in yellow in the right-hand part of the table have all seen peak prices occurring in 2013. The boroughs highlighted in light blue in the right-hand part of the table saw peak prices occur in the period December 2007 to April 2008. On an annual basis, house prices have increased in 31 of the 33 London Boroughs, with only Tower Hamlets and Hillingdon showing a negative movement in average price over the period. This month, some 10 London Boroughs are experiencing peak prices, highlighted in grey above, as is Greater London as a whole. This gives a clear indication of the current bouyancy, as well as the growing momentum in this market.
Of the top third of the London boroughs ranked by price, 10 out of the 11 have seen peak prices occur in 2013. The five boroughs which last saw their peak prices occur in 2007/08 are ranked in the lowest seven boroughs by average price. This is yet another indication of the two speed nature of the London market, with the highest priced boroughs, especially those in the central London areas, seeing price growth in excess of the outer suburbs of the Greater London area.
Counties and unitary authorities
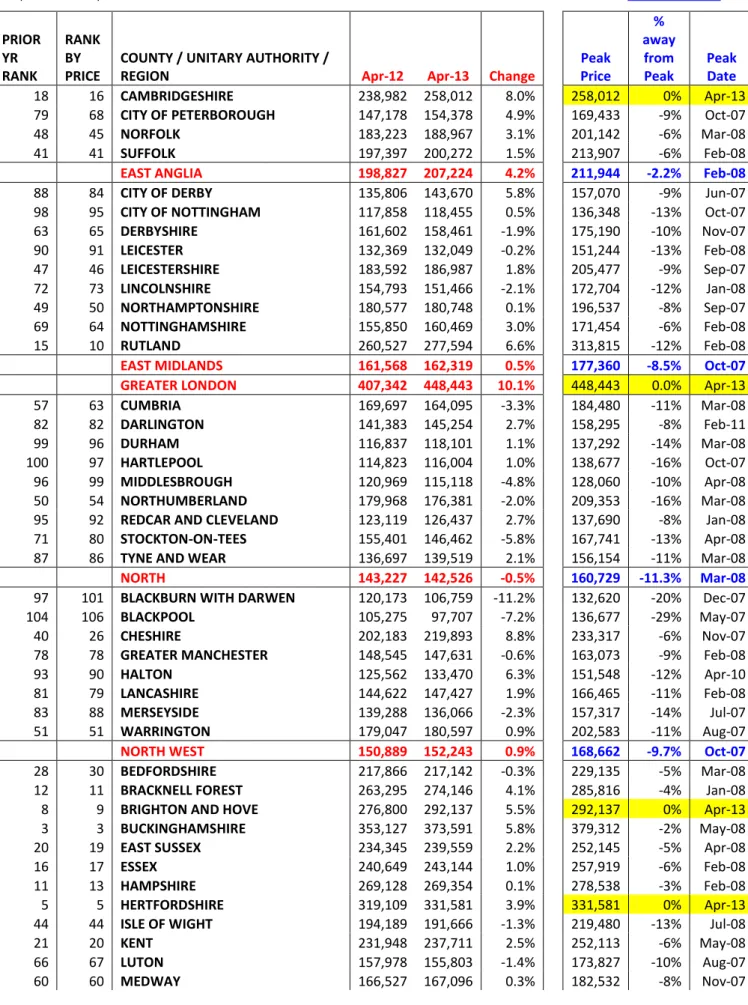
Table 4. The annual percentage change in mix adjusted house prices, for the 108 Counties and Unitary Authorities in England & Wales, comparing
April 2012 with April 2013 link to source Excel
PRIOR YR RANK RANK BY PRICE
COUNTY / UNITARY AUTHORITY /
REGION Apr-12 Apr-13 Change
Peak Price % away from Peak Peak Date 18 16 CAMBRIDGESHIRE 238,982 258,012 8.0% 258,012 0% Apr-13
79 68 CITY OF PETERBOROUGH 147,178 154,378 4.9% 169,433 -9% Oct-07 48 45 NORFOLK 183,223 188,967 3.1% 201,142 -6% Mar-08 41 41 SUFFOLK 197,397 200,272 1.5% 213,907 -6% Feb-08 EAST ANGLIA 198,827 207,224 4.2% 211,944 -2.2% Feb-08 88 84 CITY OF DERBY 135,806 143,670 5.8% 157,070 -9% Jun-07 98 95 CITY OF NOTTINGHAM 117,858 118,455 0.5% 136,348 -13% Oct-07 63 65 DERBYSHIRE 161,602 158,461 -1.9% 175,190 -10% Nov-07 90 91 LEICESTER 132,369 132,049 -0.2% 151,244 -13% Feb-08 47 46 LEICESTERSHIRE 183,592 186,987 1.8% 205,477 -9% Sep-07 72 73 LINCOLNSHIRE 154,793 151,466 -2.1% 172,704 -12% Jan-08 49 50 NORTHAMPTONSHIRE 180,577 180,748 0.1% 196,537 -8% Sep-07 69 64 NOTTINGHAMSHIRE 155,850 160,469 3.0% 171,454 -6% Feb-08 15 10 RUTLAND 260,527 277,594 6.6% 313,815 -12% Feb-08 EAST MIDLANDS 161,568 162,319 0.5% 177,360 -8.5% Oct-07 GREATER LONDON 407,342 448,443 10.1% 448,443 0.0% Apr-13 57 63 CUMBRIA 169,697 164,095 -3.3% 184,480 -11% Mar-08 82 82 DARLINGTON 141,383 145,254 2.7% 158,295 -8% Feb-11 99 96 DURHAM 116,837 118,101 1.1% 137,292 -14% Mar-08 100 97 HARTLEPOOL 114,823 116,004 1.0% 138,677 -16% Oct-07 96 99 MIDDLESBROUGH 120,969 115,118 -4.8% 128,060 -10% Apr-08 50 54 NORTHUMBERLAND 179,968 176,381 -2.0% 209,353 -16% Mar-08 95 92 REDCAR AND CLEVELAND 123,119 126,437 2.7% 137,690 -8% Jan-08 71 80 STOCKTON-ON-TEES 155,401 146,462 -5.8% 167,741 -13% Apr-08 87 86 TYNE AND WEAR 136,697 139,519 2.1% 156,154 -11% Mar-08 NORTH 143,227 142,526 -0.5% 160,729 -11.3% Mar-08 97 101 BLACKBURN WITH DARWEN 120,173 106,759 -11.2% 132,620 -20% Dec-07 104 106 BLACKPOOL 105,275 97,707 -7.2% 136,677 -29% May-07 40 26 CHESHIRE 202,183 219,893 8.8% 233,317 -6% Nov-07 78 78 GREATER MANCHESTER 148,545 147,631 -0.6% 163,073 -9% Feb-08 93 90 HALTON 125,562 133,470 6.3% 151,548 -12% Apr-10 81 79 LANCASHIRE 144,622 147,427 1.9% 166,465 -11% Feb-08 83 88 MERSEYSIDE 139,288 136,066 -2.3% 157,317 -14% Jul-07 51 51 WARRINGTON 179,047 180,597 0.9% 202,583 -11% Aug-07 NORTH WEST 150,889 152,243 0.9% 168,662 -9.7% Oct-07 28 30 BEDFORDSHIRE 217,866 217,142 -0.3% 229,135 -5% Mar-08 12 11 BRACKNELL FOREST 263,295 274,146 4.1% 285,816 -4% Jan-08
8 9 BRIGHTON AND HOVE 276,800 292,137 5.5% 292,137 0% Apr-13
3 3 BUCKINGHAMSHIRE 353,127 373,591 5.8% 379,312 -2% May-08
20 19 EAST SUSSEX 234,345 239,559 2.2% 252,145 -5% Apr-08 16 17 ESSEX 240,649 243,144 1.0% 257,919 -6% Feb-08 11 13 HAMPSHIRE 269,128 269,354 0.1% 278,538 -3% Feb-08
5 5 HERTFORDSHIRE 319,109 331,581 3.9% 331,581 0% Apr-13
44 44 ISLE OF WIGHT 194,189 191,666 -1.3% 219,480 -13% Jul-08 21 20 KENT 231,948 237,711 2.5% 252,113 -6% May-08 66 67 LUTON 157,978 155,803 -1.4% 173,827 -10% Aug-07 60 60 MEDWAY 166,527 167,096 0.3% 182,532 -8% Nov-07
Counties and unitary authorities
29 35 MILTON KEYNES 214,772 210,904 -1.8% 219,578 -4% May-07
4 7 OXFORDSHIRE 325,742 318,997 -2.1% 329,779 -3% Dec-12 62 59 PORTSMOUTH 164,984 167,216 1.4% 182,703 -8% Jun-07 25 21 READING 227,064 235,261 3.6% 241,912 -3% Aug-12 30 32 SLOUGH 213,977 215,103 0.5% 216,405 -1% Oct-07 56 61 SOUTHAMPTON 170,695 166,996 -2.2% 186,132 -10% Oct-07 42 39 SOUTHEND-ON-SEA 197,120 207,675 5.4% 209,216 -1% Jan-12 2 2 SURREY 399,765 424,677 6.2% 424,677 0% Apr-13 53 49 THURROCK 174,511 183,508 5.2% 193,408 -5% Sep-07
7 6 WEST BERKSHIRE 305,096 321,697 5.4% 328,776 -2% Dec-12
13 12 WEST SUSSEX 261,641 270,798 3.5% 280,950 -4% Mar-08
1 1 WINDSOR AND MAIDENHEAD 475,125 467,068 -1.7% 483,385 -3% May-12
6 4 WOKINGHAM 312,988 338,337 8.1% 339,513 0% Mar-13
SOUTH EAST 269,226 276,123 2.6% 277,632 -0.5% Feb-08
10 8 BATH AND NORTH EAST SOMERSET 275,269 297,590 8.1% 320,472 -7% Feb-11
37 43 BOURNEMOUTH 206,258 196,884 -4.5% 242,579 -19% May-08 31 25 CITY OF BRISTOL 210,732 220,748 4.8% 222,852 -1% Mar-13 65 70 CITY OF PLYMOUTH 159,609 153,357 -3.9% 172,105 -11% May-07 22 24 CORNWALL 231,834 222,076 -4.2% 244,530 -9% Sep-07 19 22 DEVON 235,182 234,010 -0.5% 255,245 -8% Dec-07 14 14 DORSET 261,422 266,651 2.0% 281,928 -5% Dec-07 23 23 GLOUCESTERSHIRE 228,569 231,907 1.5% 243,602 -5% Dec-10 36 28 NORTH SOMERSET 206,437 217,357 5.3% 235,635 -8% Dec-07 9 15 POOLE 275,320 263,952 -4.1% 318,192 -17% May-08 34 34 SOMERSET 208,974 211,284 1.1% 228,060 -7% Dec-07 38 36 SOUTH GLOUCESTERSHIRE 205,778 210,156 2.1% 228,138 -8% Feb-08 55 55 SWINDON 171,099 168,736 -1.4% 187,037 -10% Dec-07 52 52 TORBAY 178,579 177,756 -0.5% 211,200 -16% Jan-08 17 18 WILTSHIRE 240,165 241,078 0.4% 256,565 -6% Nov-07 SOUTH WEST 222,916 223,630 0.3% 238,903 -6.4% Oct-07
108 108 BLAENAU GWENT 82,444 85,598 3.8% 109,947 -22% Dec-07
86 87 BRIDGEND 138,655 137,457 -0.9% 156,113 -12% Nov-07 94 100 CAERPHILLY 123,615 114,682 -7.2% 142,548 -20% Jun-07 46 47 CARDIFF 184,848 186,243 0.8% 194,710 -4% Feb-13 91 83 CARMARTHENSHIRE 130,728 143,817 10.0% 164,094 -12% Mar-08 45 53 CEREDIGION 186,259 177,289 -4.8% 221,118 -20% Jan-08 68 74 CONWY 156,480 150,348 -3.9% 182,867 -18% Dec-06 85 85 DENBIGHSHIRE 138,680 139,694 0.7% 167,239 -16% Mar-08 76 72 FLINTSHIRE 150,020 152,084 1.4% 174,078 -13% May-07 70 71 GWYNEDD 155,664 153,315 -1.5% 181,719 -16% Aug-07 64 62 ISLE OF ANGLESEY 160,447 164,984 2.8% 189,719 -13% Jul-08 105 104 MERTHYR TYDFIL 97,287 104,644 7.6% 116,283 -10% Dec-07 24 31 MONMOUTHSHIRE 228,478 216,151 -5.4% 244,128 -11% Aug-07 102 102 NEATH PORT TALBOT 110,547 105,947 -4.2% 131,030 -19% Jan-08 80 75 NEWPORT 146,412 149,756 2.3% 179,138 -16% Jan-08 58 57 PEMBROKESHIRE 168,081 167,625 -0.3% 199,778 -16% Nov-07 54 48 POWYS 171,414 183,545 7.1% 201,059 -9% Nov-07 103 103 RHONDDA CYNON TAFF 108,742 105,331 -3.1% 121,553 -13% Mar-08 67 81 SWANSEA 156,985 146,182 -6.9% 174,465 -16% Oct-07 26 38 THE VALE OF GLAMORGAN 226,295 207,962 -8.1% 226,295 -8% Apr-12 89 94 TORFAEN 132,630 123,110 -7.2% 150,736 -18% Feb-07 73 66 WREXHAM 152,981 157,155 2.7% 179,975 -13% Aug-07 WALES 153,869 151,821 -1.3% 170,286 -10.8% Oct-07
Counties and unitary authorities
33 33 HEREFORDSHIRE 210,061 211,552 0.7% 237,658 -11% Jan-08 43 42 SHROPSHIRE 196,595 199,869 1.7% 224,606 -11% Oct-07 61 56 STAFFORDSHIRE 166,365 168,382 1.2% 191,703 -12% Apr-08 106 107 STOKE-ON-TRENT 94,658 96,923 2.4% 113,039 -14% Feb-08 27 27 WARWICKSHIRE 219,178 218,676 -0.2% 232,566 -6% Feb-10 77 69 WEST MIDLANDS 149,336 154,043 3.2% 166,885 -8% Nov-07 39 37 WORCESTERSHIRE 204,162 208,551 2.1% 227,020 -8% Oct-07 74 76 WREKIN 151,198 148,528 -1.8% 172,047 -14% Mar-08 WEST MIDLANDS 168,951 172,018 1.8% 186,228 -7.6% Oct-07107 105 CITY OF KINGSTON UPON HULL 94,583 99,670 5.4% 107,882 -8% Apr-08
59 58 EAST RIDING OF YORKSHIRE 167,891 167,567 -0.2% 191,562 -13% Mar-08 101 98 NORTH EAST LINCOLNSHIRE 113,474 115,525 1.8% 129,965 -11% Feb-08 92 93 NORTH LINCOLNSHIRE 129,896 126,101 -2.9% 147,879 -15% Jun-08 32 29 NORTH YORKSHIRE 210,635 217,170 3.1% 240,480 -10% Jan-08 84 89 SOUTH YORKSHIRE 139,242 135,780 -2.5% 155,047 -12% Oct-07 75 77 WEST YORKSHIRE 151,147 148,252 -1.9% 168,910 -12% Dec-07 35 40 YORK 207,615 205,927 -0.8% 221,821 -7% Sep-07 YORKS & HUMBER 154,580 153,470 -0.7% 170,651 -10.1% Dec-07 ALL ENGLAND & WALES 224,463 232,160 3.4% 232,160 0.0% Apr-13 Table 4 shows the average house prices for each of the 108 unitary authorities and counties in England & Wales, together with a regional summary for April 2012 and April 2013. It also records the percentage change in these prices over the year. This month we have added three columns to the right of our standard table, showing the peak average price for each of the 108 Unitary Authority areas, the percentage by which the current price is away from this peak price and the month in which the peak price was achieved.
Highlighted in yellow are those Unitary Authorities which have experienced a peak price in 2013, of which there are 7, or 6%, out of the total of 108 areas. This compares with the 16 London boroughs, or 48% out of the total 33 London boroughs, which have similarly experienced a peak price in 2013. The overwhelming majority of the Unitary Authorities, 89 in number, saw their peak price occur in the housing boom of 2007/08, with 3 seeing peaks in 2010, 2 in 2011, 6 in 2012 and 7 in 2013. Conwy is the exception in the above table, having seen its peak price in December 2006, some fourteen months prior to the peak experienced by England & Wales as a whole.
The unitary authority with its current average house price furthest from its peak is Blackpool, where prices have fallen by 29%, followed by Blaenau Gwent off 22% and Blackburn with Darwen off 20%.
This month’s index shows that, in general terms at least, the market recovery has now progressed far enough to trigger a new average price peak. Clearly, this is heavily influenced by the strong recovery underway in London, and a new peak has only been set for a select group of London boroughs and authorities outside of the capital (Cambridgeshire, Hertfordshire, Surrey, Brighton and Hove and Wokingham, and earlier in the year in Bristol and Cardiff). As the tables above have shown, average prices in most local authorities in England and Wales are still some distance off their previous highs, but the patterns to date suggest a flow towards record prices moving outwards from London. As we discuss earlier, the question is now how far will this recovery go and over what time period? The new measures being introduced by government will add to the momentum, at least up to the point where they are due to end (and interest rate rises bring new pressures). The hope is that the market will by then have developed its own dynamic. However, the picture we are painting is extremely complex and there will no doubt be numerous bumps in the road ahead.
Regional data table
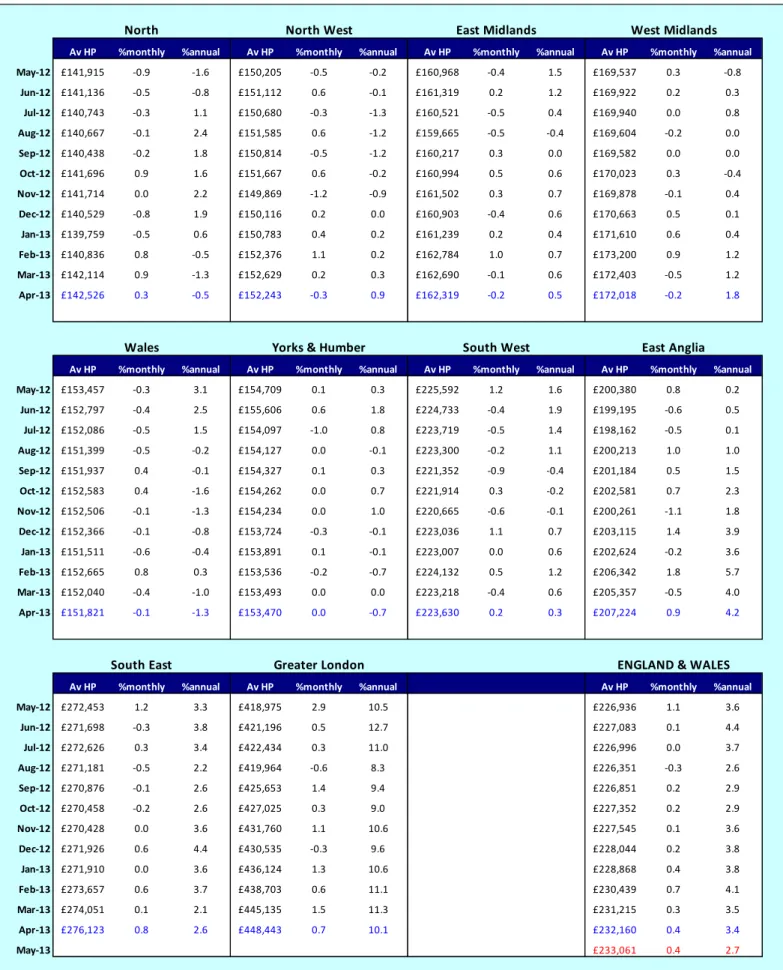
Table 5. Average house prices by region, May 2012 – May 2013, with monthly and annual % growth link to source Excel
Av HP %monthly %annual Av HP %monthly %annual Av HP %monthly %annual Av HP %monthly %annual
May-12 £141,915 -0.9 -1.6 £150,205 -0.5 -0.2 £160,968 -0.4 1.5 £169,537 0.3 -0.8 Jun-12 £141,136 -0.5 -0.8 £151,112 0.6 -0.1 £161,319 0.2 1.2 £169,922 0.2 0.3 Jul-12 £140,743 -0.3 1.1 £150,680 -0.3 -1.3 £160,521 -0.5 0.4 £169,940 0.0 0.8 Aug-12 £140,667 -0.1 2.4 £151,585 0.6 -1.2 £159,665 -0.5 -0.4 £169,604 -0.2 0.0 Sep-12 £140,438 -0.2 1.8 £150,814 -0.5 -1.2 £160,217 0.3 0.0 £169,582 0.0 0.0 Oct-12 £141,696 0.9 1.6 £151,667 0.6 -0.2 £160,994 0.5 0.6 £170,023 0.3 -0.4 Nov-12 £141,714 0.0 2.2 £149,869 -1.2 -0.9 £161,502 0.3 0.7 £169,878 -0.1 0.4 Dec-12 £140,529 -0.8 1.9 £150,116 0.2 0.0 £160,903 -0.4 0.6 £170,663 0.5 0.1 Jan-13 £139,759 -0.5 0.6 £150,783 0.4 0.2 £161,239 0.2 0.4 £171,610 0.6 0.4 Feb-13 £140,836 0.8 -0.5 £152,376 1.1 0.2 £162,784 1.0 0.7 £173,200 0.9 1.2 Mar-13 £142,114 0.9 -1.3 £152,629 0.2 0.3 £162,690 -0.1 0.6 £172,403 -0.5 1.2 Apr-13 £142,526 0.3 -0.5 £152,243 -0.3 0.9 £162,319 -0.2 0.5 £172,018 -0.2 1.8
Av HP %monthly %annual Av HP %monthly %annual Av HP %monthly %annual Av HP %monthly %annual
May-12 £153,457 -0.3 3.1 £154,709 0.1 0.3 £225,592 1.2 1.6 £200,380 0.8 0.2 Jun-12 £152,797 -0.4 2.5 £155,606 0.6 1.8 £224,733 -0.4 1.9 £199,195 -0.6 0.5 Jul-12 £152,086 -0.5 1.5 £154,097 -1.0 0.8 £223,719 -0.5 1.4 £198,162 -0.5 0.1 Aug-12 £151,399 -0.5 -0.2 £154,127 0.0 -0.1 £223,300 -0.2 1.1 £200,213 1.0 1.0 Sep-12 £151,937 0.4 -0.1 £154,327 0.1 0.3 £221,352 -0.9 -0.4 £201,184 0.5 1.5 Oct-12 £152,583 0.4 -1.6 £154,262 0.0 0.7 £221,914 0.3 -0.2 £202,581 0.7 2.3 Nov-12 £152,506 -0.1 -1.3 £154,234 0.0 1.0 £220,665 -0.6 -0.1 £200,261 -1.1 1.8 Dec-12 £152,366 -0.1 -0.8 £153,724 -0.3 -0.1 £223,036 1.1 0.7 £203,115 1.4 3.9 Jan-13 £151,511 -0.6 -0.4 £153,891 0.1 -0.1 £223,007 0.0 0.6 £202,624 -0.2 3.6 Feb-13 £152,665 0.8 0.3 £153,536 -0.2 -0.7 £224,132 0.5 1.2 £206,342 1.8 5.7 Mar-13 £152,040 -0.4 -1.0 £153,493 0.0 0.0 £223,218 -0.4 0.6 £205,357 -0.5 4.0 Apr-13 £151,821 -0.1 -1.3 £153,470 0.0 -0.7 £223,630 0.2 0.3 £207,224 0.9 4.2
Av HP %monthly %annual Av HP %monthly %annual Av HP %monthly %annual
May-12 £272,453 1.2 3.3 £418,975 2.9 10.5 £226,936 1.1 3.6 Jun-12 £271,698 -0.3 3.8 £421,196 0.5 12.7 £227,083 0.1 4.4 Jul-12 £272,626 0.3 3.4 £422,434 0.3 11.0 £226,996 0.0 3.7 Aug-12 £271,181 -0.5 2.2 £419,964 -0.6 8.3 £226,351 -0.3 2.6 Sep-12 £270,876 -0.1 2.6 £425,653 1.4 9.4 £226,851 0.2 2.9 Oct-12 £270,458 -0.2 2.6 £427,025 0.3 9.0 £227,352 0.2 2.9 Nov-12 £270,428 0.0 3.6 £431,760 1.1 10.6 £227,545 0.1 3.6 Dec-12 £271,926 0.6 4.4 £430,535 -0.3 9.6 £228,044 0.2 3.8 Jan-13 £271,910 0.0 3.6 £436,124 1.3 10.6 £228,868 0.4 3.8 Feb-13 £273,657 0.6 3.7 £438,703 0.6 11.1 £230,439 0.7 4.1 Mar-13 £274,051 0.1 2.1 £445,135 1.5 11.3 £231,215 0.3 3.5 Apr-13 £276,123 0.8 2.6 £448,443 0.7 10.1 £232,160 0.4 3.4 May-13 £233,061 0.4 2.7
North North West East Midlands West Midlands
South East Greater London ENGLAND & WALES
Footnotes on data and methodology
1. LSL Acad E&W HPI is derived from Land Registry (LR) house price data, seasonally and mix adjusted by property type. © Crown copyright material reproduced with the permission of Land Registry. The prices are smoothed to show underlying trends. LSL Acad E&W HPI includes cash purchase prices and is the only index based upon the complete, factual, house price data for England & Wales, as opposed to a sample.
2. most indices employ data available to the provider as result of its business; index methodologies are designed to exploit the advantages and overcome the disadvantages of each particular dataset; a valuation series (whether the values are professionally estimated at e.g. time of mortgage offer or by an estate agent) is not the same as a price series; price series (LSL Acad E&W HPI, CLG/ONS and LR) can be prepared only when the prices at which properties have been transacted have been recorded at LR (LSL Acad E&W HPI and LR) or when firm prices at mortgage completion (CLG/ONS) have been made available by lenders; valuation series can be prepared whenever the data e.g. asking or mortgage offer prices are available to the provider; publicity accrues to those indices which are released first; indices published at or before month end are likely to employ data for the current and prior months. LR overcomes the delay in availability of full LR transaction data by using only the prices of properties for which two prices are recorded at LR and the published American Case Shiller methodology, developed to prepare indices for metropolitan districts, since the USA lacks a central Land Registry. LSL Acad E&W HPI overcomes the above delay with an “index of indices” forecasting model, purpose developed by Dr Stephen Satchell Economics Fellow Trinity College Cambridge and Dr George Christodoulakis, then at the Sir John Cass Business School; of the price series, LSL Acad E&W HPI, LR and CLG/ONS are published in that order.
3. LSL Acad E&W HPI provides prices at national and regional level to 1995 and, at county/London borough level, to 2000; back-cast national prices for graphing are available to 1987.
4. at national level, only some 60,000 monthly transactions now occur compared with at least 100,000 in past markets. For any given month, c.38% (20,000) of these will be reported to LR by month end. When monthly sales were c.100,000, we found that using the initial 15,000 transactions then reported to LR, introduced volatility into our first LSL Acad E&W HPI result. Rather than rely upon a small sample, likely to be unrepresentative, LSL Acad E&W HPI therefore employs the above “index of indices”, and a series of auto regression and averaging models. After the elapse of one month, LR provides c.88% of the transactions for the prior month, used to replace the initial LSL Acad E&W HPI “forecast” with a first LSL Acad E&W HPI “updated” result. Two months after any given month, LR provides c.96 % of the month’s transactions, sufficient to enable us to describe our next update as an LSL Acad E&W HPI “final” index, closely approximating the LSL Acad E&W HPI “ultimate” results; LSL Acad E&W HPI “ultimate” includes the price of virtually every single LR transaction for the month, smoothed, seasonally and mix adjusted; the LSL Acad E&W HPI “updated” now uses c.37,000 real transactions for the month (as well as, by smoothing, c.40,000 transactions for the prior month); only CLG/ONS with, this year, 28,000 mortgage completions (and the Rightmove asking price index) have specified comparable data volumes; lender index data volumes are not quantified; the Halifax HPI employs three month smoothing for annual change results but not for other results; Hometrack provides survey data and specifies that theirs is a survey, not an index; current results are showing a divide between indices with more, and indices with less, data volumes.
5. in each of the 10 regions, an average of only some 6,000 transactions now occur monthly; hence, we wait one month, pending receipt from LR of the c.88% sample and provide monthly results one month in arrears of the most recent month. In our Regional data table, red data represent LSL Acad E&W HPI “forecast” results, blue data represent LSL Acad E&W HPI “updated” results and black data represent the LSL Acad E&W HPI “final” index.
6. at county and London borough levels, c.60,000 national monthly transactions, spread over 10 regions and 108 counties and 33 London boroughs, provide an average of only c.425 house prices monthly within each sub-district. Even delayed one and smoothed over three months, LSL Acad E&W HPI is indicative until we are able to publish the LSL Acad E&W HPI “final” index using the LR 96% sample. LSL Acad E&W HPI data are calculated on a consistent basis from county and London borough through to region and ultimately to national level; at every level, the current month price represents the average of the prices for the current month and for the prior and subsequent months (“three month, centre month smoothed”). LR employs a “four month, end month smoothed”, process for county/London borough data, but not for national and regional results.
7. data limitations are not confined to volumes. LSL Acad E&W HPI and the LR index are unable to distinguish between 3, 4 or 5 bedroom houses or between those with 2, 1 or even no bathroom; the lender hedonic indices and the CLG/ONS mix adjusted index do so. LR data exclude commercial and, thus, auction sales and do not reflect repossession prices on the grounds that such prices do not reflect those between a willing buyer and a willing seller; some feel that auction prices represent true market prices; others believe that the repossession price of a recent new build flat in Manchester is not (at least not yet) reflected in the price of a flat in an upmarket area.
8. LSL Acad E&W HPI is prepared from Land Registry data using a methodology designed to provide a “true measure of house price inflation”; Acadametrics does not guarantee the accuracy of the LSL Acad E&W HPI results and Acadametrics shall not be liable for any loss or damage, whatsoever, consequential upon any error, incorrect description of or inadequacy in the data; persons using the data do so entirely at their own risk; LSL Acad E&W HPI is freely provided for publication with due attribution to Acadametrics. Permission is required for any commercial use of the data.
9. The monthly, smoothed, average Land Registry prices at regional, county and London borough level by property type, which underlie LSL Acad E&W HPI, together with historic data are available from Acadametrics as in page 5 NOTE 7 above.
10. LSL Acad E&W HPI was published under the name FTHPI from September 2003 until December 2009.
Note to editors
LSL PROPERTY SERVICES PLC
LSL is one of the leading residential property services companies in the UK and provides a broad range of services to a wide range of customers including mortgage lenders together with buyers and sellers of residential properties.
LSL’s operations cover four key areas; surveying, estate agency, corporate services and financial services.
Surveying
LSL’s surveying business operates under e.surv Chartered Surveyors, Chancellors Associates and Barnwoods brands. e.surv is one of the largest employers of residential Chartered Surveyors in the UK and is the largest distributor and manager of mortgage valuations and private surveys. Estate Agency
LSL’s estate agency business operates under the Your Move, Reeds Rains, Intercounty and several independent brands. Your Move is the single largest estate agency brand in the UK.
In January 2010 the acquisition of the Halifax Estate Agency (HEA) business from Lloyd Banking Group saw LSL increase in size to become the second largest UK estate agency network - with around 570 branches. It is also the largest letting agency in the UK.
Corporate Services
LSL Corporate Client Services was launched in 2008 to provide asset management and lettings property portfolio management services to corporate clients. This business has grown through the addition of St Trinity Asset Management - which previously operated as HEA Corporate Services - and Templeton LPA, which LSL acquired in February 2010.
Financial Services
LSL offers financial services across its entire branch network. In May 2010 LSL acquired over 450 advisers from leading financial services network Home of Choice - these advisers now operate under the brand of First Complete.
In October 2010 LSL also announced the acquisition of mortgage distribution
company, Advance Mortgage Funding Limited (trading as Pink Home Loans) and its subsidiary business BDS Mortgage Group Limited, (together known as Pink), from Skipton Building Society. It further confirmed LSL’s position as one of the largest mortgage advisory businesses in the UK today.