https://doi.org/10.1007/s00426-019-01214-1 ORIGINAL ARTICLE
Inattention and task switching performance: the role of predictability,
working memory load and goal neglect
Gizem Arabacı1 · Benjamin A. Parris1 Received: 4 May 2018 / Accepted: 7 June 2019 © The Author(s) 2019
Abstract
Inattention is a symptom of many clinical disorders including attention deficit hyperactivity disorder (ADHD) and is thought to be primarily related to limitations in working memory. In two studies, we investigated the implications of inattention for task switching performance. In study one, we measured task switching performance using predictable and unpredictable conditions in adults who self-rated inattention and other ADHD-related tendencies. Tasks required proactive control and reactive control, respectively, under both high and low working memory loads. Results revealed that inattentive, but not hyperactive/impulsive traits, predicted switch costs when switching was predictable and working memory load was high. None of the ADHD traits were related to unpredictable switch costs. Study two was designed to: (1) de-confound the role of proactive control and the need to keep track of task order in the predictable task switching paradigm; (2) investigate whether goal neglect, an impairment related to working memory, could explain the relationship between inattention and predictable task switching. Results revealed that neither predictability nor the need to keep track of the task order led to the association between switch costs and inattention, but instead it was the tendency for those high in inattention to neglect preparatory proactive control, especially when reactive control options were available.
Introduction
Inattention is a symptom of many clinical and mental disor-ders although it is most closely associated with attention def-icit hyperactivity disorder (ADHD). ADHD manifests itself in three presentations: predominantly inattentive (ADHD-I), predominantly hyperactive/impulsive (ADHD-HI) and combined (ADHD-C: American Psychiatric Association,
2013). Our present focus is on the symptom of inattention as characterised as a difficulty in sustaining attention, lis-tening/following conversations/instructions, and organis-ing. Furthermore, it is associated with mind wandering-like experiences (e.g. “mind seems elsewhere” or “distractible by unrelated thoughts”), forgetfulness and hesitation to engage in activities requiring sustained mental effort (APA, 2013).
Whilst ADHD is a widely diagnosed neurodevelopmen-tal disorder with prevalence rates of 5–10% in childhood and 4.4% in adulthood (Kessler et al. 2005), research has suggested that inattention, like the other ADHD symptoms,
is best thought of as being on a continuum as opposed to being categorically different from sub-clinical levels of the disorder (Barkley & Murphy, 1998). Based on this view, tendencies of inattention, hyperactivity and impulsivity are also experienced by sub-clinical populations, and, those with a clinical diagnosis represent the extreme end of the spec-trum. Measuring ADHD-related experiences on a continu-ous scale has been supported by taxometric studies (Haslam et al. 2006; Salum et al. 2014) and studies report a signifi-cant impact of ADHD-related traits at sub-clinical levels (Elisa, Balaguer-Ballester, & Parris, 2016; Overbey, Snell, & Callis, 2011; Seli, Smallwood, Cheyne, & Smilek, 2015).
Diamond (2005) argued, and research has supported, that inattention is primarily related to limitations in work-ing memory (Nigg, 2006; Barkley, 1994; Nigg, 2001). For example, Martinussen et al. (2005) revealed that inattentive (but not hyperactive/impulsive) symptoms were related to verbal and visuospatial working memory (WM) impairments in clinical samples (see also Klingberg et al., 2005). Using non-clinical samples, Gathercole et al. (2008) revealed that low WM capacity children had more inattentive traits than a high WM group. Lui and Tannock (2007) also reported that poor performance on WM tasks predicted parent-rated inattentive traits at sub-clinical levels. In adults, Elisa et al.
* Gizem Arabacı
1 Department of Psychology, Bournemouth University, Talbot Campus, Fern Barrow, Poole, Dorset BH12 5BB, UK
(2016) found that self-reported inattentive traits predicted the performance on verbal WM at sub-clinical levels. Thus, the literature provides evidence for a link between inattentive symptoms and WM performance at clinical and sub-clinical levels.
Although the core executive functions of WM, response inhibition and task switching are thought to be independ-ent processes research also suggests that they may still be interrelated (Friedman & Miyake, 2017). Therefore, WM limitations in inattentive individuals might produce impaired performance on other executive function tasks, such as task switching (e.g. Emerson & Miyake, 2003; Liefooghe, Van-dierendonck, Muyllaert, Verbruggen, & Vanneste, 2005; Miyake, Emerson, Padilla, & Ahn, 2004). Moreover, since the relationship between inattention and task switching per-formance has not yet been investigated it is possible that inattention also leads to impaired task switching perfor-mance irrespective of WM involvement.
Task switching paradigms (TSPs) measure the cognitive flexibility required to achieve task goals when the environ-ment is constantly changing. Switching refers to an indi-vidual’s ability to self-adjust their performance based on the current requirements to achieve task goals. To perform a switch, attentional resources must shift to the relevant task set (Allport, Styles, & Hsieh, 1994; Jersild, 1927; Rogers & Monsell, 1995; Spector & Biederman, 1976). Task-set refers to the parameters required to perform a particular task such as stimulus identification, response selection and response execution (Logan & Gordon, 2001; Vandieren-donck, Liefooghe, & Verbruggen, 2010).
In TSPs, participants are often asked to perform two tasks in quick succession. A participant might be required to repeat the same task (e.g. judging whether a number is higher or lower than 5) a number of times before they are asked to perform another task (e.g. judging whether a pre-sented number is odd or even). These two tasks would be presented such that there are a number of repeat and switch trials in each experiment. Switching from one task to another is associated with longer reaction times (RTs) and higher error rates compared to repeat trials. These performance costs are referred to as switch costs (Meiran, Chorev, & Sapir, 2000; Altmann, 2004; Dreisbach, Haider, & Kluwe,
2002; Koch, 2001; Meiran, 1996; Rogers & Monsell, 1995). Various accounts have been made to explain the source of switch costs including the role of interference from the pre-vious task-set (Allport et al., 1994) and task-set reconfigura-tion (Rogers & Monsell, 1995).
It has been argued that task switching performance calls upon WM processing for the activation and maintenance of task-sets (Emerson & Miyake, 2003; Liefooghe et al.,
2005; Miyake et al., 2004) and for tracking sequential action plans (Bryck & Mayr, 2008). However, research has failed to find an effect of WM on task switching (Kane, Conway,
Hambrick, & Engle, 2007; Logan, 2004 but see Liefooghe, Barrouillet, Vandierendonck, & Camos, 2008). Nevertheless, the reliance of task switching on WM might depend on the parameters of the task switching requirements. For exam-ple, WM would be required to prepare for the upcoming task when the information about the upcoming task is avail-able in advance as in predictavail-able TSPs. The reconfiguration account of task switching suggests that switching requires a mental form of ‘gear changing’ (task-set reconfiguration) to trigger the task-specific processes, such as retrieving the relevant task-set. If advanced knowledge and sufficient time is allowed, individuals are able to prepare for the upcoming task, thereby reducing the switch cost (reconfiguration view; Rogers & Monsell, 1995). This has been referred to as pro-active control (Braver, Gray, & Burgess, 2007).
The distinction between proactive and reactive control was first introduced by Braver et al. (2007) who proposed the dual-mechanism theory of cognitive control, suggesting two types of control for the flexible, goal-related behaviour. Proactive control refers to the active maintenance of infor-mation (e.g. general task instructions, relevant inforinfor-mation from the previous stimuli or salient cues) that is beneficial for responding to upcoming stimuli (Engle & Kane, 2003; Kane et al., 2007), and, the ability to make use of the pre-vious stimuli to predict the upcoming event (Braver et al.,
2007). Reactive control involves retrieving contextual infor-mation that is relevant for current decision making. Pro-active control requires maintaining previous knowledge and using this to respond efficiently when a future event is consistent with expectations. In an attempt to integrate the role of preparation and interference during switching, Van-dierendonck et al. (2010) evaluated the switch costs in two processing stages: preparation and stimulus-based process-ing. They suggested that two forms of control are needed: reactive control to overcome the interference due to task-set inertia and proactive control to shield the task relevant goal and instructions. Research has found that high WM capac-ity participants are better at making use of prior informa-tion or cue informainforma-tion to predict the upcoming event in various tasks. High WM capacity participants are also more able to maintain the goal relevant information in memory (Engle & Kane, 2003; Unsworth, Schrock, & Engle, 2004; Redick, Calvo, Gay, & Engle, 2011) and use this information proactively to bias their responses (Redick et al., 2011). In individuals reporting high levels of inattention one would, therefore, be expected to exhibit poorer use of cue informa-tion and poorer maintenance of goal relevant informainforma-tion. In sum, during predictable task switching, a form of proac-tive control is needed to perform advanced reconfiguration to prepare for the upcoming stimuli and shield the relevant goal, and this is related to WM capacity. When the use of proactive control is not possible (i.e. future events cannot be reliably predicted), individuals rely on reactive control
(Redick, 2014). Furthermore, reactive control would be used to overcome task set inertia.
Task switching and ADHD
Whilst there has been no research, to our knowledge, con-sidering task switching performance and inattention, stud-ies using TSPs on participants with ADHD have revealed conflicting results. Using the same task, Cepeda et al. (2000) and Kramer et al. (2001) reported larger switch costs in those with ADHD compared to controls while Oades and Chris-tiansen (2008) failed to find a significant difference in switch costs. Other studies reported significantly larger switch costs for ADHD participants (King, Colla, Brass, Heuser, & von Cramon, 2007) while others did not (Rauch, Gold, & Schmitt, 2012). For example, Wu et al. (2006) investi-gated the switching performance for those with and without ADHD under WM load. Participants were asked to switch between colour naming and word reading in a predictable manner in two conditions: cue-absent and cue-present. In the cue-present condition, the stimuli were presented with a circle divided into four equal segments, and, the stimuli were presented in one of the possible segments in clockwise order. The task was cued in a way that participants could work out the required task based on the position of the stimulus. In cue-absent conditions, the circle disappeared, forcing participants to keep track of the task order (to increase the WM load). Wu et al. (2006) failed to find a group difference between cue-absent and cue-present conditions for ADHD participants, suggesting no relationship between task switch-ing and ADHD and that the WM load did not affect those with ADHD any more than control participants.
There may be several reasons for the inconsistent find-ings. First and most important, the inconsistent results could be the unexplored differences in cognitive performance between ADHD-I and ADHD-C/ADHD-HI and the extent to which the TSP relied on WM. If the TSP has a high WM load component you would expect those with ADHD-I or self-reported inattention to exhibit greater problems with task switching.
Another possible explanation for larger switch costs for ADHD participants when they have been observed, and one that we also explore here in self-reporting adults, and is potentially unrelated to WM capacity, is that the costs were observed under interference load (incongruent stimuli). For example, Cepeda et al. (2000) reported much larger switch costs to incongruent than congruent stimuli for ADHD par-ticipants, suggesting that the overall increase in switch costs could be due to the slowed responses on incongruent trials only. The interference view of task switching (Allport et al.,
1994; Allport & Wylie, 1999; Wylie & Allport, 2000) sug-gests that the switch costs (larger RTs to switch than repeat
trials) are observed because the persistent activation of the previously activated task-set interferes with the current acti-vation of the new task-set, creating proactive interference. When sufficient time is allowed (long response-stimulus intervals), the activation of the previous task-set decays (task-set inertia), allowing participants to switch more effi-ciently due to the minimum amount of interference (Allport et al., 1994).
The interference account also suggests that part of the switch cost derives from interference triggered by the stimu-lus itself (task rule congruency). TSPs may involve unique stimuli for each task (univalent stimuli) or both (or more) tasks could be associated with the same stimulus set ( biva-lent stimuli). Smaller switch costs in univalent (unique stim-uli for each task) compared to bivalent (two or more tasks associated with the same stimulus set) stimuli have been reported, suggesting that switching is more efficient when the stimulus indicates only one type of task-set (Allport et al., 1994; Rogers & Monsell, 1995; Spector and Bieder-man, 1976). In sum, it is possible that task-set inertia and/or task rule congruency would play a role in the link between switch costs and ADHD symptoms.
In summary, the literature on ADHD and task switch-ing is inconsistent. We argue that the inconsistent findswitch-ings could be due to a failure to consider each presentation of ADHD (inattention and hyperactive/impulsive) and/or the type of TSP employed. Given the relationship between WM and inattention, it is likely that inattention will affect task switching performance when there is a WM load. Consid-ering the need for WM to perform preparatory proactive control during task switching, it is reasonable to think that inattentive traits may be related to infrequent engagement of proactive control to prepare for upcoming stimuli due to associated WM limitations (e.g. Elisa et al., 2016; Martinus-sen et al., 2005). However, where larger switch costs have been reported in those with ADHD, it has been argued that it is a failure to inhibit interference, and not a WM issue, that causes the impaired performance.
Study 1
In the present study we measured the trait of inattention in undiagnosed adults (along with hyperactivity and impul-sivity traits) and its relationship to predictability, interfer-ence and WM load during task switching performance. Each participant performed two TSPs: (1) a predictable TSP where participants have to maintain the task order and use this information to prepare in advance for an upcoming repeat or switch trial. In the cue-present condition (low WM load condition), a cue was provided to indicate task order. In the cue-absent condition no additional informa-tion was provided and participants had to maintain task
order in WM (high WM load condition). The cue-present condition allowed the use of reactive and proactive con-trol, while the cue-absent condition forced participants to rely on proactive control only; (2) an unpredictable TSP where stimuli appeared in an unpredictable manner (forc-ing the use of reactive control) in long and short RSIs. Long intervals are used to measure the effect of inhibition (task-set inertia) in switch cost.
Given the limitations with WM capacity in inattention at subclinical (Elisa et al., 2016) and clinical levels (Diamond,
2005), one would predict an impairment in maintaining task order and proactively preparing for the next task, resulting in larger switch costs in predictable TSPs, especially when there is no environmental support (the cue-absent condition). In contrast, if inattention was related to a task switching impairment more generally, inattentive traits should predict performance on all TSPs. If instead, an observed switch cost disadvantage was due to a problem with inhibition, there should be an association between one of the core ADHD symptoms in the unpredictable switch cost when the RSI is short. This is because a long RSI confers extra time between the trials to reduce the interference from the previous task-set (Allport et al., 1994).
Method
Participants
Participants aged between 18 and 35 with normal or cor-rected vision from non-clinical samples were recruited through Bournemouth University’s research participa-tion system and through advertisements. Participants were mainly undergraduate and postgraduate students. Undergrad-uate students received course credits for their involvement. We collected data from 116 individuals (mean age 20.37, SD 2.87). Initially, sample size was defined by previous research measuring ADHD tendencies on a continuum showing rea-sonable effect sizes (Elisa et al., 2016).
Materials
Connors’ adult ADHD rating scale: short version (CAARS‑S:S)
ADHD tendencies were assessed using CAARS-S:S (Con-ners, Erhardt, & Sparrow, 1999). The questionnaire requires participants to rate the frequency of the 26 items (symptoms) using a four-point rating scale. Raw scores for inattention, hyperactivity and impulsivity symptoms are transformed into t scores to make a comparison across participants. T
scores range between 28 (lowest) to 90 (highest) calculated based on the age and gender.
Predictable task switching paradigm
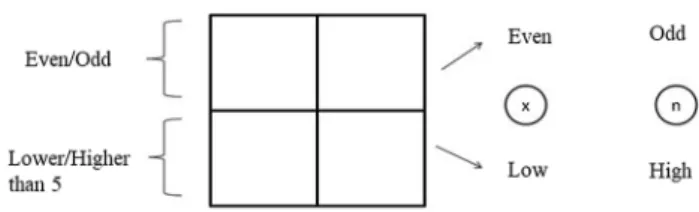
The task involved the alternative run paradigm (Rogers and Monsell, 1995) and was adapted from Wu et al. (2006). Par-ticipants were presented with digits (1, 2, 3, 4, 6, 7, 8 and 9) and asked to decide whether the digit was even/odd (task A) or lower/higher than 5 (task B). The task required par-ticipants to press x if the digit was even or lower than five; and press n if the digit was odd or higher than 5. Response mapping was counterbalanced across participants. Digits requiring the same response for both tasks are referred to as being congruent (2, 4, 7, 9). For example, 2 requires the same response (e.g. x) for both tasks since it is even and lower than 5. Stimuli requiring different key responses for each task were referred to as incongruent (6, 8, 1, 3). For example, 6 requires x response for even/odd task while the correct response would be n for lower/higher task. Stimuli were presented in Courier New (bold) 36 points until an appropriate key response or maximum duration of 5000 ms and followed by 150 ms inter stimulus interval.
The task consisted of three blocks: single task block, low load block and high load block. Single task blocks were always presented first to allow participants to establish stimulus–response mappings. In single task blocks, only task A or B was presented consistently within the block. The order of the tasks was randomised across participants. In the low load block, stimuli were presented in a 10 cm by 10 cm square divided into four 5 cm by 5 cm squares (Fig. 1). Stimulus presentation order was always clockwise and as follows: AABB.
The position of the stimulus indicated the task that needed to be performed. The top half of the square indicated the even/odd task while the bottom half indicated lower/higher task. Therefore, task order was always explicitly cued. Par-ticipants were also informed about the task order (e.g. even/ odd, even/odd, lower/higher, lower/higher) and were told to “switch task every second trial”. The location indicat-ing each task was counterbalanced across participants (e.g. even/odd task was required if the digit was in the top half of the square, and in the bottom half for the other half of the participants). After a response, instead of a blank screen, the square with no stimuli was presented for 150 ms followed by either the reminder screen (for incorrect responses or Fig. 1 Stimulus cuing frame and instructions for the low load block in Study 1
time-outs) or the next stimulus screen (if the response is correct). There were total of 160 trials with 12 practice trials for the low load block. There were equal numbers of congru-ent and incongrucongru-ent trials in each task type (even/odd and lower/higher than 5).
Stimulus–response mapping was counterbalanced across participants with the restriction that even and low; and odd and high was always assigned to the same keys. There were an equal number of participants in each stimulus–response mapping condition for the task type position (top/bottom).
The high load block followed the same instructions with the absence of a square frame. Participants were informed about the task sequence (AABB) and expected to keep track of the sequence. In this block, a reminder provided informa-tion about (1) the task instrucinforma-tions (2) the task types for the next two trials. The reason for informing participants about the next two trials was to prevent participants from losing track of the task and to prevent an error leading to a series of errors.
Unpredictable task switching paradigm
The stimuli consisted of eight letters (four vowels: A, E, I, U and four consonants: G, M, L, K) and eight digits (four even: 2, 4, 6, 8 and four odd: 3, 5, 7, 9) presented in uppercase 48-point size in Times New Roman (bold). The same two response keys were used for both task sets. That is, partici-pants were to press the c key if the stimulus was a vowel or if it was even; and to press the m key if the letter was a conso-nant or if the digit was odd. Target responses for vowel/even and consonant/odd stimuli were counterbalanced between participants. A cue was presented for short (50 ms) and long (650 ms) durations immediately before the stimulus (until response or maximum 5000 ms). A reminder of instructions (2000 ms) followed the stimulus screen in the case of incor-rect response or time-out.
Single task blocks were always undertaken before the mixed block allowing participants to establish stimu-lus–response mappings before performing the mixed block. In the single task block participants were always presented with the same type of stimulus (either a letter or a digit). Each task had 64 trials (32 long CSI, 32 short CSI) with 16 practice trials (8 long CSI, 8 short CSI). Only one type of task (A or B) was presented for each block and then the other task was presented.
In the mixed block, digits and letters were presented in a pseudo-random order such that it was not possible to predict the next trial. Mixed blocks consisted of six sequences and reverse versions of each sequence. Therefore, task A and B was counterbalanced within participants. Each sequence involved 17 stimuli. After the first trial there were 8 repeti-tion trials, 4 switch trials and 4 negative priming trials (8 switch trials in total). We controlled the number of negative
priming trials because Mayr and Keele (2000) suggested that the reactivation of the recently inhibited task-set is more difficult than if the task set is inhibited a longer time ago. This was because the after effect of inhibition would decay over the time, leading to negative priming in the for-mer but not the latter. Using a TSP with three tasks (i.e. A, B, C), they found impaired performance in n-2 repetition (e.g. ABA) compared to n-2 switch (e.g. CBA) trials (see also Arbuthnott and Frank, 2000; Arbuthnott and Wood-ward, 2002; Arbuthnott, 2005; Hübner, Dreisbach, Haider, & Kluwe, 2003; Koch, Philipp, & Gade, 2006; Schuch and Koch, 2003; Sdoia and Ferlazzo, 2008 for consistent find-ings). In switch trials, two trials required a switch after two repetitions of the alternative task and two trials occurred after three repetitions of the alternative task. We controlled the number of switch and negative priming trials as they require different levels of inhibition (e.g. Arbuthnott, 2005; Koch et al., 2006; Sdoia and Ferlazzo, 2008). Each sequence was pseudo-randomised with the limitations of: (1) the first trial was always followed by a repeat trial (2) negative priming trials were always presented after a repeat trial or another negative priming trial (3) switch trials were always presented after two or three repeat trials. There were total of 16 sequences (17 trials each) each for short and long RSI conditions. The first two sequences (1 long, 1 short) of the mixed block were practice trials. Before each sequence, par-ticipants were informed whether the cue duration would be long or short. After each sequence an information screen was shown indicating that the sequence was completed, and participants had to press space key to proceed, thereby hav-ing an interval in between each sequence. Total task duration was approximately 20 min.
Procedure
The present study included: the CAARS-S:S for measur-ing traits of ADHD, a predictable TSP and an unpredictable TSP. Tasks were administered in a pseudo-random order with the condition that unpredictable TSP was always pre-sented before the predictable TSP. Since unpredictable TSP required an extra instruction (lower/higher than 5), in order to prevent the confusion, it was always administered first. All versions of unpredictable TSP (S-R mapping) and predict-able TSP (even/odd first, low/high first; and S-R mapping) were counterbalanced across participants.
Results
Sample
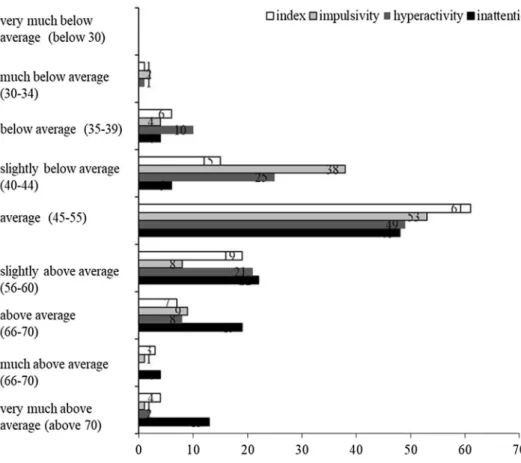
Scores from CAARS revealed that 23 participants scored above average on the ADHD index (M = 51.24, SD 8.46). For individual symptoms, the number of participants that
scored above the average was 35 for inattention (M = 55.78, SD 9.34), 26 for hyperactivity (M = 49.65, SD 8.21) and 13 for impulsivity (M = 48.02, SD 7.86). The number of partici-pants scoring in each category provided by the CAARS-S:S guidelines are reported in Fig. 2. Raw scores are transformed into standardised T-scores so that all sub-scales have mean of 50 and standard deviation of 10. T scores range between 28 (lowest) and 90 (highest) calculated based on the age and gender. Our mean and standard deviations for impulsivity, hyperactivity and index scores were within half a standard deviation from the proposed mean and standard deviations for CAARS-S:S. The mean for the inattention scores was half a standard deviation above the proposed mean but still within the confidence interval values. One participant also reported previous ADHD diagnosis, whereas two partici-pants preferred not to state. Please see Fig. 2 for detailed participant characteristics.
Analysis of general switch costs RTs for incorrect responses and trials following incorrect responses and the data points two standard deviation above and below the mean (1.4%) were removed before the analysis.
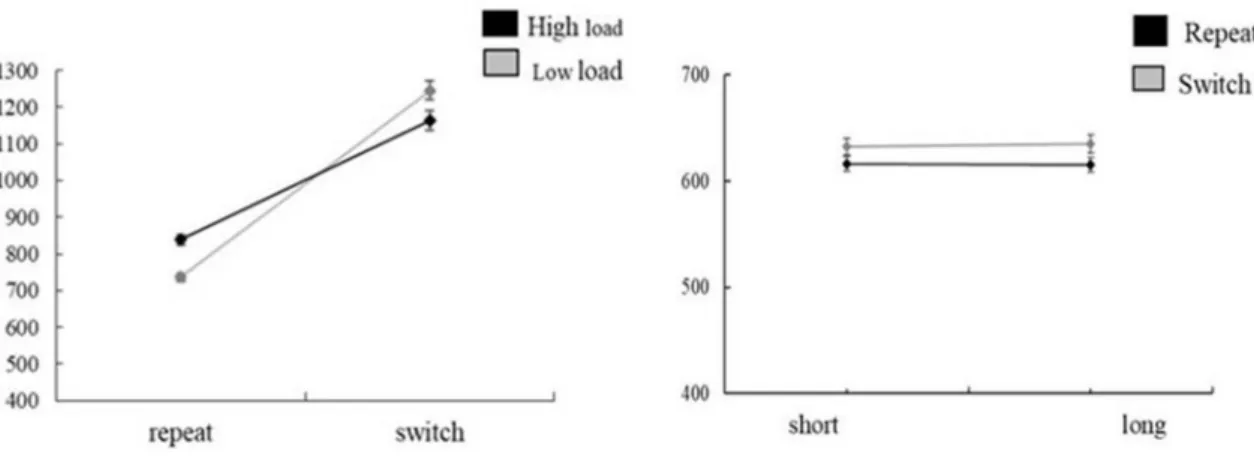
Predictable task switching paradigm. We conducted a 2 (condition: low load, high load) × 2 (transition: repeat, switch) repeated measures ANOVA to evaluate the switch cost (see also Fig. 3). A transition main effect indicated that overall RTs were higher on switch (M = 1189.76, SE 22.05)
than repeat (M = 785.31, SE 9.94) trials [F(1, 102) = 457.12,
p < 0.001, η2 = 0.82] while the condition main effect was not
significant, F(1, 102) = 2.02, p = 0.158, η2 = 0.02.
There was a significant condition × transition interac-tion, F(1, 102) = 44.34, p < 0.001, η2 = 0.30. Bonferroni
corrected paired samples t tests revealed that in the low load condition, responses to switch trials (M = 1226.99, SE 24.93) were slower than repeat trials (M = 738.74, SE 10.46), t(108) = 23.23, p < 0.001. Same effect was observed in the high load condition [switch: M = 1156.29, SE 27.51; repeat: M = 839.26, SE 14.46), t(106) = 13.91, p < 0.001].We also found that in the high load condition, repeat trials were slower [t(104) = 6.87, p < 0.001] while switch trials were faster compared to the low load condition [t(109) = 2.41,
p = 0.017]. However, this difference did not reach signifi-cance following Bonferroni correction (Pcorrected = 0.013). To test the effect of WM load on task switching, we com-pared the switch cost across conditions. Paired samples
t tests revealed that switch costs were higher in the low load (M = 474.82, SE 20.54) compared to the high load (M = 322.98, SE 22.69) condition t(101) = − 6.54, p < 0.001.
We next analysed the switch and repeat RTs for con-gruent and inconcon-gruent conditions separately. Bonfer-roni corrected paired samples t tests revealed that RTs to switch trials were longer than repeat trials in all condi-tions: for low load, switch trials took longer than repeat tri-als for congruent [switch: M = 1192.78, SE 25.41; repeat: Fig. 2 Number of participants
in Study 1 falling into each category and the corresponding
T scores in brackets based on CAARS-S:S guidelines
M = 733.81, SE 11.29, t(110) = 21.64, p < 0.001] and incon-gruent stimuli [switch: M = 1268.67, SE 25.38; repeat:
M = 751.95, SE 12.19, t(107) = 23.60, p < 0.001]. Simi-larly, for high load, switch trials took longer than repeat tri-als for congruent [switch: M = 1116.60, SE 28.78; repeat:
M =844.72 = 839.26, SE 16.83, t(109) = 11.17, p < 0.001] and incongruent stimuli [switch: M = 1221.20, SE 29.18; repeat: M = 834.28, SE 15.33, t(107) = 15.06, p < 0.001].
Unpredictable task switching paradigm. We conducted a 2 (RSI: short, long) × 2 (transition: repeat, switch) repeated measures ANOVA to evaluate the switching cost and the effect of RSI. A transition main effect indicated that overall RTs were higher in switch (M = 627.12, SE 6.27) than repeat (M = 602.37, SE 6.27) condition, F(1, 89) = 80.61, p < 0.001,
η2 = 0.48. However, the RSI main effect [F(1, 89) = 0.41,
p = 0.525, η2 = 0.01] and RSI × transition interaction [F(1,
89) = 2.69, p = 0.104, η2 = 0.03] were not significant,
indicat-ing that the RSI manipulation was not effective.
Inattention and task switching
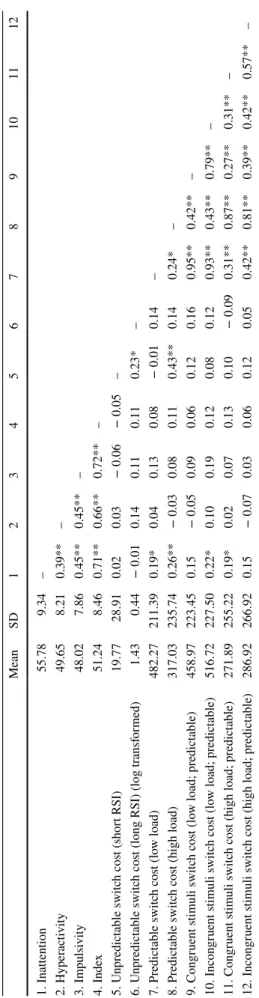
We examined the bivariate correlations between the inde-pendent and deinde-pendent variables (Table 1). Pearson corre-lation coefficients revealed significant positive correcorre-lations between inattention scores and switch cost when the tasks were predictable. Inattention was correlated to predictable switch costs in low load (r = 0.19, p =0.05) and high load (r = 0.26, p < 0.01) conditions. We also measured the switch costs separately for stimulus congruency: in the low WM condition, inattention significantly correlated with the switch costs when the stimuli were incongruent (r = 0.22, p = 0.03) but this correlation was no longer significant in the high WM load condition. In contrast, in the high WM condition, inattention was correlated with the switch costs of congruent
(r = 0.19, p = 0.05) but not incongruent stimuli. Furthermore, inattention was not significantly correlated with the switch costs when the task order was unpredictable (short RSI:
r = 0.02, p = 0.88; long RSI: r = 0.08, p = 0.41).
We ran multiple regression analysis to investigate the role of ADHD traits when explaining switch costs. We also used Bayes Factors (B) to assess the strength of evidence in support of hypotheses when the p value for the predictors was not significant. We followed Dienes (2014) to assess the strength of evidence in support of hypotheses when the p value for the predictors was not significant. Where a Bayes Factor is given, we modelled the predictions of the theory of some evidence for a relationship with a half-normal whose mean and standard deviation values were taken from Cepeda et al. (2000): experiment 1 for predictable and experiment 2 for unpredictable TSPs due to the similarity of the procedure to our study. We used the value of r square (coefficient of determination) to calculate Bayes Factor where the regres-sion model was non-significant (using BayesFactor pack-age of R software, Liang, Paulo, Molina, Clyde, & Berger,
2008).
For predictable switch costs under high load, the mul-tiple regression analysis revealed that the model (Table 2) explained 9% of the variation, F(3, 106) = 3.27, p = 0.02. Hyperactivity (p = 0.131, BH(0, 0.422) = 0.04) and impulsivity (p = 0.926, BH(0, 0.422) = 0.04) were non-significant predic-tors with Bayes Facpredic-tors providing strong evidence for the null. Thus, inattention was the only predictor of the pre-dictable switch cost under high WM load. The regression model where ADHD traits predict the switch costs in the low load condition of the predictable task was not significant and the Bayes Factor provided strong evidence for the null F(3, 107) = 1.57, p = 0.20, B = 0.16.
Due to the significant correlations, we ran multiple linear regression models to investigate whether inattention, hyper-activity and impulsivity predicted the switch cost based on congruency. Switch cost to incongruent stimuli in the low load condition [F(3, 107) = 2.13, p = 0.101, B = 0.31], and, the switch cost to congruent stimuli in the high load condi-tion [F(3, 109) = 1.47, p = 0.227, B = 0.04] yielded non-sig-nificant results. Bayes values also revealed strong evidence for the null hypothesis of no difference.
Discussion
We employed predictable and unpredictable task switching paradigms (TSPs) to investigate whether self-reported inat-tention is related to a general task switching impairment, a limitation in inhibition, or, in line with research showing a relationship between inattention and working memory (WM), an impairment specifically related to predictable task switching. The predictable TSP required participants to keep the task order available in WM and use this information to predict the next task to be performed, a form of proactive control. In the unpredictable TSP, the task order changed in a pseudo-random order, not allowing participants to prepare or to use previous information to work out the upcoming task. Therefore, the unpredictable task primarily required reactive control.
Given the negative relationship between the WM capacity and inattention even in subclinical populations (Elisa et al.,
2016; Lui and Tannock, 2007), we predicted that inatten-tive traits would be more related to the higher switch costs during predictable switching as the task requires the use of proactive control. Moreover, it was predicted that the rela-tionship between inattentive traits and switch costs would be stronger when the task involved a higher WM load (in the cue-absent condition). As predicted, we found that inatten-tive traits predicted greater switch costs in the predictable TSP but only under high WM load conditions. Bayes values provided evidence towards no relationship between hyper-activity/impulsivity and the switch cost under predictable task switching conditions and for no relationship between the ADHD-related traits and switch costs in the unpredict-able TSP.
It is interesting that inattention was related to poorer per-formance on what is essentially an easier task since the task changed in a predictable manner and thus it was possible to prepare the correct task set in advance. Such impairment fits well with the problems with planning and organisation associated with inattention. To benefit from the preparation, participants had to keep the task order available in WM and use this information to identify the next task. Our results suggest that those with inattention are specifically impaired at this preparatory activity. Whilst we found that inattentive
Table 1 Cor relations be tw een v ar iables in S tudy 1 * p < 0.01, ** p < 0.05 Mean SD 1 2 3 4 5 6 7 8 9 10 11 12 1. Inattention 55.78 9.34 – 2. Hyper activity 49.65 8.21 0.39** – 3. Im pulsivity 48.02 7.86 0.45** 0.45** – 4. Inde x 51.24 8.46 0.71** 0.66** 0.72** – 5. U npr edict able switc h cos t (shor t RSI) 19.77 28.91 0.02 0.03 − 0.06 − 0.05 – 6. U npr edict able switc h cos
t (long RSI) (log tr
ansf or med) 1.43 0.44 − 0.01 0.14 0.11 0.11 0.23* – 7. Pr edict able switc h cos t (lo w load) 482.27 211.39 0.19* 0.04 0.13 0.08 − 0.01 0.14 – 8. Pr edict able switc h cos t (high load) 317.03 235.74 0.26** − 0.03 0.08 0.11 0.43** 0.14 0.24* – 9. Cong ruent s timuli switc h cos t (lo w load; pr edict able) 458.97 223.45 0.15 − 0.05 0.09 0.06 0.12 0.16 0.95** 0.42** – 10. Incong ruent s timuli switc h cos t (lo w load; pr edict able) 516.72 227.50 0.22* 0.10 0.19 0.12 0.08 0.12 0.93** 0.43** 0.79** – 11. Cong ruent s timuli switc h cos t (high load; pr edict able) 271.89 255.22 0.19* 0.02 0.07 0.13 0.10 − 0.09 0.31** 0.87** 0.27** 0.31** – 12. Incong ruent s timuli switc h cos t (high load; pr edict able) 286.92 266.92 0.15 − 0.07 0.03 0.06 0.12 0.05 0.42** 0.81** 0.39** 0.42** 0.57** –
traits were positively correlated with switch costs in the cue-present condition, this relationship was not predictive.
We also measured switch costs separate for congruent and incongruent stimuli since the literature suggested that larger switch costs for ADHD may be driven by the switch costs for incongruent (RTs to incongruent switch trials— RTs to incongruent repeat trials) rather than congruent (RTs to congruent switch—RTs to congruent repeat trials) stimuli (Cepeda et al., 2000). As noted above the ADHD index score did not predict any switch costs in our study contrasting with the findings from Cepeda et al. (albeit in a subclinical popu-lation). However, our analysis revealed that inattention was correlated to incongruent trial switch costs, but only under low WM load. Inattention was also correlated with congru-ent trial switch costs, but only under high WM load. How-ever, inattention did not predict the magnitude of either of these indicating that in our data at least inattention does not lead to increased switch costs as a result of trial congruency.
Consistent with Liefooghe et al. (2008), switch costs were modified by WM. In the predictable TSP, responses to the repeat trials were longer in the high compared to the low WM load condition, indicating an effect of WM load in the expected direction. However, responses to the switch trials were quicker in the high (cue absent) compared to the low (cue present) WM load condition. We also found that the switch costs decreased in the high compared to low WM load condition (Fig. 3). This could be due to the type of control executed by the partici-pants. The cue-present condition involved proactive and/or reactive control depending on the strategy (keeping track of the order or benefiting the cue) to perform the task; keeping track of the task order allowed participants to prepare in advance as they figure out the next stimuli from the maintained task order and this could happen before the next stimulus appears. Utilising the cue did not allow advanced preparation. That is, in the cue-present condition, participants could choose from the two strategies for responding. The cue-absent (high WM load) condition, however, forced participants to keep track of the order which may have encouraged advance preparation, thereby reducing response times to the switch trials in the cue-absent (high WM load) compared to the cue-present (low WM load) condition. This supports the notion that inattentive traits uniquely predicted the switch costs when WM was needed
to perform proactive control for advanced preparation (cue-absent condition of predictable TSP).
To summarise the results from Study 1, we found that only inattentive traits significantly predicted task switching perfor-mance. This was only observed when switching was predict-able and trial order was not indicated by a cue, suggesting that it was the requirement to track task order and utilise proactive control that led to larger switch costs in those with high lev-els of inattention. Furthermore, none of the ADHD-related tendencies were correlated to switch costs in an unpredict-able TSP. These findings indicate that the impairment in WM associated with inattention can lead to task switching impair-ments and that the failure to observe a consistent relationship between ADHD and task switching performance in previous studies is likely due to the failure to consider the differential influence of the core symptoms of inattention, hyperactivity and impulsivity. However, these conclusions are mitigated by certain limitations in the experimental design. First, the ability to keep track of the task order and use proactive control was confounded in the present study. Second, the predictable and unpredictable paradigms differed in several ways: (1) the stim-uli in the predictable TSP were bivalent while the unpredict-able TSP had univalent stimuli; (2) the RSI was manipulated in the unpredictable TSP only leading to differences in time constraints between the predictable and unpredictable tasks. Finally, whilst there are a number of participants falling into each category that is spread normally (see Fig. 2), the hyper-active and impulsive scores were numerically more restricted than the inattention scores, which could have reduced the like-lihood of observing a relationship between these symptoms and task switching performance (although assuming a linear relationship, we believe this would not have had a significant impact on the results).
Study 2
Study 1 revealed that self-reported inattentive traits uniquely predicted higher switch costs in a predictable task switch-ing paradigm in which workswitch-ing memory (WM) was needed to track task order while unpredictable switching was not related to any of the ADHD symptoms. However, the tasks differed more than in predictability. Therefore, in the present Table 2 Summary of regression
model for inattention, hyperactivity and impulsivity scores on switch cost in high working memory load condition in Study 1
*p < 0.05, **p < 0.01
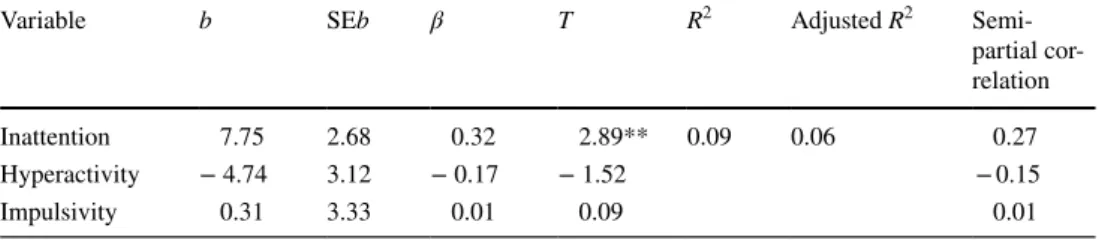
Variable b SEb β T R2 Adjusted R2
Semi-partial cor-relation Inattention 7.75 2.68 0.32 2.89** 0.09 0.06 0.27 Hyperactivity − 4.74 3.12 − 0.17 − 1.52 − 0.15
study we addressed the methodological issues raised above using bivalent stimuli in both the predictable and unpredict-able TSP and eschewing an RSI manipulation. In addition, the present study also sought to identify factors that might lead to a relationship between inattention and predictable task switching performance.
For those participants high in inattention the factor limit-ing performance in Study 1 was either the need to keep track of the order of repeat and switch trials or the need to utilise preparatory proactive control when the order was known. Given the predictable and basic nature of the sequence, the participants should have been able to take advantage of the simple sequence to improve their performance and proac-tively prepare for each upcoming trial. Inattention did not predict performance when there was environmental support for tracking task order. Clearly when the location cued the task was to be performed, the need for a contribution from working memory to track task order was reduced. Such a result could be explained by either an impairment in working memory or in the use of proactive control. In Study 1 these factors were confounded.
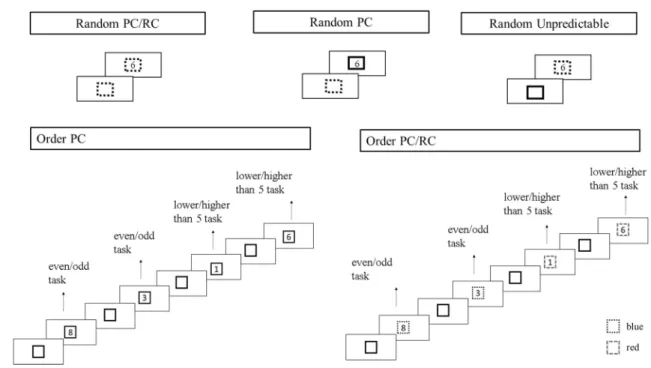
In the present experiment, participants were asked to complete five blocks of task switching where task order was either predictable (a trackable sequence engaging WM) or it was unpredictable. The task was cued with two frames (an advanced cue presented before the stimulus and stimulus cue presented with the stimulus) in black, red or blue. The coloured cue indicated which task to perform while black cue was uninformative. Moreover, in some blocks coloured advanced cue enabled participants to engage in proactive control and some blocks included a coloured stimulus cue that permitted participants to utilise reactive control to select the correct task set. The five block types were the following: (1) a predictable task switching order with black advanced cue on any trial but a coloured stimulus cue indicating the task to be performed; this condition is referred to as Order PC/RC because the predictable order permitted the use of proactive control and the stimulus colour cue permitted the use of reactive control; (2) a random task switching order with coloured advanced cue on every trial and a coloured stimulus cue indicating the task to be performed; this condi-tion is referred to as Random PC/RC because the order was random and the advanced cue permitted the use of proac-tive control and the stimulus colour cue permitted the use of reactive control; (3) a predictable task switching order with black advanced cue and black stimulus cue indicating the task to be performed; this condition is referred to as Order PC because the predictable order permitted the use of proactive control (this condition is the condition most similar to the high WM load condition of Study 1); (4) an unpredictable task switching order with a coloured advanced cue on every trial but black stimulus cue indicating the task to be performed; this condition is referred to as Random PC
because the order was random and the advanced cue permit-ted the use of proactive control; (5) an unpredictable task switching order in which a coloured stimulus cue permit-ted the use of reactive control; the condition is referred to as Random RC. This design permits the de-confounding of working memory load and proactive control. If inattention was related to impairment in the use of proactive control, it would be related to performance in any block that pre-sents an advanced cue (Random PC/RC or Random PC). If inattention was related to working memory impairments, it would be related to performance in any block/condition that has a predictable sequence and involves the need to keep track of the order of switch and repeat trials (Order PC/RC or Order PC), but especially Order PC where no other cue is provided about which task to perform (thereby replicat-ing Study 1). If inattention was related to an impairment in reactive control it would affect performance most clearly in the random RC block.
The de-confounding of working memory and proactive control is a necessary step in identifying the determining factor producing the relationship between predictable task switching and inattention. However, in the present study we also considered another potential contributor to this result. Specifically, Elisa et al. (2016) reported a relation-ship between working memory performance and subclinical symptoms of ADHD. The only working memory related task that was uniquely related to inattention was a letter monitor-ing task that measured the tendency for goal neglect. In goal neglect, although instructions are understood and not forgot-ten (a representation of the task is created; Duncan, Emslie, Williams, Johnson, & Freer, 1996; Duncan et al., 2008) participants behaviourally fail to follow these instructions (Duncan et al., 1996). Duncan et al. explained the occur-rence of goal neglect with refeoccur-rence to competition in the task model: in order to perform complex tasks, individuals need a body of knowledge composed of all relevant facts and instructions (the task model) where the cue-action map-pings with sufficient saliency are constructed. The model should be organised into small chunks of information to be retrieved when relevant triggering conditions occur. As the information in the task model is increased (e.g. by increasing the complexity in the task instructions), multiple task com-ponents compete to be represented. Due to limited capacity in some individuals, some of the task components are too weakly represented to be used when needed, resulting in goal neglect (Duncan et al., 1996, 2008). When asked, par-ticipants can re-report the instructions in full, but it is the use of components of the task model during task performance that is impaired. Goal neglect has been linked to the lapses in WM (Kane and Engle, 2003; Duncan, Schramm, Thomp-son, & Dumontheil, 2012) and fluid intelligence which is related to cognitive control functions (Duncan et al., 1995; Kane and Engle, 2003; Marshalek, Lohman, & Snow, 1983;
Oberauer, Süß, Wilhelm, & Wittman, 2003). Along with various measures of WM, Elisa et al. (2016) also measured the link between inattention, hyperactivity and impulsivity and goal neglect based on the notion that those with inat-tention have problems receiving verbal instructions. They showed that inattention was uniquely related to goal neglect even when controlling for fluid IQ.
The original conception of goal neglect has been influ-ential and other researchers have extended the concept. De Jong (2001) proposed the notion of the failure to engage hypothesis and referred to this as goal neglect. De Jong (2000) argued that the residual switch cost, a cost, even after being given time to prepare for an upcoming trial, remains because participants occasionally fail to engage and main-tain goal-related preparation (but see Mayr and Keele, 2000; Rogers and Monsell, 1995; Rubinstein, Meyer, & Evans,
2001 for an alternative view). According to the failure to engage hypothesis, individuals sometimes fail to take the opportunity to perform preparation. Given the link between inattention and increased reports of goal neglect, we hypoth-esised that the link between inattentive traits and increased predictable switch costs could be moderated by goal neglect. If this is supported by the data, then it would support the notion that goal neglect is an important contributor to the experience of inattention.
Method
Participants
As with Study 1 we collected data from 120 (different) indi-viduals (M = 20.55, SD 2.31). Participants aged between 18 and 33 with normal or corrected vision from non-clinical samples were recruited through Bournemouth University’s research participation system and through advertisements. Participants were mainly undergraduate and postgraduate students. Undergraduate students received course credits for their involvement.
Materials
Adult ADHD self report scale (ASRS) We used ASRS to measure ADHD-related traits (Adler, Spencer, Faraone, Kessler, Howes, Biederman, & Secnik, 2006; Kessler et al.,
2005). In order to show that the results of the first study were not specific to the scale employed (CAARS-S:S), in the cur-rent study, ASRS was used as an alternative scale. ASRS includes total of 18 items consisting the ADHD symptoms of Diagnostic and Statistical Manual of Mental Disorders Fourth edition (DSM-IV). There are nine items indicating inattentive symptoms (1, 2, 3, 4, 7, 8, 9, 10, 11) and nine items indicating hyperactive/impulsive symptoms (5, 6, 12, 13, 14, 15, 16, 17, 18). ASRS asks participants how often a
particular symptom of ADHD has occurred to them over the past 6 months on a five-point response scale ranging from “never” (0), “rarely” (1), “sometimes” (2), “often” (3), to “very often” (4). The ASRS was scored by averaging the participants’ ratings across the responses in each symptom cluster, providing us a continuous scale (Overbey et al.,
2011; Whalen, Jamner, Henker, Gehricke, & King, 2003).
Task switching paradigm The task required partici-pants to perform two types of tasks: participartici-pants were required to decide if the digit was even or odd (even/odd task) or if the digit was lower or higher than five. Avail-able responses (‘z’ and ‘m’) counterbalanced across par-ticipants. The task comprises two conditions where the pure condition required only one type of task throughout the block while the mixed condition required frequent switches between two tasks. There were two blocks for the pure condition (one block for each type of task) pre-sented in random order. Pure blocks were designed to make participants familiar with each type of task and learn stimulus–response associations. It was also aimed to test participants’ ability to perform each task. Participants performed total of 16 practice and 64 experimental trials for the pure condition. The Mixed Condition included five blocks presented in random order. Each block included 16 practice and 96 experimental trials. Stimuli consisted of digits between one and nine except five, presented in Courier New Bold in 36 points (bold). Before the stimulus presentation, a square with 2.8 cm length appeared as a cue (advanced cue) and stayed on the screen as a frame for the stimulus (stimulus cue). Depending on the block, the frame was either red, blue or black. The colours red and blue indicated the task to be performed (counterbalanced across participants). At the beginning of each block, par-ticipants were asked to make a key press when they were ready. A 2000-ms blank screen followed the key press. Each trial started with the square frame; then, the stimulus was presented inside the frame after 250 ms. The stimulus was present until the response (maximum response dura-tion was 5000 ms). Following an error, a reminder for the rules appeared on the screen for 1200 ms. Please see Fig. 4 for a depiction of the sequence of events.
In the Random PC/RC block, both the advanced cue and the stimulus cue were coloured indicating the task to be per-formed. Hence, participants had the opportunity to attend the advanced cue or the stimulus cue. The advanced cue allowed advanced preparation and the use of proactive control, while the stimulus cue did not. Instead, the stimulus cue required participants to engage in reactive control where the cognitive processes are triggered by the stimulus presentation. The tasks were presented in a random order.
In the Order PC/RC block followed the same proce-dure as the previous blocks, except that the tasks were
presented in a set order (AABB…). The stimulus cue was presented in red or blue, indicating the task to be per-formed. Therefore, participants could either keep track of the task order or wait for the stimulus cue to figure out the required task. Keeping track allowed advanced prepara-tion (proactive control) while attending the stimulus cue required reactive control.
In the Random PC block, the advanced cue was pre-sented in red or blue, indicating the upcoming task. The frame then turned to black. Since participants had to focus on the advanced cue to figure out the next task, they were strongly encouraged to engage in advanced preparation. The tasks were presented in a random order.
The Order PC block, similar to Order PC/RC block, the tasks were presented in a set order (AABB…). Both the advanced cue and the stimulus cue were always black, forcing participants to keep track of the task order to find out the task to be performed. Keeping track of the task order allowed participants to know the upcoming task before stimulus presentation, hence strongly encouraging advanced preparation.
Finally, in the random RC condition, tasks were in ran-dom order and were indicated by the stimulus cue, allow-ing only the use of reactive control. Therefore, this block involved unpredictable switching.
Automated operation span task Automated version of operation span task taken from Unsworth et al. (2005) was used as a measure of working memory capacity. The task
required participants to remember the letters and solve mathematical problems in between as the distraction (Uns-worth et al., 2005). Mathematical problems and letters were presented one at a time in the centre of the screen. Partici-pants reported the sequence of letters by choosing among possible letters from a 4 by 3 matrix of possible letters (F, H, J, K, L, N, P, Q, R, S, T, and Y). For the mathematical operations, participants were told to solve the mathematical operation as quickly as possible and press a mouse button when ready. Next, participants were asked to report if the number presented on the screen is the correct solution of the mathematical problem by clicking on either the true or the false button.
Participants completed a practice session with simple let-ter span following another block of 15 mathematical prob-lems only. In the experimental condition, letters appeared on the screen for 800 ms while recall phase was untimed. After the recall, an accuracy feedback for both operations was provided. Following the practice sessions for letter recall and mathematical problems, participants had a final practice combining both operations, identical to the experi-mental condition. In the experiexperi-mental condition, sequences of mathematical problems and letters were presented. There were three sets from each possible set size (3–7 letters to remember and mathematical problems to solve). Thus, in total, 75 letters and 75 mathematical problems were pre-sented. Scores are calculated by adding the number of letters recalled in the correct order (also known as the partial score; Turner & Engle, 1989). Participants below the 85% accuracy Fig. 4 Example demonstration for the blocks of mixed condition in the task switching paradigm in Study 2
were not included in the analysis to ensure that participants were attempting to perform both operations.
Letter monitoring task The letter monitoring task was taken
from Duncan et al. (1996) as a measure of goal neglect. In the letter monitoring task, participants are presented with pairs of letters or digits on the left and right side of a cen-tral dot. The task is to ignore the digit trials and read aloud the letters on the directed side on the letter trials. Each trial included the presentation of 13 pairs of digits/letters (Fig. 5). Digits were chosen from the set 1–8, and letters were ran-domly chosen without replacement from the letters of the alphabet (except D, I, O, V, and W). Following the instruc-tions of Duncan et al., participants were first prompted by a “READY?” message. Following the participant’s posi-tive response via verbal report, the experimenter made a key press to initiate a 500-ms blank interval after which the practice trial began. Each trial started with the presentation of the instruction “WATCH LEFT” or “WATCH RIGHT” for 1 s indicating the side from which the participant was required to report the letters. The message was followed a by a further 1-s interval for the participant to get ready
for the upcoming stimulus sequence. Each stimulus screen consisted of either a pair of digits or letters presented for 200 ms followed by a blank interval of 200 ms. Initially, there were ten pairs. After the 10th pair, the cue with a “+” or “−” symbol was presented in the centre of the screen for 200 ms. A “+” sign indicated to the participant that they must attend to the right while “−” sign indicated to attend to the left side of the dot (again reporting only from trials with letters). Following a further 200 ms, three more pairs were presented. After the symbol, the first pair was always digits and the last two were always letters. Thus, each trial had total of 13 pairs of digits or letters. Please see Fig. 5 for an example trial. A scoring sheet with correct answers was prepared for the experimenter in advance to manually record the participant’s responses.
To ensure that the cue was remembered correctly, pieces of paper were placed on the appropriate side of the computer monitor with “PLUS” (for the right) and “MINUS” (for the left) signs written on them. All participants were instructed to: (1) read aloud the letters and ignore the digits; (2) ini-tially report from the side instructed by the message on the screen (until the cue is presented); (3) then use the cue (+ or − sign) to attend the correct side for the next three pairs. The task comprised three blocks of 12 experimental trials (with 13 pairs presented in each trial) with 3 sub-blocks (4 trials each) within each block. Participants also received a practice trial which was repeated until at least one letter was reported from either (correct or incorrect) side and the “+/−” cue was reported accurately. For some trials, participants had to change the attended side (e.g. a WATCHLEFT message followed by the + cue which indicates attending right) while others did not require a change (e.g. a WATCHLEFT mes-sage followed by the − cue which indicates attending left). To equalise the number of trials with change and no change, in each successive trial of four, there was one “WATCH LEFT” followed by a “−” cue, one “WATCH LEFT” fol-lowed by a “+” cue, one “WATCH RIGHT” folfol-lowed by a “−” cue, and, one “WATCH RIGHT” followed by a “+” cue presented in random order. Participants were asked to repeat the rule again between each block. Instructions for the task were provided following Duncan et al.’s (1996) instructions.
Scoring A correct response was defined as the following of the cue instruction. Participants received a score of 1 for each letter reported from the correct side. A perfect trial included a score of two with two letters reported from the correct side. There were two requirements for scores to be counted. First, for the trials to be valid, participants had to report at least three letters from the appropriate side indi-cated by the initial message (“WATCH LEFT”/“WATCH RIGHT”). This was to ensure that participants attended to the side indicated by the initial message. Second, partici-pants had to report at least one valid change and one valid no-change trial to pass each sub-block. The final score was Fig. 5 An example demonstration of a letter monitoring task trial
(used in Study 2) taken from Duncan et al. (1996). Starting from the top to bottom, “Watch RIGHT” message (1 s) is followed by the pairs. Each pair is presented in a separate screen for 200 ms with a blank interval of 200 ms
computed by the sum of the each passed sub-block. Scores indicate to what extend a participant’s performance was affected by the cue.
Raven’s standard progressive matrices (SPM; shortened ver‑ sion) We used Raven’s standard progressive matrices to measure fluid intelligence as it is related to goal neglect and working memory performance (Duncan et al., 2008; Kane, Hambrick, & Conway, 2005). Participants SPM scores were also entered into the regression analysis as a predictor variable to ensure the predictive value of goal neglect and working memory were not simply as result of the variance these measures share with fluid intelligence. In the short-ened Raven SPM (Bouma, Mulder, & Lindeboom, 1996), three sets of items from the original version (Sets B, C, and D) were administered as an indicator of fluid intelligence. Each item consisted of a matrix of black and white elements composing an overall pattern (rule). Participants were asked to complete this pattern by choosing the correct missing ele-ment among multiple possible options. There was no time limit in completing the test. Each item was scored either 1 (correct) or 0 (incorrect). Administration and scoring were carried out based on the guidelines provided in the SPM manual (Raven, 1938).
Procedure
The present study included: the ASRS for measuring ADHD related tendencies, Task Switching Paradigm, OSPAN as a working memory measure, Letter Monitoring Task as a measure of goal neglect (and Feature Matching Task), and SPM as a control measure of fluid abilities for the goal neglect measures. After providing the participant informa-tion sheet and the informed consent, tasks were administered in counterbalanced order.
Results
Scores from ASRS ranged between zero and four. Mean scores and standard deviations for ASRS are reported in Table 3. The mean scores of inattention were again higher than those for hyperactivity/impulsivity and total ADHD scores but this difference was within 1 standard deviation above and below the mean. Outliers 2SD above and below the mean were removed for SPM (3.33%), Random PC/ RC (5%), Order PC/RC (5%), Random PC (5.8%), Order PC (5.8%), and Random RC (5%) due to non-normal dis-tributions. The OSPAN scores for the participants scoring below 85% accuracy on math questions were also removed (7.5%). Participants were only excluded for specific parts of the experiment if their performance was deemed as outliers for that part of the experiment. Total of 52 out of 1200 data points (4.33%) were removed across all analyses.
Analysis of switch costs
RTs for incorrect responses and trials following incorrect responses were not analysed. We found switch costs for all conditions (Fig. 6). Bonferroni corrected paired samples t
tests revealed that responses to switch trials [Random PC/ RC: M = 1187.01, SD 253.83; Order PC/RC: M = 1256.18, SD 222.33; Random PC: M = 1201.34, SD 314.13; Order PC: M = 989.48, SD 278.25; Random: M = 1226.58, SD 199.17] were slower than repeat trials [Random PC/RC:
M = 796.63, SD 145.49; Order PC/RC: M = 829.20; SD 178.52; Random PC: M = 1008.13, SD 231.93; Order PC: M = 763.19, SD 163.34; Random: M = 884.62, SD 125.24] in Random PC/RC [t(102) = 17.47, p < 0.001], Order PC/ RC [t(104) = 23.95, p < 0.001], Random PC [t(102) = 10.51, p < 0.001], Order PC [t(104) = 10.68, p < 0.001], Random [t(102) = 21.94, p < 0.001].
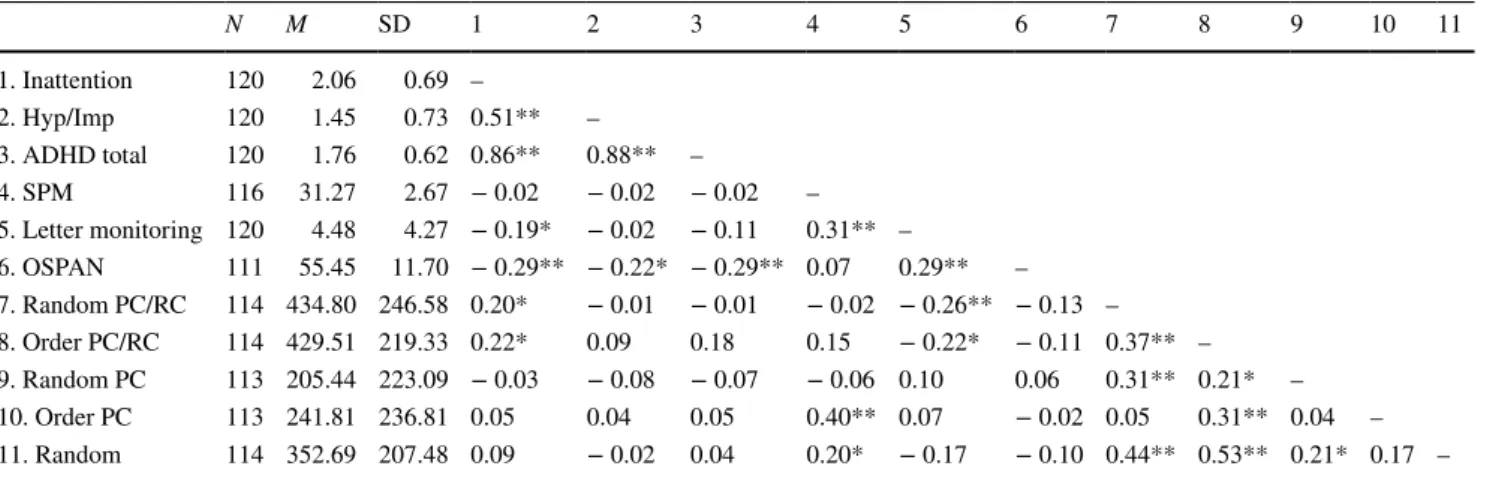
Table 3 Correlations between variables in Study 2
*p < 0.01, **p < 0.005 N M SD 1 2 3 4 5 6 7 8 9 10 11 1. Inattention 120 2.06 0.69 – 2. Hyp/Imp 120 1.45 0.73 0.51** – 3. ADHD total 120 1.76 0.62 0.86** 0.88** – 4. SPM 116 31.27 2.67 − 0.02 − 0.02 − 0.02 – 5. Letter monitoring 120 4.48 4.27 − 0.19* − 0.02 − 0.11 0.31** – 6. OSPAN 111 55.45 11.70 − 0.29** − 0.22* − 0.29** 0.07 0.29** – 7. Random PC/RC 114 434.80 246.58 0.20* − 0.01 − 0.01 − 0.02 − 0.26** − 0.13 – 8. Order PC/RC 114 429.51 219.33 0.22* 0.09 0.18 0.15 − 0.22* − 0.11 0.37** – 9. Random PC 113 205.44 223.09 − 0.03 − 0.08 − 0.07 − 0.06 0.10 0.06 0.31** 0.21* – 10. Order PC 113 241.81 236.81 0.05 0.04 0.05 0.40** 0.07 − 0.02 0.05 0.31** 0.04 – 11. Random 114 352.69 207.48 0.09 − 0.02 0.04 0.20* − 0.17 − 0.10 0.44** 0.53** 0.21* 0.17 –
Pearson correlation coefficients revealed significant cor-relations (Table 3). Inattention was correlated with letter monitoring (r = − 0.19, p =0.04) and OSPAN (r = − 0.29,
p =0.002) scores. Inattention was also correlated to switch costs in random PC/RC (r = 0.20, p = 0.04) and order PC/RC (r = 0.22, p = 0.018) conditions. Composite scores of ADHD were also correlated to OSPAN (r = − 0.29, p =0.002). Scores of SPM were correlated with letter monitoring (r = 0.31, p =0.001), task switching in random (r = 0.20,
p =0.038) and order PC (r = 0.40, p <0.001) conditions. We used Bayes Factors (B) to assess the strength of evi-dence in support of hypotheses when the p value for the predictors was not significant. We followed Dienes (2014) to assess the strength of evidence in support of hypothe-ses when the p value for the predictors was not significant. Where a Bayes Factor is given, we modelled the predictions of the theory of some evidence for a relationship with a half-normal whose mean and standard deviation values were taken from the variable inattention in the model.
Inattention and goal neglect
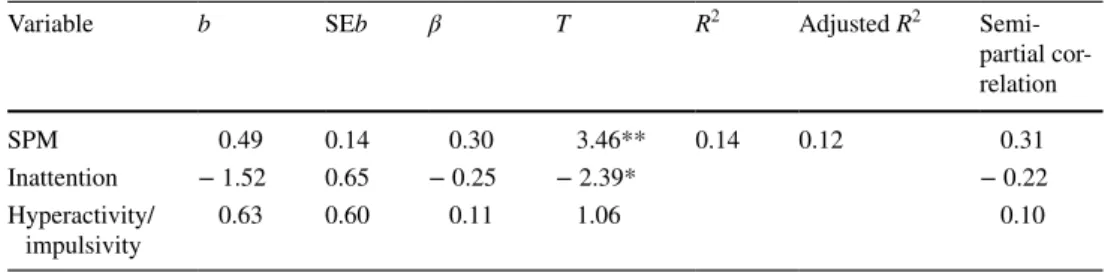
We ran multiple regression analysis where inattentive and hyperactive/impulsive traits were used as predictors for let-ter monitoring performance (Table 4). The model explained 14% of the variation in, F(3, 115) = 5.98, p < 0.001. SPM and inattention were the significant predictors where hyper-activity/impulsivity was non-significant with Bayes Factors providing evidence for the null (p = 0.292, BH(0, 0.636) = 0.26). The prior was taken from the variable inattention from the same model.
Inattention and working memory
We ran multiple regression analysis where inattentive and hyperactive/impulsive traits were used as predictors for Opera-tion Span Task performance (Table 5). The model for random PC/RC explained 10% of the variation in, F(3, 106) = 3.81,
p = 0.012. Inattention was a significant predictor, whereas hyperactivity/impulsivity (p = 0.592, BH(0, 1.801) = 0.17) and SPM (p = 0.609, BH(0, 1.801) = 0.04) were non-significant with Bayes Factors providing evidence for the null.
Inattention and task switching
Due to the significant correlation, we ran multiple regres-sion analysis to investigate the role of ADHD traits when explaining switch costs for the random PC/RC and order PC/RC conditions where the use of both proactive control and reactive control was possible.
The multiple regression analysis revealed that the model explained 6% of the variation, F(2, 106) = 3.18, Fig. 6 RTs of the switch costs in each condition for Study 2. Error
bars indicate standard error
Table 4 Summary of regression model for inattention and hyperactivity/impulsivity scores on letter monitoring scores when controlling for SPM scores (Study 2)
*p < 0.05, **p < 0.01
Variable b SEb β T R2 Adjusted R2
Semi-partial cor-relation SPM 0.49 0.14 0.30 3.46** 0.14 0.12 0.31 Inattention − 1.52 0.65 − 0.25 − 2.39* − 0.22 Hyperactivity/ impulsivity 0.63 0.60 0.11 1.06 0.10
Table 5 Summary of regression model for inattention and hyperactivity/impulsivity scores on OSPAN scores when controlling for SPM scores (Study 2)
*p < 0.05, **p < 0.01
Variable b SEb β T R2 Adjusted R2
Semi-partial cor-relation SPM 0.21 0.41 0.05 3.46 0.10 0.07 0.05 Inattention − 4.59 1.80 − 0.28 − 2.55* − 0.24 Hyperactivity/ impulsivity − 0.89 1.66 − 0.06 − 0.54 − 0.05