With the continued emphasis on accountability for students, schools are working to increase the reading academic performance of their non-proficient students. Many remedial approaches fail to identify the individual strengths and weaknesses and tend to treat these students with a singular remedial focus on word identification (Allington, 2001). In this quantitative study, I explore the reading and motivational patterns present with elementary non-proficient readers representing marginalized groups. The results suggest that non-proficient readers do not need remediation with a singular focus, but have unique needs that must be taken into account when planning remediation. This study provided unique findings by examining the reading and motivational profiles of this unique sample of students. Six profiles were identified that represented strengths and weaknesses within the area of reading, as well as identifying preferred and less preferred motivators. The study also supported the idea that motivation is multi-dimensional and should be considered when providing support to struggling readers.
by
Hiawatha D. Smith
A Dissertation Submitted to the Faculty of The Graduate School at The University of North Carolina at Greensboro
in Partial Fulfillment
of the Requirements for the Degree Doctor of Philosophy Greensboro 2017 Approved by ______________________ Committee Chair
ii
ii
Pageii
22 Pageii22
APPROVAL PAGEThis dissertation written by HIAWATHA D. SMITH has been approved by the following committee of the Faculty of the Graduate School at The University of North Carolina at Greensboro. Committee Chair ____________________________________ Samuel Miller Committee Members ____________________________________ Terry Ackerman ____________________________________ Jewell Cooper ____________________________________ Melody Zoch ____________________________ Date of Acceptance by Committee
_________________________ Date of Final Oral Examination
iii
iii
Pageiii
22 Pageiii
22
TABLE OF CONTENTS Page LIST OF TABLES ...vLIST OF FIGURES ... vii
CHAPTER I. INTRODUCTION ...1
Problem Statement ...4
Purpose of the Study ...7
II. REVIEW OF LITERATURE ...10
Review of Reading Profiles Literature ...12
Review of Motivation Profiles Literature ...24
Need for Marginalized Groups ...31
Need for Economically Disadvantaged Students ...34
Recommendations ...40 III. METHODOLOGY ...44 Research Design ...44 Data Analysis ...57 IV. RESULTS ...64 Reading Trends ...65 Reading Factors ...72 Reading Profiles ...78
Motivation for Reading Trends ...82
Motivation Factors ...85
Motivation Clusters ...95
Motivation and Reading Clusters ...100
V. DISCUSSION ...106
Reading Profiles ...107
Motivation Profiles ...108
iv
iv
Pageiv
22 Pageiv
22
Implications ...114 Future Work ...120 Limitations ...121 Conclusions ...122 REFERENCES ...124v
v
Pagev
22 Pagev22
LIST OF TABLES PageTable 1. Comparison of Areas Assessed in Reading Literature ...22
Table 2. Instruments for Data Collection ...56
Table 3. Descriptive Statistics for the Reading Data by School ...67
Table 4. MANOVA Test Results for Reading Differences Between Schools ...69
Table 5. Post Hoc Test Comparison Between Schools ...69
Table 6. Descriptive Statistics for the Reading Data by Grade Level ...70
Table 7. Total Variance of Reading Factors ...74
Table 8. Reading Factor Communalities ...75
Table 9. Reading Variables Factor Loadings ...76
Table 10. Reading Cluster History ...80
Table 11. Reading Clusters Summary Data ...81
Table 12. Motivation Item Descriptive Statistics ...84
Table 13. Initial MRQ Factor Structure by Instrument Authors ...87
Table 14. Revised Final MRQ Factor Structure ...91
Table 15. Descriptive Statistics for the Motivation Data by School...93
Table 16. MANOVA Test Results for Motivation Differences Between Schools ...94
Table 17. Descriptive Statistics for the Motivation Data by Grade Level ...96
Table 18. MANOVA Test Results for Motivation Differences Between Grades ...97
Table 19. Motivation Cluster History ...98
vi
vi
Pagevi
22 Pagevi
22
Table 21. Combined Cluster History ...102 Table 22. Combined Clusters Summary Data ...103
vii
vii
Pagevii
22 Pagevii
22
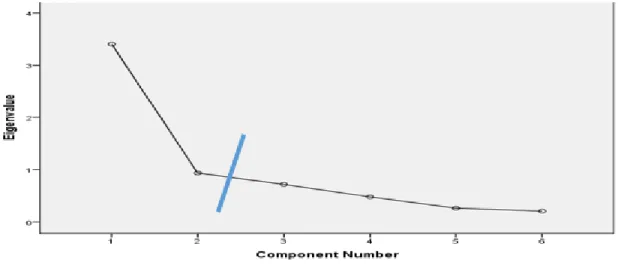
LIST OF FIGURES Page Figure 1. NAEP Trends Ethnicity Comparisons ...34 Figure 2. NAEP Trends Economic Comparisons ...35 Figure 3. Scree Plot of the Reading Factors ...741
1
Page1
22 Page1
22
CHAPTER I INTRODUCTIONStudents’ academic performance continues to be a primary concern for our nation’s schools and teachers. As teachers attempt to educate students, they face the problem of ensuring that all students, including those from marginalized populations (race, gender, religion, cultural group, or socioeconomic status) demonstrate proficiency (Brown-Jeffy & Cooper, 2011; NCLB, 2001). As policy makers continue to implement policies to address this goal, a focus is placed particularly on the performance of non-proficient readers because all students are expected to read at grade level by the end of the third grade. This focus is a result of federal accountability policies that evaluate students’ performances on various accountability measures. This accountability places emphasis on all students being successful with reading.
The National Assessment of Educational Progress Assessment is a nationally (bi-annually) administered survey of achievement regarded as a source of information for state-to-state comparisons as it assesses students’ ability to read within three different contexts; reading for literary and informational purposes, and to perform a specific task (schedules, directions, maps). NAEP scores have played a major role in the development of educational policy over the last decade (Swanson & Barlage, 2006). The most recent NAEP results (National Center for Education Statistics, 2015) showed that 64% of fourth-grade students and 66% of eighth-grade students failed to meet its proficiency
2
2
Page2
22 Page2
22
level. The results showed a 1% point decrease (4th grade) and 2% increase (8th grade) in the percent of student scoring below proficient on this assessment. Despite continued efforts at school reform via mandates, over half of our students are still unsuccessful on reading assessments.
As a result of nationwide testing via NAEP and other state level assessments, additional mandates resulted in the creation of No Child Left Behind (NCLB), which originally promised to have all students reading proficiently by the year 2014 (NCLB, 2001). The goals of NCLB emphasized proficiency of marginalized groups, including economically disadvantaged, minority, and English Language Learner students. This legislation required accountability systems for each state to annually monitor the
academic performance of students in grades 3-12. The primary signature of NCLB, thus far, has been the imposition of high stakes testing of students, even though policy makers know that children of poverty are more likely to fail than children of other socioeconomic groups (McCaslin, 2009).
The Reading First initiative was developed as a part of NCLB and provided funding for the identification of scientifically-based research to improve reading instruction with the hope of reducing the number of non-proficient students (Learning Point Associates, 2004). It provided four pillars to guide reading programs; valid and reliable assessments, effective instructional programs and aligned materials, professional development, and dynamic instructional leadership. The main result of this initiative was the teaching of reading through phonics-driven instruction. This focus led to programs, professional development, and materials with this stated isolated remedial purpose.
3
3
Page3
22 Page3
22
Several problems arose as a result of accountability legislation and subsequent initiatives. The underlying problem is that the legislation’s emphasis on non-proficient students resulted in them being treated as a homogenous group because their reading scores fell within a similar performance range (Afferbach, 2004). If these students are not homogenous, as Buly and Valencia (2002) claimed, then a one-size-fits-all emphasis on remediation via the teaching of isolated word identification skills and a failure to acknowledge other reading skills is misplaced. Previous researchers have warned not to rely on a singular remedial focus via single assessments to make important instructional decisions (Elmore, 2002; Shepard, 2000). These findings support the idea that additional information about non-proficient students’ academic performance is necessary to help them achieve success.
Despite these warnings, schools regularly address the needs of non-proficient readers by providing intensive remedial instruction in various components of word recognition (Allington, 2001). These remedial approaches are aligned with the common assumption that phonics and phonemic awareness skills need to be mastered before students can learn to comprehend texts (National Reading Panel, 2000). This response is problematic in two ways. First, as stated earlier, non-proficient readers may not be a homogeneous group: individuals within this grouping may have different instructional needs than others. Second, this intervention only considers reading abilities without attending to their motivations for becoming engaged in reading. This alternative is particularly important because of recent studies showing the importance of students’ motivation for reading as a key component of their later reading success (Guthrie, Hoa,
4
4
Page4
22 Page4
22
Wigfield, Tonks, Humenick & Littles, 2007; Unrau & Schlackman, 2006; Wang & Guthire, 2004).
Problem Statement
Schools’ reliance on a one-size-fits-all approach to assisting struggling readers increased dramatically in recent years due to an intensified emphasis on test-driven accountability (Allington & McGill-Franzen, 1992; No Child Left Behind, 2001; Slavin, Cheun, Holmes, Madden, & Chamberlain, 2013). As stated earlier, remedial
interventions mainly focused on improving non-proficient readers’ word recognition abilities (Allington, 2009; Fisher & Ivey, 2006). Questions have been raised about whether such a one-dimensional focus adequately represents non-proficient students’ literacy needs (Afferbach, 2004; Allington, 2001; Buly & Valencia, 2002; Lin, 2000; Shepard, 2000; Valencia & Buly, 2004). Such questions are important because struggling students may need a variety of remedial approaches if they are to become successful readers (Moje, 2004). As stated by Buly and Valencia (2002), one-size-fits-all reasoning tends to treat the symptoms of not being a proficient reader without
understanding the many possible underlying causes for this lack of proficiency. Buly and Valencia (2002) designed a study to identify these underlying causes, inclusive of reading skills and strategies that characterize non-proficient readers’
strengths and weaknesses (Valencia, 2011). They examined the reading profiles of upper grade elementary students deemed non-proficient on a state mandated reading assessment because they failed to achieve at grade level. Instead of finding a common reason for their struggles, the authors discovered ten profiles based on patterns of students’ ability to
5
5
Page5
22 Page5
22
identify words quickly (word identification), read fluently (fluency), and make meaning from the text read (meaning). Their findings underscored the need to develop different remedial programs based on students’ individual strengths and weaknesses. Their research led to other studies where researchers identified multiple models of reading profiles for struggling readers across grade levels (Dennis, 2013; Leach, Scarborough, & Rescorla, 2003; Leseaux & Kieffer, 2010; Meyer, et al., 2013; Rupp & Leseaux, 2006; Pierce, Katzir, Wold, & Noam, 2007).
The work of Buly and Valencia (2002, 2004) challenges the assumption of a one-size-fits-all model for addressing the needs of struggling readers, and other researchers have joined in the challenge with the creation of different profiles to describe non-proficient students. While the identification of multiple profiles supports the need for various remedial approaches, it also raises questions about the extent to which there are consistent underlying structures represented in profiles across different studies. Without an understanding of this underlying structure, a one-size-fits-all approach may be as inappropriate for helping non-proficient readers as an any-profile-model approach. If we are to support struggling readers, particularly those from marginalized student
populations, it is important to gain this understanding of the underlying constructs that determine the successful engagement of non-proficient readers in their academic studies.
Reading researchers have shown that low performing students are not a
homogenous group (Dennis, 2013; Valencia & Buly, 2002); however, their profiles are limited to cognitive domains. The continued barrage of assessments being forced on students, as early as kindergarten, and focusing solely on isolated reading skills, continue
6
6
Page6
22 Page6
22
to impact their beliefs about reading and their reading performance. Previous researchers have warned not to rely on a singular assessment to make important decisions about children (Elmore, 2002; Shepard, 2000) and thus support the idea that additional
information about students’ values, beliefs and perceptions about reading are essential to providing effective remedial support to assist them with achieving success.
Baker and Wigfield (1999) designed a study to identify motivational profiles. They generated profiles of 5th and 6th grade regular education students. Through their profiles, they found that children’s motivations for reading are multidimensional, originating from varied backgrounds and experiences. They identified seven profiles inclusive of different patterns of motivation from the areas of efficacy, importance, curiosity, involvement, challenge, recognition, grades, competition, social, compliance and work avoidance. Their profiles suggest that students should have differences in motivation and these occur in varied ways and purposes. Therefore, no students should be classified as motivated or not motivated, but should be assessed to determine their motivational preferences for reading activities.
Though their work addresses the need for educators to understand the
motivational constructs represented by students, they failed to include three things. First, despite the intense accountability focus placed on non-proficient students from
marginalized populations, their study did not specifically address these students. Second, while they addressed motivation, they lacked an explicit connection to students’ reading performances to better understand them holistically. Finally, the study examined ethnic differences, but they did not include a specific focus on minority students because 52% of
7
7
Page7
22 Page7
22
their participants were Caucasian. This supports a need to specifically address marginalized groups.
Purpose of the Study
Existing studies have addressed either the reading profiles of non-proficient students or the motivational profiles of students in general, but the two have not been bridged. As well, these studies have lacked a focus on understanding marginalized student populations, including those from schools with high population of minorities, particularly African American and Hispanic students. The purpose of this study is to evaluate the reading and motivation profiles of elementary students, who have failed to pass their state’s mandated reading assessment, and attend schools with similar student demographics, including a large percentage of minority students.
Research Questions
This study examined the reading and motivational profiles of non-proficient students across the upper elementary grades. The participating sample came from schools with a high percentage of students representing marginalized groups, mainly African-American, Hispanic, and those whose families lack economic resources.
1. What trends of reading and motivation for reading are represented in 3rd, 4th and 5th grade non-proficient students?
2. What underlying motivational and reading constructs represent non-proficient 3rd, 4th and 5th grade students?
8
8
Page8
22 Page8
22
4. What are the motivation profiles of 3rd, 4th and 5th grade non-proficient students?
5. What are the reading and motivation profiles of 3rd, 4th and 5th grade non-proficient students?
6. What do these profiles tell us about the instructional needs of 3rd, 4th and 5th grade non-proficient students?
Significance of the Study
Existing studies have addressed the reading profiles of non-proficient students as well as the motivational profiles of a generic sample of students, but the two have not been connected. They have failed to place an emphasis on understanding marginalized students, including students of color, especially those from low-income families, who struggle with reading in the elementary grades. Studies have shown that struggling readers can display a combination of both word recognition and meaning difficulties (Buly & Valencia, 2002; Dennis 2012) and that students may have varying motivational characteristics (Baker & Wigfield, 1999). When teachers provide instruction and
remediation to non-proficient readers, the work must include multiple areas of reading as well as motivation. Motivation is a key factor in a student’s choice to read, their beliefs about their reading, and the value they place upon the act of reading (Cambria & Guthrie, 2010; Schiefele, 1999). Through the use of motivation as a component in reading
profiles that directly address marginalized student groups, teachers might have a better chance to increase the academic achievement of non-proficient minority students. In addition, the profiles from this research can add to the existing literature by offering a
9
9
Page9
22 Page9
22
sample that comes directly from low income schools that are not identified as high performing. Through this work, researchers and teacher educators can begin to think about the specific reading factors represented as well as the role that motivation plays specifically for non-proficient, low-income, minority students.
10
10
Page10
22 Page10
22
CHAPTER II REVIEW OF LITERATUREThe primary signature of NCLB, thus far, has been the imposition of high stakes testing of students to monitor academic performance; this monitoring has an equal goal for all students, 100% proficiency, which has had negative implications for students’ performance and motivation throughout all schools (Au, 2009; McCaslin, 2009).
Increased accountability via testing was initially thought to be a positive achievement by measuring and comparing standardized assessment results within schools and states, and by motivating the unmotivated to learn (Orfield & Kornhaber, 2001); however, testing has negatively impacted the motivation of students and placed limits on their
opportunities to reach academic expectations (Amrein & Berliner, 2003; Au, 2009). An abundance of federal funds have been devoted to increasing achievement for students. Unfortunately, despite the appearance of vast amounts of federal funding, accountability-driven reforms with continued and frequent high-stakes testing only confirm what we already knew regarding student reading achievement, in that, the same populations continue to fail (National Center for Education Statistics, 2015). Two possible reasons for continued failure include the following. First, there is a lack of any emphasis on understanding students’ motivation. This includes acknowledging why students become engaged in some activities and not others (Guthrie, Coddington, & Wigfield, 2009) and using this information to modify instructional practices for students.
11
11
Page11
22 Page11
22
Second, the majority of the studies failed to include students from marginalized groups, such as African American and Hispanic, particularly those who are economically
disadvantaged, the very students whom this legislation was intended to help. This lack of inclusion of these groups limits our understanding of why these students have not
improved their achievement (Unrau & Schlackman, 2006).
The purpose of this section is to discuss and evaluate existing research related to reading profiles and the need to address motivation profiles as well to more fully
understand why low-achievers continue to fail to perform at grade level. It will also address the reasons and implications of addressing marginalized groups when attempting to understand non-proficient readers. This section will be discussed in three major parts. In the first part, I will discuss studies where researchers have identified profiles of readers (non-proficient in isolation or with proficient students) to see if a common set of profiles exists beneath different findings. I will do this by examining patterns of performance of struggling students along with a highlight of the samples included. I will start this evaluation with a more detailed explanation of the Buly and Valencia (2002) study, followed by a review of subsequent studies of reading profiles, and then I will evaluate the extent to which a common set of profiles or an underlying structure exists to help educators understand the unique needs of struggling readers.
In the second part, I will evaluate whether the motivational profiles for non-proficient readers represent the same variability as their reading profiles by examining the patterns and constructs used in different studies. In this section, I will highlight existing research that assessed the motivational patterns of students. This second part is important
12
12
Page12
22 Page12
22
because researchers have identified motivation as a critical factor in determining the extent to which students become engaged in their studies (Baker & Wigfield, 1999; Mazzoni, Gambrell, & Korkeamaki, 1999). The section will conclude with how my suggested study fills an existing gap in the research.
In the third part, I will focus on whether certain marginalized groups have been represented adequately within existing research. I will highlight the need to address these groups in research related to reading and motivation profiles and how the implications of the research will improve the outcomes for these groups of students. Last, I will finish the review with recommendations for future research based on the gaps within existing research.
Review of Reading Profiles Literature
In the initial study by Buly and Valencia (2002), their investigation did not unveil a singular reason for failure on the mandated state proficiency test. Instead, the authors used cluster analysis to group non-proficient students based on the similarities with their reading performance levels. They discovered profiles based on students’ strengths and weaknesses with identifying words quickly (word identification), reading fluently (fluency), or making meaning from the text read (meaning). There were ten profiles initially identified, grouped into four pairs, followed by two singular profiles. The authors later (2004) combined the four pairs of double profiles based on their statistical similarities for a total of six profiles to facilitate its understanding by practitioners. Respectively, the grouped profiles included:
13
13
Page13
22 Page13
22
o Cluster 1 & 2: Automatic Word Callers 18%: The students in this cluster are stronger in word identification and fluency than meaning.
o Cluster 3: Struggling Word Callers 15%: The students in this cluster are experiencing some difficulty in word identification and meaning but able to read with acceptable fluency.
o Cluster 4: Word Stumblers 18%: The students in this cluster exhibit strength in making meaning but have difficulty with word identification and fluently reading text.
o Cluster 5 & 6: Slow and Steady Comprehenders 24%: The students in this cluster are lacking in fluency but their word identification and meaning abilities are relatively strong, with meaning being the stronger.
o Cluster 7 & 8: Slow Word Callers 17%: The students in this cluster are displaying difficulties in meaning and fluency with strength being in word identification. o Cluster 9 & 10: Disabled Readers 9%: The students in this cluster are low in all
three areas and represent the smallest cluster of students.
In their reformulation, Valencia and Buly (2004) focused on the implications for classroom practice for each of the profiles based on a prototypical student in each cluster. Accordingly, the authors identified an underlying structure: there was only one cluster with students performing low in all three areas, two clusters contained students with strengths in more than one area (word identification and fluency, word identification and meaning), and the remaining profiles consisted of strengths in only one area with the other two areas as weaknesses. Each description provided an in-depth interpretation of
14
14
Page14
22 Page14
22
the profiles and their respective representations with regards to the literacy components. Through their profiles, the researchers challenged whether the one-size- fits all phonics and word-identification programs were appropriate for all students, a caution against overgeneralizing students’ needs. As schools address the needs of non-proficient students, they need to go beyond the scores of state-mandated standardized assessments to identify student instructional needs.
The work of Buly and Valencia (2002, 2004) led to other studies where researchers attempted to identify and analyze reading profiles, particularly for those students who were identified as non-proficient (Dennis, 2013; Leach et. Al, 2003;
Leseaux & Kieffer, 2010; Meyer et. al, 2013; Rupp & Leseaux, 2006; Pierce et. al, 2007). Using the work of Valencia and Buly (2002, 2004) as a template, I evaluated these
studies by examining the nature and scope of their measures, how they identified non-proficient readers, and their analytical procedures. My intent was to determine the extent to which profiles for struggling readers varied across studies and whether there was an underlying structure beneath their profiles. Table 1 below presents a comparison of the studies including the areas measured and assessments used. In this section I will review each study, in chronological order, and then provide an evaluation of their common properties and what they imply for the identification of reading profiles for struggling readers. For each study, researchers used either clusters or profiles to identify their categories. I will use the terms used by researchers when describing their results.
Leach, Scarborough, and Rescorla (2003) used eight measures of students’ word recognition fluency, vocabulary, and comprehension abilities to identify the profiles for
15
15
Page15
22 Page15
22
3rd, 4th, and 5th grade students (n=161), from both affluent and economically diverse populations, 5% of whom were minority. Splitting scores into high and low categories on each of the measures, they identified four distinct profiles:
Profile 1: (8%) Comprehension deficit/No word deficit Profile 2: (17%) Word deficit but no comprehension deficit Profile 3: (16%) Deficit in both word and comprehension Profile 4: (59%) No deficits in comprehension or word.
The profiles supported heterogeneity of reading development for these students with those students identified as late-emerging reading disabilities being balanced in their present within each profile.
Rupp and Leseaux (2006) investigated the profiles of proficient and
non-proficient 4th grade students (n=1,111). A lack of proficiency was determined based on the students’ unsuccessful scores on district mandated reading assessments. They assessed speed and accuracy for reading words; spelling; working-memory; and phonological and syntactic awareness. The researchers used factor analysis to develop high and low split scores for word-level skills, working-memory, and language skills, then grouped students into four distinct clusters representing a combination of high and low scores:
Cluster 1: (34%) Low Word, Low Memory Cluster 2: (11%) Low word, high memory Cluster 3: (16%) High word, Low memory Cluster 4: (39%) High word, High memory.
16
16
Page16
22 Page16
22
Students classified as non-proficient were unequally represented in each cluster, with the majority (76.8%) falling into cluster one.
Pierce, Katzir, Wold, and Noam (2007) evaluated urban 2nd and 3rd grade students who attended an after-school program and scored more than two-thirds of a standard deviation below the mean on one of the subtests or composite of the Test of Word Reading Efficiency (TOWRE) assessment. Using factor scores for decoding, fluency, text level skills, and vocabulary, they generated a four-cluster model using a cluster analysis:
Cluster 1: (27%) represent students with high vocabulary and decoding scores, low word and text level skill factors;
Cluster 2: (19%) represent students with high scores on word level efficiency, text level, and vocabulary factors and average decoding scores;
Cluster 3: (28%) represent students with low scores on vocabulary and at or above the mean level for decoding, word level, and text level;
Cluster 4: (26%) low in all four areas.
These profiles provided support for the idea that non-proficient readers have varied reading strengths and weaknesses.
Leseaux and Kieffer (2010) identified the literacy profiles of students in 6th grade who were language minorities and native English speakers in a low-income urban setting. The Gates-MacGinitie Reading Comprehension assessment was used to identify students who scored below the 35th percentile. Subsequent testing included vocabulary, decoding,
17
1
7
Page17
22 Page17
22
passage fluency, and working memory assessments. Using latent class analysis, three profiles were generated:
Automatic Word Callers: (18.3%) these students are characterized by above-average pseudo-word reading accuracy, substantially below-above-average vocabulary skills, and average range fluency skills;
Slow Word Callers: (60.3%) these students are characterized by above-average pseudo-word reading accuracy skills, far-below-average vocabulary skills, and low-average fluency skills; and
Globally Impaired Readers: (21.4%) these students are characterized by below-average performance on all measures.
An analysis of these profiles found that language status was not a predictor of membership in the profiles.
Dennis (2013) evaluated 6th, 7th, and 8th grade students who failed the state reading assessments the previous school year. The researcher included assessments for phonemic awareness, phonics, fluency, vocabulary, and comprehension and identified the study as a purposeful extension of the work of Valencia and Buly (2004) with a different sample. Using cluster analyses, she identified four profiles using three factors which she labelled as meaning, decoding, and rate:
Cluster 1: Slow and Steady Comprehenders (24%) These students have the highest scores in meaning with low scores in decoding and rate;
Cluster 2: Slow Word Callers (26%) These students have highest scores in decoding, with average meaning scores and low rate scores;
18
18
Page18
22 Page18
22
Cluster 3: Automatic Word Callers (24%) These students are highest in decoding, with average rate scores and low meaning scores;
Cluster 4: Struggling Word Callers (26%) These students are highest in rate, with average comprehension scores and low decoding scores.
These profiles demonstrate that non-proficient students have capabilities and areas that require intervention.
Meyer et al. (2013) evaluated 5th and 6th grade students, who were identified as non-proficient because they scored below the 50th percentile on mandated end-of-grade standardized reading tests. The authors assessed word recognition in isolation, oral reading accuracy and rate, vocabulary, and comprehension. They categorized students as high or low on each assessment area (print processing and vocabulary) to develop four profiles:
Cluster 1 (26%) These students have high scores on both print processing measures and vocabulary measures;
Cluster 2 (48%) These students scored high on print processing measure but low on vocabulary measures;
Cluster 3 (12%) These students scored low on print processing but high on vocabulary measures; and
Cluster 4 (14%) These students scored low on print processing and vocabulary measures.
Although the researchers assessed comprehension, it was not directly included as a part of the profiles generated.
19
19
Page19
22 Page19
22
Before determining the extent to which each of these studies supports the identification of a common set of profiles or an underlying structure, I examined each study to see if the same dimensions of reading performance were evaluated. For this purpose, I used the five components of reading, as identified by the National Reading Panel (NICHD, 2000). Each of these components is interrelated, thereby raising the possibility of students being strong or weak in one or more areas. While researchers have criticized the Panel for its procedures and subsequent policies regarding literacy
instruction (Allington, 2009), there is general agreement as to the importance of their components with promoting reading development. They include: (a) phonemic
awareness, (b) phonics, (c) fluency, (d) vocabulary, and (e) comprehension. A definition of each component is presented below (Learning Point Associates, 2004):
A. Phonemic awareness —an awareness of and the ability to focus and manipulate the individual sounds (phonemes) in spoken words. It includes skills such as isolating phonemes, blending onset-rimes, blending and deleting phonemes, adding and substituting phonemes, and segmenting words into phonemes. This part of reading instruction allows students to understand spoken words are made up of individual sounds.
B. Phonics —the study and use of sound/spelling relationships and syllable patterns to help students read written words. It includes skills such as
identifying letters and sounds, and blending sounds. This is a part of reading instruction that should not become a dominant component of a reading program, but a means towards the end goal of reading, comprehension.
20
20
Page20
22 Page20
22
C. Fluency —reading text with sufficient speed, accuracy and expression to support comprehension. This includes grouping words into phrases that are easier to read. A lack of fluency requires a reader to use cognitive resources for reading the words that could be used to make meaning from the text. D. Vocabulary —the body of words and their meanings that students must know
and understand to comprehend text. This includes skills such as word parts or roots and the use of context clues to gain the meaning of unknown words. In order for a student’s vocabulary to increase, they must come in contact with words outside his or her current vocabulary.
E. Comprehension —the ability to make meaning requiring specific skills and strategies, vocabulary, background knowledge and verbal reasoning skills. Comprehension includes strategies such as comprehension monitoring, asking and answering questions, using prior knowledge, and summarizing what has been read. This is the final goal of reading instruction.
Table 1 illustrates similarities and differences between the reading profile studies, only Buly and Valencia (2002) and Dennis (2013) assessed each of the National Reading Panels (NICHD, 2000) five components of reading in their identification of reading profiles. Based on their factor analysis, phonemic awareness and phonics were included under the label “word identification” (Buly & Valencia, 2002) and vocabulary and comprehension were included under the label “meaning.” For both studies, fluency or rate remained as an isolated factor. There are direct similarities between the strengths and weaknesses identified in four of Buly’s and Valencia’s (2004) profiles and those
21
21
Page21
22 Page21
22
identified by Dennis (2013). The “Disabled Readers” group (9%) was not identified by Dennis; quite possibly because she included older students, representative of multiple grades, who probably did not have low scores on her word recognition measures because such indices were designed primarily for younger students. For the profile, “Slow and Steady Comprehenders”, it is possible that these students were placed in other categories because of the nature of clustering process. Both Buly and Valencia (2004) and Dennis (2013) used the cluster analysis methodology, but there was not a consistent description across studies explaining the exact steps and criteria used to generate the profiles to determine if this could be a cause for the difference in the number of profiles generated.
22
Page22
22 Page22
22
22Comparison of Areas Assessed in Reading Literature
Buly & Valencia (2002, 2004) Leach, Scarborough, & Rescorla (2003) Rupp & Leseaux (2006) Pierce, Katzir, Wold, & Noam (2007) Leseaux & Kieffer (2010) Dennis (2013) Meyer et al. (2013) Phonemic Awareness X X X Phonics X Spelling X X X X Fluency X X X X X X Vocabulary X X X X X X Comprehension X X Working Memory
Text Skills Working Memory
X
Number of Profiles
23
23
Page23
22 Page23
22
Page23
22
While these two studies failed to identify a similar number of profiles, they do support the idea of a common underlying structure for non-proficient students. The most common underlying structures were word recognition, fluency, and meaning
(comprehension and vocabulary). Based on the nature of the sample and analytical procedures, researchers might discover additional profiles, particularly if the two components of meaning – vocabulary and comprehension—formed separate factors. A similar argument could be made if researchers evaluated the reading profiles of beginning readers and the components of word recognition – phonemic awareness and decoding— split into separate factors. Regardless, at this point, Buly and Valencia (2002) and Dennis (2013) identified multiple profiles and their findings provided an underlying structure by which educators could develop more multi-dimensional intervention programs to meet non-proficient students reading needs.
Each of the remaining studies identified different profiles based on how the authors assessed reading. For example, Leach, Scarborough, and Rescorla (2003) and Rupp and Leseaux (2006) assessed fluency, but neither study found a separate factor for this construct. Furthermore, studies by Pierce, Katzir, Wold, and Noam (2007); Leseaux & Kieffer (2010); and Meyer et al. (2013) used different assessments for comprehension and word recognition. Despite these differences in how constructs were assessed across each of these studies, an underlying structure still appeared whereby non-proficient students had difficulty with one of more of the identified areas.
After examining these studies, no one set of profiles represented all non-proficient readers; there are multiple profiles with students’ performances varying across the
24
24
Page24
22 Page24
22
Page24
22
dimensions of word recognition, meaning (vocabulary and comprehension), and fluency. There is heterogeneity within the non-proficient student classification and this finding requires the development of corresponding interventions to address the unique needs of students. What still needs to be discovered, however, is whether different motivational profiles exist among categories of non-proficient students, similar to what was discovered in reading by Buly and Valencia (2002) and Dennis (2013). This link between
motivation and reading is important because numerous studies document the critical role of motivation in understanding students’ academic performances (Mazzoni, Gambrell, & Korkeamaki, 1999). The next section will be used to evaluate existing students focused on motivation for reading.
Review of Motivation Profiles Literature
Consistent with the expectancy/value motivation theory, students’ willingness to invest time and effort in academic studies depends on their expectations for success and the perceived value of achievement (Atkinson & Feather, 1966; Eccles, J. S., et al., 1983; Heckhausen, 1977). Researchers view motivation as complex and domain specific (Paris & Turner, 1994; Wigfield, Guthrie, Tonks, & Perencevich, 2004) and a multifaceted process, inclusive of choices and beliefs (Watkins & Coffee, 2004; Wigfield, Guthrie, Tonks, & Perencevich, 2004). This process explains why students either approach or avoid a task and the reasons for their engagement or lack thereof. Thus, on a daily basis, motivation helps teachers to understand what attracts a student to start, continue, end, or avoid an activity (Graham & Taylor, 2002). It is a key factor in understanding students’ choice to read, beliefs about reading, and the value they place upon the act of reading
25
25
Page25
22 Page25
22
Page25
22
(Cambria & Guthrie, 2010; Eccles, Wigfield, & Schiefele, 1998; Schiefele, 1999). Similar to reading profile research, teachers who employ a one-size-fits-all model to promote motivation, quite possibly, fail to acknowledge its multifaceted nature, thereby ignoring the individualized needs of some students (Valencia & Buly, 2004).
Motivation researchers have used the expectancy/value theory to conceptualize approaches for understanding the non-cognitive factors impacting student achievement. One popular approach focuses on learned helplessness, defined as a lack of persistence in tasks that could realistically be mastered, usually because of a lack of effort caused by repeated failures (Luchow, Crowl & Kahn, 1985). Such behaviors are problematic because when students lack persistence, they give up, and thus have minimal chance for success. Another example is the study of anxiety. People experience high levels of anxiety when they believe that they are not competent to perform a certain behavior (Stumpf, Brief, & Hartman, 1987), which interferes with their ability to attend, thereby having a negative influence on their beliefs and efficacy for learning. Each example, learned helplessness and anxiety show how students who lack expectancies for success and do not value learning become alienated from their academic studies. This lack of engagement leads to failure and eventually to being labeled as non-proficient. While these approaches help educators to understand the behaviors and attitudes of non-proficient students, they were not specific to any particular discipline; thus, we do not know how these profiles apply to reading.
Wigfield and Guthrie (1995) used the expectancy-value theory to bridge the gap between reading and motivation research (Atkinson & Feathers, 1966; Heckhausen,
26
26
Page26
22 Page26
22
Page26
22
1977, 1991). They developed the Motivations for Reading Questionnaire (MRQ) to define and evaluate students’ expectations and values regarding their motivation for reading. Initially, this measure had 82 items, most of which were taken from Eccles’ Achievement Motivation Research Project (Eccles et. al, 1983) – ability and efficacy beliefs, subjective task values, achievement goals, intrinsic motivation, along with items related to attitudes about reading and motivation for reading.
In discussing motivation for reading, I will focus mainly on three studies. I will summarize motivation prior to returning to these studies to look at how they attempted to bridge the gap between motivation and reading. In the first study, Wigfield and Guthrie (1997) studied 4th and 5th graders across two semesters and identified 53 items and 11 constructs using the MRQ. The constructs and their definitions are presented in Table 3 (Wigfield, 1997). Using factor analysis, the researchers determined the existence of three higher order dimensions of motivation from these 11 constructs. The three dimensions are Extrinsic Motivation (social, efficacy, involvement, curiosity, recognition, and challenge), Intrinsic Motivation (Compliance, grades, recognition (Spring), and importance), and Competition and Work Avoidance (Wigfield & Guthrie, 1997). The dimensions’ structure was relatively stable across the two semesters.
In the second study, Baker and Wigfield (1999) extended the initial work of Wigfield and Guthrie (1997) by directly examining links with motivation and reading achievement, examining differences in motivation based on student characteristics, and determining what motivational profiles exist for students by using data from the MRQ, Reading Activity Inventory, Gates-MacGinitie Reading Test, Comprehensive Test of
27
27
Page27
22 Page27
22
Page27
22
Basic Skills (Standardized Assessment) and a performance assessment. They used confirmatory factor analysis of their 5th and 6th graders data to validate the identification of the 11 constructs of Wigfield and Guthrie (1997).
Cluster analysis of the MRQ placed students into seven clusters (profiles): 1. Very Low Reading Motivation (n=14, 4%) The students in this cluster are
characterized by low scores across all constructs except work avoidance, in which they scored the highest, just below the mean.
2. Low Reading Motivation (n=40, 11%) The students in this cluster had low ratings across nine constructs with the exception of work avoidance, which were the highest in this cluster. Their scores for competition were slightly below the mean. 3. Low Competition, Efficacy and Recognition (n=28, 8%) The students in this
cluster had the lowest scores in competition, efficacy and recognition and slightly below average scores for compliance with the remaining constructs having average scores.
4. Low Importance (n=28, 8%) The students in this cluster had average scores on eight constructs. Importance scores were lowest, well below the mean, and competition scores were slightly below the mean, with social scores falling just above the mean.
5. Competitive and Work Avoidant (n=80, 21%) The students in this cluster have average scores on eight constructs. Challenge scores were slightly below the mean with competition and work avoidance scores falling just above the mean.
28
28
Page28
22 Page28
22
Page28
22
6. Low Competition and Work Avoidance; High Importance and Compliance
(n=58, 15%) The students in this cluster had average scores on seven constructs. Work avoidance and competition scores fell slightly below the mean with
compliance and importance scores slightly above the mean.
7. High Reading Motivation (n=123, 33%) This cluster contained the largest percentage of students who had scores above the mean in all areas, with the exception of work avoidance that fell slightly below the mean.
These clusters underscore the heterogeneity of students’ motivation for reading as
students were somewhat evenly split among the clusters, with no cluster containing more than 33% of the sample. Students in the first two clusters, labeled very low and low reading motivation were characterized by high work avoidant scores. Students in the last two clusters Low Competition and Work Avoidance and High Reading Motivation were the opposite with low work avoidance scores. The remaining clusters varied by levels of competition, need for recognition, importance attached to reading, and efficacy. Only in one cluster, low competition and work avoidance: high importance and compliance, did students demonstrate high scores on all the positive reading indices.
In the third study, Guthrie, Coddington, and Wigfield (2009) determined that existing motivation literature lacked a specific focus on the constructs (intrinsic
motivation, avoidance, self-efficacy and perceived difficulty) that contribute to positive motivation or undermine motivation for reading. With this in mind, they wanted to capture and better understand the relationships between these constructs. They evaluated 5th grade African American and Caucasian student responses for only two of the four
29
29
Page29
22 Page29
22
Page29
22
motivation dimensions: intrinsic motivation and work avoidance to identify four profiles. Using a different analytical approach, the researchers ordered students’ scores from highest to lowest, then separated students into distinct groups of high or low by splitting the scores at the median. This approach allowed the researchers to form profiles
consisting of clear independent constructs. They identified four profiles. They included: 1. Avid (high intrinsic and low avoidance) students who have reading interests,
enjoy reading in and out of school, and do not avoid school reading.
2. Apathetic (low intrinsic and low avoidance) students who are low on intrinsic reading and avoidance of reading.
3. Ambivalent (high on intrinsic and high avoidance) students who have intrinsic motivation for some texts but not others with avoidance of reading high for some kinds of reading.
4. Averse (low intrinsic and high avoidance) students who are actively opposed to most kinds of reading and possess few reading interests.
The methodology used allowed for clearly defined profiles. Each profile contains students with either high or low scores on each of the two constructs.
Across the three studies, given the consistency with some constructs and the stability of their findings at different points of time, these results underscored the potential for the MRQ to develop specific profiles for different types of non-proficient readers. The one challenge to developing these profiles relates to the types of reading measures included or not included in these studies.
30
30
Page30
22 Page30
22
Page30
22
In the first study, Wigfield and Guthrie (1997) used the Reading Activity Inventory, a measure of the breadth and depth of students’ personal reading habits as their reading component. They used this instrument because such behaviors were a strong predictor of reading achievement. They found the social, self-efficacy, curiosity, involvement, recognition, grades, and importance constructs had the strongest
relationship to reading activity (Wigfield & Guthrie, 1997). Because this measure looked at personal reading habits instead of actual classroom performances, it is of limited use for identifying different profiles in the classroom for non-proficient readers.
In the second study, Baker and Wigfield (1999) used the Reading Activity Inventory, the Gates-MacGinitie Reading Test, the Comprehensive Test of Basic Skills (Standardized Assessment) and a researcher-developed performance assessment, where students read passages and answered open-ended questions to measure reading
performance. With personalized reading habits, the results were obvious – students who had the greatest breadth and depth with their reading habits had more positive
motivational outcomes than did students who read less widely or frequently. With the formal reading measures, no differences were found between the clusters. Finally, with the performance measure, only one difference was discovered: students in the sixth profile significantly outscored students in the other profiles.
In the third study, Guthrie, Coddington, and Wigfield (2009) used the Gates-Macginitie Reading Test, Woodcock-Johnson Fluency Test, and researcher-developed word recognition test to measure reading performance. The only finding was a positive relationship between scores on the Gates-McGinitie and intrinsic motivation for the
31
31
Page31
22 Page31
22
Page31
22
Caucasian students. No such relationship was found for the African-American/Black students.
The existing research has supported the need to understand non-proficient students from both reading and motivation for reading perspectives. What is missing is an understanding of which non-proficient students should be the focus of research. The next section will examine the research to determine which groups of students are not adequately represented and why they should be the focus of future research.
Need for Marginalized Groups
While there is evidence of a need to understand non-proficient students from both a cognitive and non-cognitive perspective, there is a need to understand specific groups of these students, particularly those students who have not performed well despite
schools’ efforts to address their needs. Au (2009) referred to students, primarily minority students with families who lack economic resources, as residing in “zipcode” schools because their geography was a better predictor of their overall achievements in public schools than any other measure of their performance. One possible explanation for this effect is the nature of our reforms to improve their performances, in that, students might need interventions that go beyond the present focus on improving word recognition abilities. As a result, I argue that we need accurate evaluations of their reading strengths and weaknesses if we are to break this cycle of underachievement for these student populations.
Since the Coleman Report in 1966, a distinguishable performance gap has been identified between Caucasian and African American students has been a concern for
32
32
Page32
22 Page32
22
Page32
22
educators, researchers, and policy makers (Clotfelter, Ladd, & Vigdor, 2009). While the term achievement gap carries many negative connotations, this term is used as this term was used by researchers to support the gap. The preferred term would be opportunity gap as this removes the deficit perspective present within the other term. As well, the
achievement gap has been noted between students from low and high socioeconomic backgrounds (Milner, 2013). This achievement gap is wide and despite numerous efforts and initiatives, continues to exist (Lee, Grigg, & Donahue, 2007). NCLB placed a strong focus on the differences in achievement by identifying equal performance requirements for each group of students that must be met each year through minimal growth
requirements. To close the performance gap for minority students, schools must provide high quality instruction (Au, 2009) and understand the performances represented in each group. Without a direct focus on understanding what reading and motivational constructs are represented in these groups, there will continue to be interventions and strategies that fail to address the needs of students from these marginalized groups. To understand the need for representation of certain students, a few questions must be answered. Is there an opportunity (achievement) gap? What specific groups are those which are truly a part of this gap?
The most recent NAEP assessment results (National Center for Education Statistics, 2015) showed a 1% point decrease (4th grade) and 2% increase (8th grade) in the percent of student scoring below proficient on this assessment since the previous assessment. Despite continued efforts at school reform via mandates, over half of our students are still unsuccessful on reading assessments. Although we see a lack of success
33
33
Page33
22 Page33
22
Page33
22
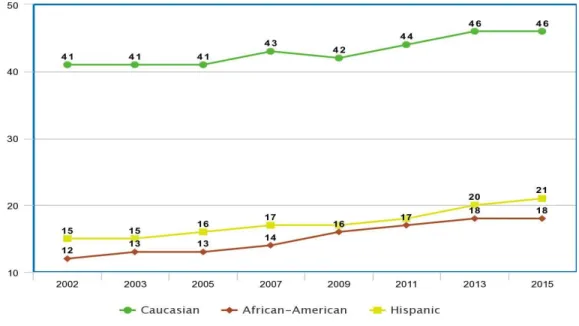
overall, there are differences in achievement for many of the groups who are identified through the NCLB legislation as marginalized groups. To visually represent the trends of performance and the gaps that exist between the marginalized and non-marginalized groups, I created the line graphs representing differences in proficiency for minority and non-minority groups. These graphs represent the fourth-grade reading proficiency performance on the NAEP from 2002, the first assessment prior to NCLB, through 2015, the latest administration of the NAEP (National Center for Education Statistics, 2015). The first graph represents the performance trends for Caucasian, African American, and Hispanic students.
Figure 1 illustrates several key accountability patterns related to ethnicity. First, there is an increase in the performance for the three groups from 2003 through the last administration in 2015. Second, while there has been an increase in performance for these three groups, the achievement gap between Caucasian students and ethnic minority students continues to exist. The achievement gap since 2002 between Caucasian and the ethnic minority groups has decreased minimally, but at no point did the performance level for African American or Hispanic students meet the baseline of Caucasian students after implementation of NCLB in 2002, Last, between the previous (2013) and current administration (2015) of the NAEP, there was no growth noted for the Caucasian nor African American groups, with a single percentage point increase for Hispanic students.
34
34
Page34
22 Page34
22
Page34
22
Figure 1. NAEP Trends Ethnicity Comparisons
Need for Economically Disadvantaged Students
Similar to the first graph, Figure 2 identifies some key accountability patterns related to economic status. First, there has been significant positive growth since 2003 for both economically advantaged and economically disadvantaged students. Second, while there has been growth noted, there is still a significant achievement gap between students representing these two economic categories. Students who are from
economically disadvantaged situations continue to perform at lower levels despite continuous legislation. At no point did students in the lower economic group match the baseline performance of the higher economic group. Last, although there is growth, students from economically disadvantaged situations are not growing at a rate
comparable to their counterparts. Economically disadvantaged students have grown a total of 6% in the 12 years since NCLB, while their counterparts have grown 10%.
35
35
Page35
22 Page35
22
Page35
22
The achievement gap from assessment data is a reality for both economically disadvantaged and African American students. Despite continuous reforms and legislation, the gap does not appear to be closing, but is larger than when initially assessed via NAEP reading assessments. Therefore, it is essential to include these marginalized populations in research to better understand their patterns of cognitive and/or non-cognitive factors. It is essential because policy effects and responses must be carefully studied to understand the impact on closing achievement gaps for marginalized groups.
36
36
Page36
22 Page36
22
Page36
22
Are These Groups Represented?
I will use this next section to evaluate some of the existing literature on non-proficient readers and motivation for reading to determine if marginalized minority students such as African American, Hispanic, and Economically Disadvantaged students were adequately represented. Although NCLB provides a direct focus on several
marginalized groups, for purposes of this study, I will place emphasis on the
representation of Ethnic Minorities and Economically Disadvantage students as these groups have shown historically wide achievement gaps with their counterparts (see NAEP graphs above).
Buly and Valencia’s (2002) work has served as a guide for many later research studies using reading profiles to understand non-proficient students. Neither of their publications adequately identified those characteristics of their students to determine if they included the previously stated populations. The sample was taken from one school district from the northwestern part of the U.S. with 57% of the students Caucasian and 43% noted as students of color. From this 43%, 11% were Hispanic and 11% were African-American. Last, 47% of the students were considered economically
disadvantaged. While this study has great implications for research and practice, it described the district’s characteristics and not the sample’s.
Leach, Scarborough, and Rescorla (2003) used eight literacy measures of students’ word recognition including fluency, vocabulary, and comprehension abilities for 3rd, 4th, and 5th grade students (n=161) with reading difficulties. The researchers split students into groups with high and low combinations of word recognition and
37
37
Page37
22 Page37
22
Page37
22
comprehension performance to identify four profiles representing the patterns of these students. While their study had a unique sample in the inclusion of students with
exceptional needs, their study did not adequately address other marginalized groups. Of the 161 students representing 12 elementary schools, only half of the schools had less than 9% of economically disadvantaged students. The other half ranged from 12 to 60% of students from economically disadvantaged households. Of the sample, 95% of the students were Caucasian, and the remaining percentage was a mix of African American, Asian, and Hispanic. When looking at marginalized groups identified from NCLB, the study did address students with special needs; however, it did not adequately represent the patterns of performance for students who are minorities nor those who are
economically disadvantaged.
Pierce, Katzir, Wolf, and Noam (2007) evaluated urban 2nd and 3rd grade students who scored more than two-thirds of a standard deviation below the mean on one of the subtests and/or composites of the Test of Word Reading Efficiency (TOWRE)
assessment. They used factor analysis and a high/low split of scores to form their four profiles. The 140 students in their study were from five schools between Phoenix and Boston. The sample was composed of 60% Hispanic and 12% African American students. There is not an adequate representation for African American students. Additionally, while researchers described the income levels of students by sharing the percentage of mothers and fathers who earned less than $35,000 a year, it was not linked to its specific populations. To interpret poverty level, readers would need to know the family size as well as specific amount of money each parent earns, therefore this
38
38
Page38
22 Page38
22
Page38
22
information will not be considered to adequately represent the economically disadvantaged NCLB group.
Leseaux and Kieffer (2010) identified the literacy profiles of students in 6th grade who were language minorities and native English speakers in a low-income urban setting. Their sample of 262 represented students from five middle schools and one elementary school where 201 were language minority students (English as a Second Language) and 61 were native English speakers. The six schools had low-income populations ranging from 44% to 100%, and 10% of the sample had special education designations. When thinking about marginalized groups, this study adequately addresses the English Language Learners (ELLs) population; however, we are unaware of the numbers of ethnic groups. The inclusion of students from economically disadvantaged populations was difficult to infer because it is not specifically identified.
Dennis (2013) evaluated 6th, 7th, and 8th grade non-proficient students who failed the state reading assessments the previous school year. The sample for the study
included 94 middle school students from four middle schools. Of those 94, 56% were Caucasian, 36% were African American, and 7% Hispanic. The percentage of students from economically disadvantaged households was 82% with 36% receiving special education services and 10% being classified as English learners. The representation of African American students was marginal, which did not provide adequate representation to understand the reading constructs present within the group. The sample does
39
39
Page39
22 Page39
22
Page39
22
represented, these findings do have some generalizability to other students from economically disadvantaged groups.
Meyer et al. (2013) evaluated 5th and 6th grade students who were identified as non-proficient on a mandated end-of-grade standardized reading tests. The sample was barely described in detail in that 65 students were from a rural, small school system with a total of 1,800 K-12 students. No information related to ethnicity or socio-economic status was included.
The motivation studies did not provide adequate descriptions of the sample. Baker and Wigfield (1999) included a sample of 371 students from five schools from a large mid-Atlantic U.S. city. They did not have ethnicity and income level information for 75 students due to a school removing itself prior to the final data collection. For the sample information known, 52% were Caucasian, 46% were African American, and 54% were economically disadvantaged. Additionally, they did not explain the percentage of economically disadvantaged within the sample. Guthrie, Coddington, and Wigfield (2009) included 245 5th grade students from three schools in a mid-Atlantic state. The sample was 76% Caucasian, 24% African American, and 10% received special education services. No information was reported to describe the income status of the participants. Wigfield and Guthrie (1997) sample was 70% Caucasian and 30% African American students and the income status was not reported.
While each of these studies added pertinent information to the literature in their respective areas, do they adequately represent the marginalized groups who have been identified as non-proficient students? The answer is somewhat. There were positive and
40
40
Page40
22 Page40
22
Page40
22
negative implications from existing literature. First, the studies have some adequate representation of students from some marginalized groups, including special needs, Hispanic students, ELLs and economically disadvantage students. While these groups were represented, they were inconsistent in their representation. Second, within several studies, there was a failure to identify the specific sample or to make a general reference to the population. This limits knowledge of who the actual sample included. Next, with the exception of one study, the others all included samples representative of three or more schools (with some of these schools not having high percentages of minority or
economically disadvantaged populations). The schools included lacked a high minority or low-income population. Last, with all of the studies, there was not an adequate representation of African American students.
Recommendations
While these studies supported the notion of non-proficient students in reading demonstrating variability in their motivational profiles, there are several caveats regarding what needs to be accomplished in order to more accurately identify the underlying dimensions of non-proficient readers’ motivational profiles. The following recommendations are related to identification of these inclusive profiles.
First, based on its use in existing research studies, the MRQ is the best measure to use when assessing the motivational profiles of non-proficient elementary grade students. With the complexity of motivation, it needs to be assessed with instruments that are specific to the content area of reading and age/grade appropriate. The MRQ encompasses a holistic representation of a student’s motivational dimensions for reading through its