ScholarWorks
Walden Dissertations and Doctoral Studies Walden Dissertations and Doctoral StudiesCollection
2015
Educators' Perceptions of High-Stakes Testing in
Low and High Poverty Schools
Natasha Marie Domond
Walden University
Follow this and additional works at:https://scholarworks.waldenu.edu/dissertations Part of theEducational Psychology Commons, and thePsychology Commons
This Dissertation is brought to you for free and open access by the Walden Dissertations and Doctoral Studies Collection at ScholarWorks. It has been accepted for inclusion in Walden Dissertations and Doctoral Studies by an authorized administrator of ScholarWorks. For more information, please [email protected].
Walden University
College of Social and Behavioral SciencesThis is to certify that the doctoral dissertation by Natasha Domond
has been found to be complete and satisfactory in all respects, and that any and all revisions required by
the review committee have been made. Review Committee
Dr. Sandra Caramela-Miller, Committee Chairperson, Psychology Faculty Dr. Joseph Rocchio, Committee Member, Psychology Faculty Dr. Donna Heretick, University Reviewer, Psychology Faculty
Chief Academic Officer Eric Riedel, Ph.D.
Walden University 2015
Educators’ Perceptions of High-Stakes Testing in Low and High Poverty Schools by
Natasha M. Domond
EdS, Florida A&M University, 2007 MS, Florida A&M University, 2006
Dissertation Submitted in Partial Fulfillment of the Requirements for the Degree of
Doctor of Philosophy Psychology
Walden University November 2015
Since the development and implementation of the No Child Left Behind Act (NCLB) of 2002, educators have received pressure from local, state, and federal policyholders for students to achieve academically and for schools to make adequate yearly progress to avoid state and federal sanctions. The purpose of this study was to examine educators’ perceptions of the effects of high-stakes testing and the accountability policies in high poverty and low poverty schools. The theoretical frameworks were conservation of resources theory, jobs demands-resources model, and job autonomy and control theory. Research questions focused on understanding educators’ perception of high-stakes testing regarding curricula, instructional practices, available instructional support, and job
satisfaction. A cross-sectional, quasi-experimental design was used to obtain both quantitative and qualitative with a sample of 200 teachers and 6 principals, respectively. To investigate the differences in responses between teachers, a two-way factorial analysis of variance was used. Quantitative findings indicated that teachers in lower poverty schools had a lower perception when it came to the curricula, instructional method, and instructional support. Teachers in lower poverty schools expressed higher job
satisfaction. Qualitative findings showed that principals felt that the Georgia Professional Standards teaches how to pass the test and does not give students the opportunity to apply what is learned. These findings illuminate the role of poverty in high-stakes testing and accountability policies; they also assist policymakers and stakeholders in identifying supports needed to ensure that all children succeed.
by
Natasha M. Domond
EdS, Florida A&M University, 2007 MS, Florida A&M University, 2006
Dissertation Submitted in Partial Fulfillment of the Requirements for the Degree of
Doctor of Philosophy Psychology
Walden University November 2015
I would like to dedicate my research to all of the educators, mentors, and support staff who work extremely hard in making sure all students live up to their optimal potential. The passion and commitment do not go unnoticed. You may not hear it all the time, but just know you are sincerely appreciated.
First and foremost, I would like to thank God for seeing me through and helping me make my dreams possible. I would also like to thank my chair, Dr. Caramela-Miller; committee member, Dr. Rocchio; and my University Research Reviewer (URR), Dr. Heretick for the words of encouragement and suggestions during this doctoral writing process. This process has not been an easy road, but given Dr. Caramela-Miller’s
guidance and motivation to continue, I was able to get through this process. For this, I am forever grateful.
I would also like to thank the educators who have helped me develop and pushed me to think in-depth about my research and the direction I should go. I would also like to thank the principals who gave me the opportunity to include their school in my research and participate in the interviews.
A special thank you goes to my family, friends, editors and colleagues (Lindsey, Antonya, Dr. Etienne, Kia, Joshua, Dr. Trimble and Dr. Jacobs) for being there
continuously and for being supportive over the years. My son, Darius, selflessly gave up mommy time in order for me to write and rewrite drafts. Darius is my primary source of motivation to complete my dissertation and to continue to strive to make a better life for him. I am forever grateful to all those at whatever organization and to everyone else I did not mention who contributed in some fashion to the successful completion of this
i
List of Tables ... v
List of Figures ... vii
Chapter 1 ... 1
Introduction ... 1
Background of the Study ...3
Problem Statement ...9
Purpose of the Study ...10
Research Questions and Hypotheses ...11
Theoretical Framework for the Study ...15
Nature of the Study ...17
Definitions ...18
Assumptions ...22
Scope and Delimitations ...22
Limitations ...23
Significance ...23
Summary ...24
ii
Literature Search Strategy ...26
Theoretical Foundation and Conceptual Framework ...27
Literature Review Related to Key Variables and/or Concepts ...30
Summary and Conclusions ...54
Chapter 3 ... 56
Introduction ...56
Research Design and Rationale ...56
Research Questions and Hypotheses ...57
Methodology ...61 Threats to Validity ...68 Summary ...80 Chapter 4 ... 82 Introduction ...82 Data Collection ...82
Summary and Transiton ...133
iii
Interpretation of Findings ...137
Limitation of Study ...143
Recommendations ...144
Implications for Social Change ...145
Conclusion ...146
References ... 147
Appendix A: Teacher Demographic Questions ... 166
Appendix B: Teacher Paper/Pencil Survey Instrument ... 167
Appendix C: Job Satisfaction Scale- Paper/Pencil Survey ... 171
Appendix D: Teacher Computer Survey Instrument ... 175
Appendix E: Job Satisfaction Scale-Computer Survey ... 179
Appendix F: Principal Paper/Pencil Survey Instrument ... 183
Appendix G: Principal Computer Survey Instrument ... 188
Appendix H: Teacher Consent Form ... 190
Appendix I: Principal Consent Form ... 192
Appendix J: Teacher Advance Notice Letter ... 194
Appendix K: Principal Advance Notice Letter ... 195
iv
v
Table 1. Planned Sample Size………... ... 62
Table 2. Assessing the Variables……… ... 72
Table 3. Frequency and Percentages for Participants’ Demographics ... 84
Table 4. Reliability……….. ... 85
Table 5. Descriptives for Key Variables (N = 196) ... 87
Table 6. Between Subjects Effects for Perception of Curriculum ... 88
Table 7. Perception of Curriculum Means for Main Effects and Interactions ... 89
Table 8. Between Subjects Effects for Perception of Instructional Methods ... 94
Table 9. Perception of Instructional Methods Means for Main Effects and Interactions . 95 Table 10. Between Subjects Effects for Perception of Instructional Support ... 100
Table 11. Perception of Instructional Support Means for Main Effects and Interaction. 100 Table 12. Between Subjects Effects for Job Satisfaction ... 104
Table 13. Job Satisfaction Means for Main Effects and Interactions ... 104
Table 14. Definitions of Themes for Research Question 9 ... 107
Table 15. Frequency of Themes for Research Question 9 ... 108
Table 16. Frequency of Themes for Research Question 9 for Low and High Poverty School……….. ... 112
Table 17. Definitions of Themes for Research Question 10 ... 113
Table 18. Frequency of Themes for Research Question 10 ... 113
Table 19. Frequency of Themes for Research Question 10 for Low and High Poverty Schools………. ... 121
vi
Table 21. Frequency of Themes for Research Question 11 ... 122 Table 22. Frequency of Themes for Research Question 11 for Low and High Poverty Schools……….. ... 128 Table 23. Definitions of Themes for Research Question 12 ... 128 Table 24. Frequency of Themes for Research Question 12 ... 129 Table 25. Frequency of Themes for Research Question 12 for Low and High Poverty Schools………. ... 133
vii
Figure 1: Plotted means for perception of curriculum by subject taught. ... 90
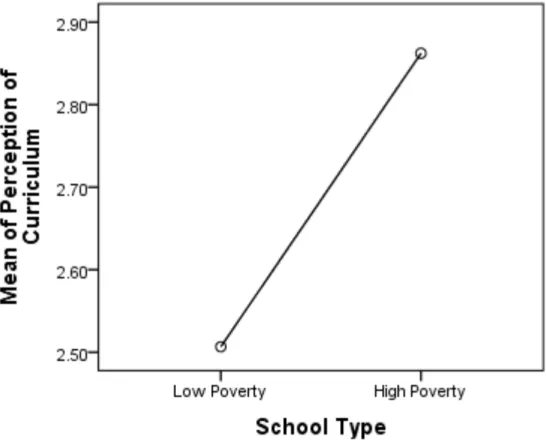
Figure 2: Plotted means for perception of curriculum by school type. ... 91
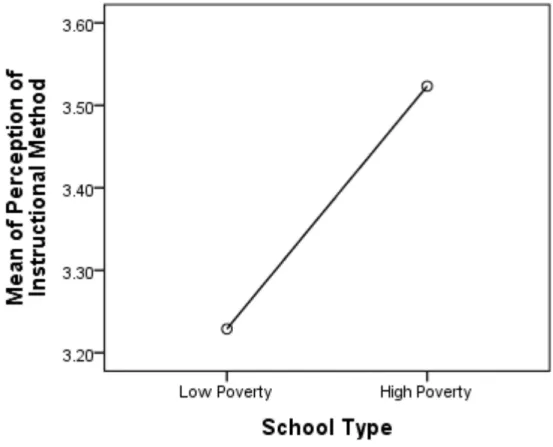
Figure 3: Plotted means for perception of curriculum by subject taught and school type.92 Figure 4: Plotted means for perception of instructional method by school type. ... 96
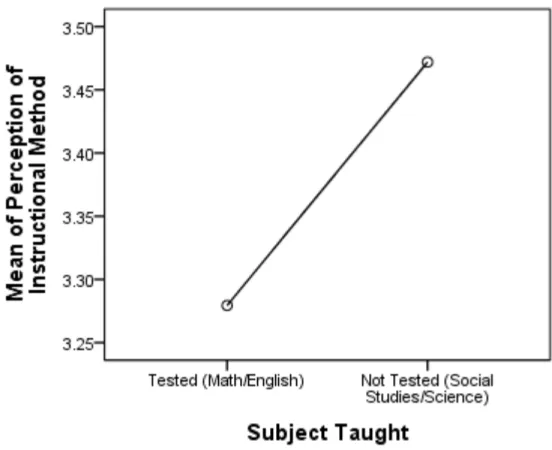
Figure 5: Plotted means for perception of instructional method by subject taught. ... 97
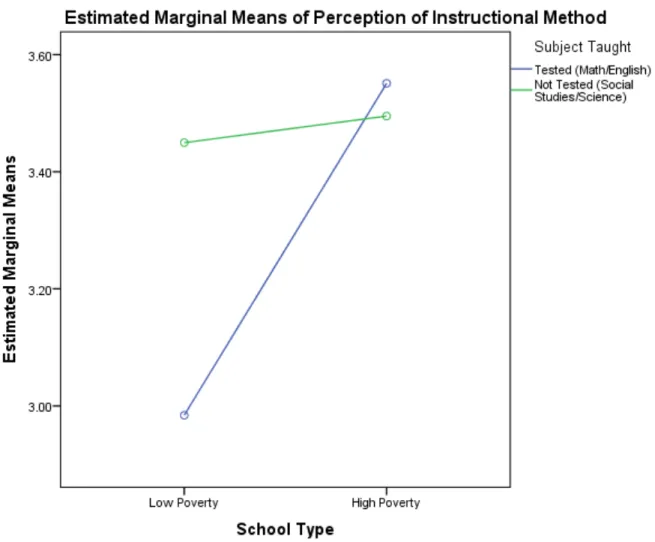
Figure 6: Plotted means for perception of instructional method by subject taught and school type. ... 98
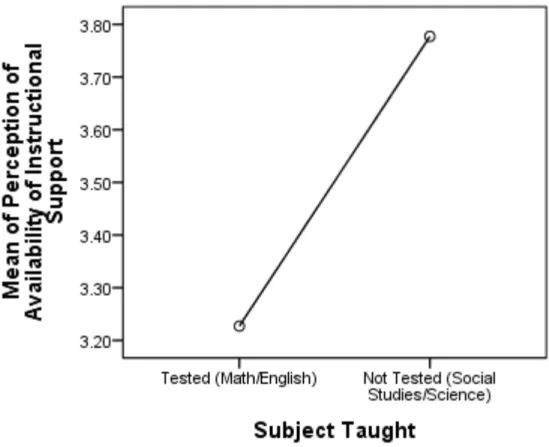
Figure 7: Plotted means for perception of instructional support by subject taught. ... 101
Figure 8: Plotted means for perception of instructional support by school type. ... 102
Chapter 1 Introduction
There is an achievement gap between students from different socioeconomic and racial backgrounds in primary and secondary educational institutions. For approximately 40 years, researchers have been mindful of the significant discrepancy in academic achievement between children who live in lower poverty communities and children who reside in higher poverty communities (Kellow & Jones, 2008). There are several reasons for these discrepancies,
including the lack of available resources, such as books and materials, the educators’ inadequate level of preparation, the amount of training obtained, environmental factors, family factors, and low expectations (Waber, Gerber, Turcios, Wagner, & Forbes, 2006). Children from socially disadvantaged backgrounds perform poorer than children who have more advantage (Waber et al., 2008).
In an effort to close the achievement gap, policymakers at both federal and state levels have incorporated high-stakes testing (HST) and accountability measures. Although there have been provisional acts to decrease the achievement gaps at the state level, it was not until 2001 that federal policies incorporated the No Child Left Behind Act (NCLB, 2002) in order to offer punishments and rewards to school districts, schools, and teachers based on the performance of the students. In order for this particular southeastern state to meet adequate yearly progress (AYP), the state used performance standards to provide educators with clear expectations for the implementation of instruction, assessment, and student work. According to the state’s
department of education, the performance standards provide specific guidelines on what students should know and master. Assessments measure these skills and knowledge sets to determine
how well students are able to manipulate learned information.). In order to assess these
standards, this southeastern state established a HST, designed to measure the students’ skills and knowledge as outlined in the performance standards. The HST assessment provides academic achievement status on multiple levels, which includes student, school, system, and state levels. According to the state’s department of education, HST scores reveal the students’ strengths and weaknesses in order to offer appropriate instructional interventions, according to the
performance standards.
I designed this study to examine the effects of a southeastern state’s test-based,
accountability system, that is, the performance standards and the HST. More specifically, the study examined the educators’ perception of high-stakes testing on the curricula, instructional method, availability of instructional supports, and the job satisfaction in the school environment. Collectively, the information gained through analyzing the educators’ perception of test-based accountability policies served to develop an understanding of the experiences of those in the high and low poverty level secondary schools. Although there are numerous studies comparing testing and accountability, few researchers have evaluated the relationship between these factors to schools on different poverty levels.
In this introductory chapter, I provide background information focused on federal and state-level accountability policies, as well as the involved issues and their impact. I then discuss the purpose of the research and the research questions. I also discuss the four factors examined and provide an overview of the proposed methodology.
Background of the Study Background on NCLB
In January 2001, President George W. Bush affirmed his intention to amend the federal Elementary and Secondary Education Act (1965). The intention was to enrich the public education system for every child, from every background, in every part of America (United States Department of Education, 2004a). One year later, President Bush signed into law the NCLB Act (2002). The foundation of the NCLB accountability system is the requirement that every school must make AYP, as measured by the performance of the students on the high-stakes tests taken each year.
Students are required to exemplify academic achievement progress in the areas of math and reading beginning in Grade 3 throughout high school. The scores of the high-stakes tests must improve yearly for the school to avoid any sanctions. The score reports present the results in percentage form, depicting the prevalence of students who meet the state required goal in each subject and grade level. Furthermore, each state must determine whether all schools and districts have made AYP by evaluating the percentage rates of students who have met the test score goals, the number of test participants, the number of high school graduates, and the additional measure of attendance for elementary and middle school students. No Child Left Behind stresses
accountability for all students. Therefore, schools are required to measure AYP for several subgroups, including English language learners (ELL), special education students, students from all levels of socioeconomic status (SES), and races or ethnicities (NCLB, 2002).
After two years in need of improvement status (NCLB, 2002), a school faces a series of sanctions. During the first year of not meeting standards, known as the school improvement
phase, the district must provide the option to parents to transfer their child to another public school that made AYP, including public charter schools. The failing school must also submit a school improvement plan. Then, the local educational agency serving the failing school is required to provide technical assistance and is specifically tasked with identifying and addressing problems regarding providing instructional support, analyzing data from assessments, reviewing students’ work, and exploring parental involvement (NCLB, 2002).
According to NCLB, if the school does not make AYP for another year, the impending sanctions will include those previously noted and the requirement for the provision of
supplemental services. Furthermore, the longer period of time a school has the failing school status, the more imposing the sanctions will become. After the fifth year of not making AYP, the local educational agency must implement one of several alternatives, such as reopen the school as a public charter school, implement a new curriculum, or extend the school year or school day. There is also a requirement that each state and district issue report cards with statewide and school-by-school data for all school districts. The primary goal of NCLB (2002) is for all students to meet grade level expectations by the year 2014.
Background on a Southeastern State’s Implementation of NCLB
The NCLB (2002) places a significant emphasis on increasing academic achievement for all students, regardless of ethnicity, race, socioeconomic status (SES), limited English
proficiency, or students with disabilities on the local, state, and federal levels. The federal government instructed all states to establish state academic standards and a testing protocol aligned with the federal guidelines (NCLB, 2002). The United States Department of Education
approved this southeastern state’s final revision of the state accountability policy on June 7, 2004.
Revising and aligning the current Quality Core Curriculum (QCC) into a new curriculum, referred to as the state’s performance standards, was the initial step made during the modification process of adapting the NCLB policy. In 2008, the department of education in a southeastern region proposed that the state’s curriculum lacked substance, did not meet national standards, and was impossible to complete in 12 years of education. Further, this ambiguous nature of the QCC forced teachers to assume the nature and characteristics of the required teaching and
instruction, thereby not really knowing exactly how these students should be prepared to undergo the testing. According to the department of education in a southeastern region, teachers used the curriculum as a form of reference rather than as a guide to provide quality instruction.
The southeastern state’s department of education explained that the establishment of the state’s performance standards was a product of the audit, comparing national standards from other high achieving states and counties, with a gain in expertise from teachers, state and national professionals, and consultants. The department of education in a southeastern region also stated that the premise of the state’s performance standards is to provide teachers with explicit guidance in terms of their expectations of students, more in-depth standards for content, and the implementation of teachers’ best practices. The department of education also noted that the previous QCC based the HST on the current state’s performance standards.
According to the southeastern state’s department of education, as a measurement for AYP, the middle schools utilize the HST. Students who are in the special education program also used the state’s alternate assessment. To ensure that all students are performing adequately
by 2014 the state’s department of education will increase the Annual Measurable Objectives (AMO) every year in math and reading for all students regardless of subgroups categories. Another revision required that all teachers be highly qualified in the content areas of certification (United States Department of Education: Office of Elementary and Secondary Education, 2008).
This southeastern state incorporated three criteria in order for schools to meet AYP. All public schools must meet the established AMO, including all subgroups of students in the areas of mathematics, reading, and English/language arts on the HST, according to the state’s
department of education. Secondly, in the core subject areas, at least 95% of each subgroup must take the test. In addition, each school must decide on a second criterion, including
attendance, meeting standards on the science or social science portion of the HST or the writing assessment, or receive a percentage that exceeds HST standards in the areas of mathematics, English/language arts, science, or social studies. The state’s department of education provides alternative ways for schools to make AYP, which include confidence interval, multiyear
averaging, direct comparison of students’ performance between the HST and AMO, safe harbor, and federal flexibility for schools that did not make AYP due to the students with disabilities.
In an effort for parents to make informed decisions about students’ school placement and supplemental services, the southeastern region department of education guarantees that scores be reported for the HST and the state’s alternate assessment in a timely manner. This is important because it provides the schools with the opportunity to develop and implement the school improvement plan, provides public school choice, and provides supplemental or instructional extension services, all of which are mandated by the NCLB policy.
This southeastern state recently developed a set of core standards in English/language arts and mathematics for grades kindergarten through Grade 12. As a result, the Common Core State Standards (CCSS) were established and released on June 2, 2010. According to the state’s department of education, the premise of the CCSS is to prepare students for success in college and 21st century careers. In other words, the goal of CCSS is to provide students with the skills necessary to become successful in college and in their careers, which is consistent with the expectations across colleges and careers from other states, and requires higher order thinking so that learned materials are relevant. In addition, according to the southeastern state’s department of education, the CCSS was the next step from the state’s performance standards. The timeline for implementation of the CCSS in the classrooms was during the 2012-2013 school year. The focus of this research study was primarily on the state’s performance standards.
While there are volumes of research comparing testing and accountability, few
researchers have evaluated the relationship between these factors to schools on different poverty levels. There are even fewer studies focused on secondary schools. Previous researchers have focused on high poverty schools without comparisons to low poverty schools. They also focused on a small sample size of different poverty level schools (Sunderman & Mickelson, 2000;
Sunderman, Tracey, Kim, & Orfield, 2004).
Previous researchers have found that various poverty levels have significantly more influence on children’s academic performance in school than on management, operations, and policies of the schools (Burney & Beilke, 2008; Cuthrell, Stapleton, & Ledford, 2010). Poverty level is a strong indicator of academic success for children. Students who are in low poverty schools are more likely to perform better than those who are in the high poverty schools (Choi,
Seltzer, Herman, & Yamashiro, 2004). Everson and Millsap (2004) found there is a strong correlation between students living in poverty and standardized achievement scores among high school students.
Focusing on the consequences of high-stakes testing does not provide a comprehensive understanding of its effects; therefore, this research examined effects between two distinct contexts of low and high poverty schools. According to Aud et al. (2011), high poverty schools are public schools where more than 75% of the students are eligible for the free or reduced-price lunch (FRPL). Aud et al. also defined low poverty schools as schools with 25% or fewer
students eligible for FRPL. Furthermore, the percentage of students eligible for the FRPL program provides an indicator for the concentration of low-income students within a school.
I designed this research to focus on the middle school level (Grades 6-8) for several reasons. The first reason is that primary schools have been the site for most test-based accountability practices. In Chapter 2, I discussed previous research with well-represented middle schools. Hamilton et al. (2007) further demonstrated that educators’ responses were general across all grade levels. However, the discrepancy between grade levels was not specific and the sampling did not exclusively include middle schools.
Further, teachers in the middle schools present instruction in specialty content areas, whereas elementary school teachers teach all of the required subjects. Focusing on middle schools would allow me the unique opportunity to examine the relationship between those who teach the tested subjects (reading, English/language arts, and mathematics) and those who teach the nontested subjects (social studies, science). In addition, middle school teachers typically have a greater number of students per class when compared to elementary school teachers
(Wells, 2010). Middle school teachers teach the same subject over several periods during the day, which are approximately five classes with 30 to 35 students in each class. Wells (2010) noted that elementary school teachers have the same limited number of pupils, perhaps in the same room, the majority of the day. Therefore, middle school teachers who teach tested subjects are responsible for ensuring students perform satisfactorily on high-stakes testing.
The third reason for focusing on middle schools is because it is likely for test scores to decrease as the grade level increases, middle school educators may be under greater pressure in terms of testing and accountability policies. Previous test score data, from the past several years in the school district selected for this proposed research, revealed the percentage of students who performed on Level 3, the exceeds standards level, were consistently lower in eighth grade than in elementary grades. For example, Reading test scores from of 2009 to 2010 revealed 13% more third grade students fell in the exceeds standards range when compared to eighth grade students (Wells, 2010).
There was varied performance between elementary and middle schools. In schools that historically scored poorly, middle school educators are more likely to allocate a majority of their efforts to making AYP. In additional, middle school teachers feel more pressure due to an overemphasis of high-stakes testing.
Problem Statement
At both the state and federal levels, high-stakes testing and accountability policies have been implemented to reduce the academic achievement gap and increase opportunities for
children who attend high poverty schools. No Child Left Behind (2002) places accountability on educators to meet AYP in the various schools, regardless of a particular school’s poverty level,
and this requirement continues to be a challenge. Ingersoll (2004) suggested a social expectation that high poverty schools perform commensurate with low poverty schools. However, those students in the high poverty schools may score academically and motivationally lower than their counterparts, and may have fewer resources and limited parental involvement (Ingersoll, 2004). In addition, due to the high emphasis on testing, many teachers perceive their working conditions as being less favorable than in the past. Given the stress of HST, it heightens job pressures and reduces professional satisfaction (Darling-Hammond, 2004; Hale-Jinks, Knopf, & Kemple, 2006; Ingersoll, 2004). It is important to understand how educators respond to the accountability policies related to student performance, from the perspective of both teachers and principals in both high and low poverty schools. As a result, researchers have not focused extensively on how testing and accountability relates to different poverty levels of schools.
Purpose of the Study
The purpose of the study was to examine a group of teachers who teach in low and high poverty schools and their perception of the testing accountability policy. Specifically, I focused on the different perceptions of middle school teachers in the areas of curricula, available
resources, instructional method, and job satisfaction. I assessed the differences using
instruments designed to compare the impact of accountability, developed by Vogler (2008), and to measure level of job satisfaction. Additionally, the purpose of this qualitative study was to examine the perception of principals in high and low poverty schools. Principals completed open-ended questions to describe their perception of the current curricula in their schools, instructional methods, available resources, and job satisfaction.
Research Questions and Hypotheses
Individual schools may respond differently to high-stakes testing and accountability policies, depending on the poverty level of the school. As a result, I divided the research questions for this study in four groups. These groups consisted of middle school teachers and principals from both high and low poverty schools. The contextual factors for each group were curricula, instructional methods, available instructional support, and job satisfaction.
Research Question 1 (Quantitative)
Are there group differences between middle school teachers from low and high poverty schools regarding perception of curricula?
Null Hypothesis (H01):There will be no group differences between middle school teachers from low and high poverty schools regarding the current curricula.
Alternative Hypothesis (H11): There will be group differences between middle school teachers from low and high poverty schools regarding the current curricula.
Research Question 2 (Quantitative)
Are there group differences between middle school teachers from low and high poverty schools regarding perception of instructional methods?
Null Hypothesis (H02):There will be no group differences between middle school teachers from low and high poverty schools regarding the current instructional method.
Alternative Hypothesis (H12): There will be group differences between middle school teachers from low and high poverty schools regarding the current instructional method.
Research Question 3 (Quantitative)
Are there are group differences between middle school teachers from low and high poverty schools regarding perception of availability of instructional support?
Null Hypothesis (H03):There will be no group differences between middle school teachers from low and high poverty schools regarding the availability of instructional support.
Alternative Hypothesis (H13):There will be group differences between middle school teachers from low and high poverty schools regarding the availability of instructional support. Research Question 4 (Quantitative)
Are there group differences between middle school teachers from low and high poverty schools regarding perception of job satisfaction?
Null Hypothesis (H04):There will be no group differences between middle school teachers from low and high poverty schools regarding their level of job satisfaction.
Alternative Hypothesis (H14): There will be group differences between middle school teachers from low and high poverty schools regarding their level of job satisfaction. Research Question 5 (Quantitative)
Are there group differences between middle school teachers who teach tested subjects and teachers who teach non-tested subjects regarding perception of curricula?
Null Hypothesis (H05):There will be no group differences between middle school teachers who teach tested subjects and teachers who teach nontested subjects regarding the current curricula.
Alternative Hypothesis (H15): There will be group differences between middle school teachers who teach tested subjects and teachers who teach nontested subjects regarding the current curricula.
Research Question 6 (Quantitative)
Are there group differences between middle school teachers who teach tested subjects and teachers who teach non-tested subjects regarding perception of instructional method?
Null Hypothesis (H06):There will be no group differences between middle school teachers who teach tested subjects and teachers who teach nontested subjects regarding the current instructional method.
Alternative Hypothesis (H16): There will be group differences between middle school teachers who teach tested subjects and teachers who teach non-tested subjects regarding the current instructional method.
Research Question 7 (Quantitative)
Are there group differences between middle school teachers who teach tested subjects and teachers who teach non-tested subjects regarding perception of instructional support?
Null Hypothesis (H07):There will be no group differences between middle school teachers who teach tested subjects and teachers who teach nontested subjects regarding the current instructional support.
Alternative Hypothesis (H17): There will be group differences between middle school teachers who teach tested subjects and teachers who teach nontested subjects regarding the current instructional support.
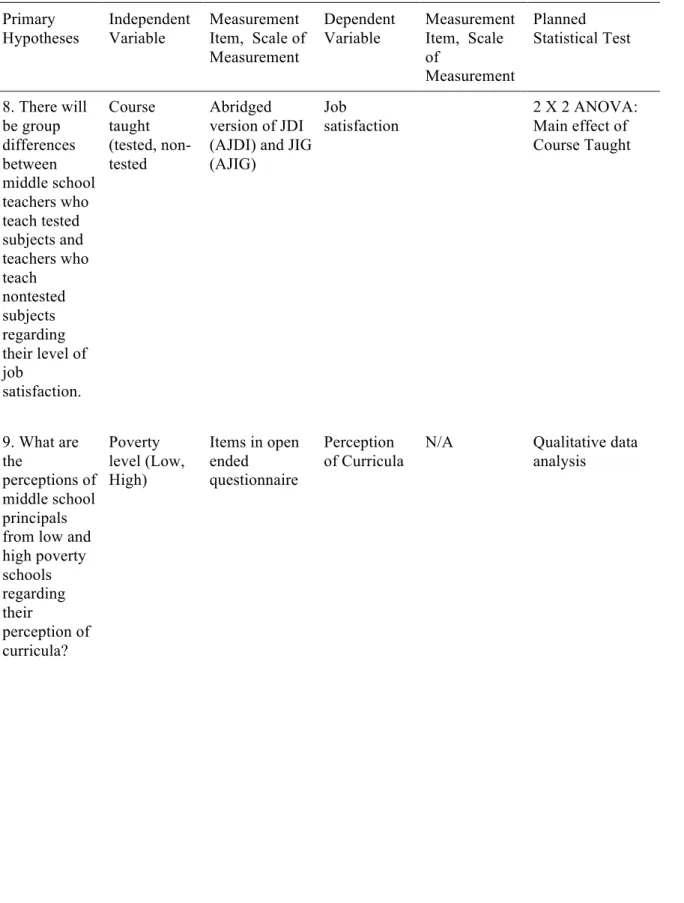
Research Question 8 (Quantitative)
Are there group differences between middle school teachers who teach tested subjects and teachers who teach nontested subjects regarding perception of job satisfaction?
Null Hypothesis (H08):There will be no group differences between middle school teachers who teach tested subjects and teachers who teach nontested subjects regarding their level of job satisfaction.
Alternative Hypothesis (H18): There will be group differences between middle school teachers who teach tested subjects and teachers who teach nontested subjects regarding their level of job satisfaction.
Research Question 9 (Qualitative)
What are the perceptions of middle school principals from low and high poverty schools regarding their perception of curricula?
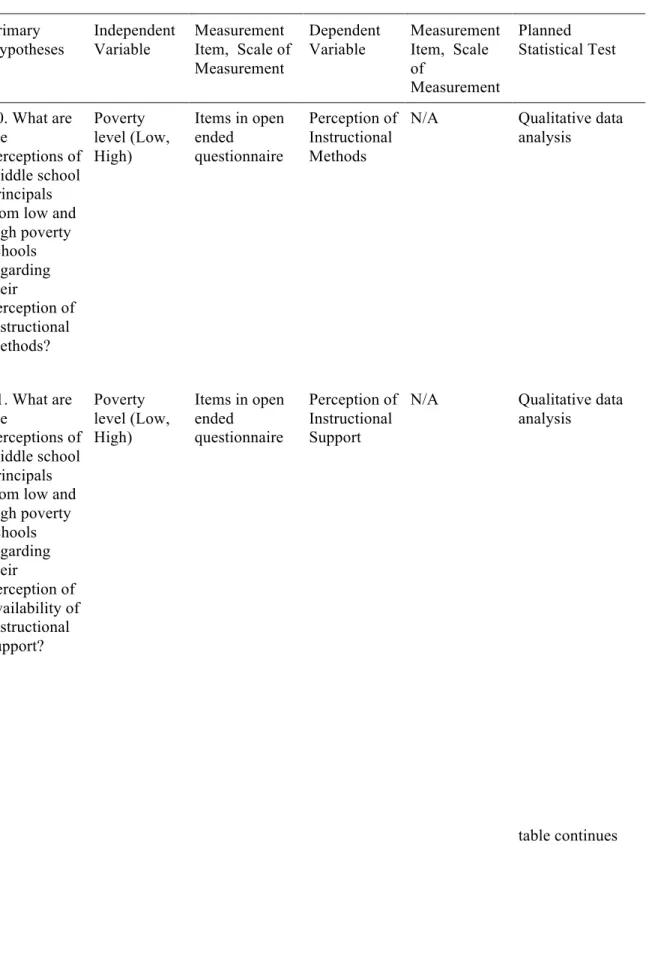
Research Question 10 (Qualitative)
What are the perceptions of middle school principals from low and high poverty schools regarding their perception of instructional methods?
Research Question 11 (Qualitative)
What are the perceptions of middle school principals from low and high poverty schools regarding their perception of availability of instructional support?
Research Question 12 (Qualitative)
What are the perceptions of middle school principals from low and high poverty schools regarding their perception of availability of job satisfaction?
Theoretical Framework for the Study
The conservation of resources theory (COR) is a foundational theory that may assist in understanding why lost resources have a greater impact on job satisfaction than gained resources (Hobfoll, 1989, 2001). The jobs demands-resources (JD-R) Model was also utilized, which describes that individuals can avoid the negative effects of stress if adequate resources are available (Hakanen, Bakker, & Schaufeli, 2006). Lastly, job autonomy and control makes teachers more satisfied (Pearson & Moomow, 2005).
The JD-R Model assists in understanding teachers’ stress. This model serves to explain if resources are available to meet the high demands of NCLB accountability policies, then teachers will experience low levels of stress and burnout. Consequently, job demand alone does not result in stress or burnout if the resources are available to meet those demands. The JD-R Model consists of two broad categories, which are job demands and job resources. Job demand relates to different facets of a job, which involve physical, social, psychological or organizational stability (Demerouti, Bakker, Nachreiner, & Schaufeli, 2001). Researchers have found higher job demand occurs when there are high expectations of teachers (Hakanen, et al., 2006). In this research, there was an examination of work overload in efforts to describe educators’
psychological pressure (Skaalvik & Skaalvik, 2009).
The JD-R Model also describes characteristics of a job, which involve physical, social, psychological, and organizational stability, in relation to reducing job demands and its
relationship with psychological and physiological costs, efficiency in accomplishing work goals, and opportunities to encourage personal growth, learning, and development. For that reason, job resources are not only important for teachers to become self-sufficient and to be able to cope
with job demands but also it serve as teachers’ independence (Hakanen, et al., 2006). Researchers have found that there is a strong correlation between lack of resources and the increase of educators’ burnout. The relationship between high demands/lack of job resources to burnout/lack of worker engagement is a description of the JD-R model. This research study focused on job control (Taris, Schreurs, & Van Iersel-Van Silfhout, 2001) and supervisory support (Coladarci, 1992; Leiter & Maslach, 1988; Rosenholtz & Simpson, 1990).
The demand-control model, also known as the job strain model, describes autonomy and control established by Scandinavian researchers in the late 1970s (Karasek, 1979; Karasek, Baker, Marxer, Ahlbom, & Theorell, 1981; Karasek & Theorell, 1990). Job demands, such as workload, deadline, and decision latitude, including autonomy and control, are factors that explain job strain (Guglielmi & Tatrow, 1998). The relationship between these two factors can either predict positive or negative correlations to job strain. For example, the higher the decision control and the lower job demands, then the lower the amount of psychological strain. Whereas, the lower the decision control and the higher the job demands, the greater the psychological strain. Lowering job demands while increasing control can reduce job stress (Guglielmi & Tatrow, 1998). This study specifically focused on the amount of control and the high job demands involved in incorporating a specific curriculum and instructional methods in order to meet the state’s performance standards.
Within the demand-control model, teacher autonomy is one characteristic of teacher motivation related to job satisfaction (Pearson & Moomba, 2005). Researchers found that teachers decide to remain in the teaching profession to preserve autonomy in the classroom (Brunetti, 2001). Furthermore, teacher motivation and autonomy relate to both job satisfaction
and job stress (Davis & Wilson, 2000; Pearson & Hall, 1993). The more intrinsically motivated, the more satisfied the teachers were in their jobs and the less stress they experienced (Davis & Wilson, 2000). Subsequently, several other studies found constraints on autonomy, such as perceived lack of control and sense of powerlessness, are associated to tension, frustration, and anxiety among teachers (Bacharach, Bauer, & Conely, 1986; Blasé & Matthews, 1984; Cedoline, 1982; Dinham & Scott, 1992; Dworkin, Haney, Dworkin, & Telschow, 1990; Evers, 1987; Lortie, 1975; Natale, 1993; Woods, 1989; & Yee, 1991).
This research also focused on available resources. Therefore, I used the COR theory to describe three circumstances in which psychological pressure occurs. Hakanen et al. (2006) found that these three circumstances are when resources are in jeopardy, resources lost, and investments made and no reciprocation of those resources is given. The idea of loss of resources is more significant than the opportunity of gaining resources. In other words, employees are less effective in working situations where they feel they have lost resources. Hakanen et al. also explained, according to the COR theory, this energetic process is considered as a loss process that is expected to be more important than the gain process. Furthermore, it is important to understand, which poor job resources are directly related to burnout and obliquely related to low levels of work engagement.
Nature of the Study
This research uses a single-stage, cross-sectional quantitative survey design. Educators completed a self-administered questionnaire with both closed and open-ended questions to determine the effect of the independent variable, high and low poverty schools, on the dependent variable, curricula, instructional practices, available instructional support, and job satisfaction. I
used the survey design to provide detailed information and economical and timely data collection (Creswell, 2003). In Chapter 3, I further described the methodology.
Definitions
Academic learning time: Academic learning time is a portion of allocated time in a subject area in which a student is actively engaged in the activities or with the learning material being used in the classroom, and in which those activities and learning materials are aligned with the objective of the lesson (Fisher et al., 1980).
Adequate yearly progress (AYP): A term established by the No Child Left Behind
legislation, which is a measurement used to determine whether a school system or school campus has satisfactorily made academic achievement progress when relative to those of annual
measurable objectives. The state government labels a school as not making AYP if the school fails to demonstrate the established percentage of students meeting or exceeding standards in math and reading/language arts (NCLB, 2002).
Allocated time (scheduled time). Allocated time refers to the number of minutes
allocated for teaching (Carroll, 1963). Allocated time also includes the amount of time that the state, district, school, or teacher provides the student for instruction (Berliner, 1990).
Behaviorist instructional method: The behaviorist instructional method emphasizes a teacher-centered approach in the classrooms, in which the teacher is the transmitter of knowledge to the student. Specific observable behaviors are for assessments. For example, lecture,
questions with one correct answer, rote drill and practice, recitation, and independent student practice are the behaviorist instructional method approach (Ornstein & Hunkins, 2009).
Burnout: Burnout is considered a syndrome of exhaustion, cynicism, and reduced professional efficacy (Maslach, Jackson, & Leiter, 1996).
Constructivist instructional methods: The constructivist instructional method approach is when the teacher becomes the facilitator in a student-centered classroom. The student have the opportunity to develop his/her knowledge based on discoveries or understandings obtained through focused learning experiences. Examples of this approach in the learning environment are open-ended discussion, student-initiated questions, problem solving, inquiry,
experimentation, cooperative learning, and individual student and group reflection (Mayer, 2004).
Curriculum: Teachers uses curriculum to teach students intended and unintended information, skills, and attitudes (Sowell, 2000). For the purpose of this study, the pacing of curricula, the standardization of curricula and the time of allocation across subjects.
High poverty schools: High poverty schools are public schools that have more than 75% of the students who are eligible for the free or reduced-price lunch ([FRPL] Aud et al., 2011).
High-stakes testing: High-stakes testing (HST) is considered to be “the use of
standardized testing measures as criteria for determining the quality of schools, promotion of children to the next grade, high school graduation, teacher bonuses, or the governance of a school” (Gunzenhauser, 2003, pp. 52-53); “testing with substantial consequences for educators or students” (Koretz, 2002a, p. 753).
Instructional method: Instructional method is “the elements included in instruction for supporting the achievement of the learning objective" (Reiser & Dempsey, .p. 314).
Instructional support: Instructional support programs are those many and varied efforts to intervene when learning difficulties become apparent (Walmsley & Allington, 1995). For the purpose of this study, instructional support and resources available to teachers in order to
improve academic success and to meet AYP, such as shifting instructional resources from non-tested subjects to non-tested subjects (Ladd & Zelli, 2002). Other examples include providing additional opportunities for professional development (Rouse et al., 2007); reducing class size (Goldhaber & Hannaway, 2004); providing additional instructional staff (i.e., classroom aides) (Stecher & Chun, 2001); and increasing the proportion of school spending devoted to instruction (Chiang, 2009).
Instructional time: Instructional time is considered allocated minutes per class period that is designated to teach student specific knowledge, concepts, and skills aligned with the
curriculum, which does not include time spent during downtime, transition time, non-instructional activities, etc. (Anderson, 1983; Aronson et al., 1998).
Job satisfaction: Job satisfaction is “a pleasurable or positive emotional state resulting from the appraisal of one’s job or job experiences” (Locke, 1976, p. 1304).
Low poverty schools: Low Poverty Schools are public schools with 25% or fewer students eligible for free or reduced-price lunch (FRPL; Aud et al., 2011).
Middle school: According to the state’s department of education, middle school is a school that consist of grades six, seven and eight; usually 11-15 year-old students.
No Child Left Behind of 2001 (NCLB): On January 8, 2002, President Bush signed the No Child Left Behind Act of 2001 (NCLB) that reauthorized the Elementary and Secondary
and schools, in that all students have to meet or exceed state standards in reading and mathematics within twelve years (NCLB, 2002).
Pacing of curricula: Pacing of curricula is “the speed with which students move through the material to be learned” (Broghy, 1979, pg 736).
Perception: Perception is gaining an intelligent interest in the values of human beings; understanding or insight into people or objects (Winker, 1988).
Performance level: According to the state’s department of education, a range of scores that defines a specific level of performance, as articulated in the Performance Level Descriptors. The HST has three performance levels: 1) Does Not Meet the Standard (650-799), 2) Meets the Standard (800-849), and 3) Exceeds the Standard (850-950). In essence, the performance level provides more meaning to the scale score.
School Improvement Plan: A document developed by a school and approved by the LEA to serve as a blueprint for guiding the school’s continuous improvement and progress toward identified student achievement objectives and targets (NCLB, 2002).
Standardization of curricula: In 1983, in order to guarantee that the students are learning the same knowledge and academic skills, regardless of the school or district in which they reside, the public education in the United States adopted a neoliberal approach, which mandated the states to align the components of the high-stakes tests with the instructional standards (Hursh 2007).
State’s performance standards: According to the state’s department of education, the state’s performance standards provide clear expectations for assessment, instruction, and student work. They define the level of work necessary for a student to accomplish in order to master the
standards. Performance standards incorporate content standards but expand upon them by providing suggested sample tasks, sample student work, and teacher commentary.
Teacher autonomy: The perception teachers have regarding whether they control themselves and their work environment (Pearson & Hall, 1993).
Time: Time is the degree to which students have enough time to learn the material taught (Carroll, 1963; Slavin, 1994).
Assumptions
For the purpose of this study, there were three assumptions. The first assumption was that the environment of accountability established by the NCLB of 2001 would be continuing in future education legislation. The second assumption was that the southeastern state would continue to use the HST in order to measure students’ academic achievement set forth by state’s performance standards. Finally, I assumed that the participants would respond honestly to the interview questions.
Scope and Delimitations
The major delimitation of this study was the participants and the time used for this study. I purposely selected participants from six middle schools in a public school district located in a large suburban school district in a southeastern state. The middle schools selected demonstrated a high or low poverty level of the school’s student population. The timeframe expected for collecting data involved several months during the school year, during the summer and during the new school year. I was the primary person collecting data for this study.
Limitations
Merriam (1998) proposed limitations in relations to the research design of a case study research. A limitation of this case study research was the potential for bias, which might be a factor in this study. I worked at another school in the same school district where the conducted study took place and might have a professional relationship with some of the participants in the study. Chapter 3 addressed the issue of potential bias in the sections titled: Threats to Data Quality and Ethical Issues. Another limitation was the generalizability of the research. It is unfeasible to generalize a small sample size to all public middle schools.
Significance
The significance of the study provides an understanding of the potential differential effects of testing and accountability policies on low and high poverty schools and the issue of test-based accountability in secondary schools. Unfortunately, due to high demands, teachers and administrators are resorting to other measures, such as changing students’ answers on the HST, in order to meet AYP. It is important to understand the effects of test-based accountability measures and the way teachers respond within the classrooms when they are attempting to apply accountability policies appropriately (Hamilton et al., 2007).
Gaining information on principals’ and teachers’ perspectives on high-stakes testing concerning curricula, instructional methods, available instructional support, and job satisfaction will provide administrators on the school, district, state and federal levels with valuable
information to support educators. As a result, teachers’ morale will increase while teacher retention will decrease. This will decrease the academic achievement gap among students.
Summary
In Chapter 1, I introduced this study as well as background information concerning the educators’ perception of the NCLB of 2001 accountability policies. I included information about the current instructional issues that educators face in order to meet AYP for these students. I explained the purpose of this study, which was to explore the principals’ and teachers’ perception of available resources, administrative support, instructional methods, and job satisfaction in the middle school setting. The chapter included the theoretical frameworks for this study, which entails COR (Hobfoll, 1989, 2001), JD-R (Hakanen, Bakker, & Schaufeli, 2006), and job autonomy and control (Pearson & Moomow, 2005). In addition, I presented definition of terms, assumptions, and limitations for this study. Lastly, I described the
significance of this study in relation to positive social change concerning educators’ ability to become effective in order to implement NCLB in Chapter 1.
In Chapter 2, I included a review of the literature related to this study. The introduction describes the major sections of the review and organizational structure. In addition, the search strategies used for this literature review. Major research studies related to this topic are described, as well as major themes found in the literature. The summary and conclusion
discussed the gaps and deficiencies in the prior research, as well as the placement of this study in the body of the literature. In Chapter 3, I included the research design and approach of these variables, instruments used to measure these variables, setting and sample of the participants, measures of ethical protection, and data collection and analysis. In Chapter 4, I included the time frame for data collection and recruitment procedures, the discrepancy in data collection, demographic data, external validity, and the reliability of the study. The results and the summary
of these results were also included. In Chapter 5, I will further summarize the finding of this research. In addition, I will delve into the social change implications of this study as well as the applications for psychologists and educators. I will discuss the limitations of this study in further detail and describe the recommendations for further research relevant to strengths gleaned from the current study.
Chapter 2 Introduction
The NCLB policy reform act created a paradigm shift in education, which placed great emphasis on accountability and high-stakes testing (Heller, 2005). The NCLB (2001) policy premise is to ensure all students are receiving quality education as measured by statewide testing. The increasing demand for accountability also increased the need for standards-based reform and high-stakes testing (Hamilton et al., 2008). This reform placed great pressure on the school, district, and federal level to ensure schools meet AYP to avoid sanctions.
Literature Search Strategy
In exploring the impact of testing and accountability policies and the analytical
framework, I used a variety of keywords. This literature review included, but is not limited to, journal articles contained within the academic databases of PsycINFO, PsycARTICLES,
PsycBOOKS, Psychology: a SAGE full-text database, ERIC, Education Research Complete, and Education: a SAGE full-text database. Keywords and phrases used in the database search
included high-stakes testing, poverty, minority and instructional methods, socioeconomic status, NCLB and stress, retention and NCLB, accountability and NCLB, urban and NCLB, job
autonomy and control, open system, stress and accountability, and poverty level and NCLB. This comprehensive and systematic search method assisted in identifying the historical foundation, gaps in the current literature, and need for further research comparing testing and accountability policies in low- and high-poverty middle schools.
In the following paragraphs, I examine the conceptual framework, the role of testing and accountability in NCLB, and the influences in high- and low-poverty level schools. The chapter
includes a comprehensive review of the literature relating to how the accountability policies influence the curriculum, instructional methods, availability of instructional support, and job satisfaction. The review also examines the impact of high-stakes testing and accountability policies on schools, the influence of poverty level on implementation of local-level policies, educators’ perception of NCLB, and the methodological review.
Theoretical Foundation and Conceptual Framework
The conceptual framework of the effect of NCLB centers on the educators’ perception and change of action in order to increase test scores and to make AYP. Due to the demands of NCLB, teachers must have the resources to assure that students receive adequate instruction. The job demand-resources (JD-R) model describes two ways in which working conditions can affect the employees’ health. One way is the excessive amount of stressors from a job in which employees are unable to adapt accordingly (Bakker, Demerouti, Hakanen, & Xanthopoulou, 2007). For example, the high degree of physical, social, or organizational demands of NCLB requires educators to apply themselves physically and/or mentally, which may cause
physiological and/or psychological stress, such as burn out and job satisfaction (Bakker et al., 2007; Hockey, 1997). Meijman and Mulder (1998) explained job demands are not essentially harmful to an educator’s well-being; however, job can be stressful when employees are unable to recover from difficulties situations or cope appropriately given their employers’ expectations. For instance, the state should prepare teachers with materials and resource for trying to ensure their students are prepared to take and pass statewide tests. They may feel stressed if they do not have reliable resources and materials even though the expectation is that their students will perform adequately when compared to their peers at other schools where resources are readily available.
Another aspect of the JD-R model is the resources that employees receive in order to satisfy or meet the accountability demands. According to Demerouti et al. (2001), job resources are available in multiple forms, such as physical, psychological, social, or organizational
elements. These resources can help teachers address the physical and psychological stress of meeting educational goals and encourage professional, personal, or learning development. For example, these resources can include salary, administrative support, autonomy, control, and educators’ skills and performance (Bakker et al., 2007). Resources, such as supervisory support, influences teachers’ job satisfaction and burnout, in that if teachers feel as though their
administrators are supportive and they are there to assist them, then teachers may feel some level of satisfaction. Leiter and Harvie (1997, 1998) examined employees who have a sense of
fairness and supportiveness from their supervisors and found that they are less likely to experience burnout and be more accepting of significant changes. On the other hand, not providing resources may lead to withdrawal from responsibilities and lack of motivation and commitment (Bakker, Demerouti, & Schaufeli, 2003). This will be detrimental to students’ achievement in the classroom, which will also affect student performance on high-stakes testing and ultimately the schools’ meeting AYP.
In order to understand how vital resources are to educators in meeting federal demands, it is important to understand the conservation of resources theory (COR; Hobfoll, 1989, 2002). Hobfoll explained that individuals try to acquire, preserve, and guard possessions that are valuable, whether materialistically, personally, socially, and/or energetically. Individuals may experience stress if their jobs are threatened or if individuals’ resources deleted (Hobfoll, 1989, 2002). For example, a decline in funding for programs and resources, such as instructional
materials, salary, professional development, and available training, may affect teachers’ job satisfaction. The decrease in any of these programs and/or resources will have some effect on students’ performance.
Policy makers in the U.S. Department of Education set the standards of NCLB policy on the federal level in which states, school districts and schools must adhere too. These demands may affect principals’ and teachers’ autonomy and control. Therefore, the framework that conceptualizes this aspect is the job autonomy and control. In order to have an efficient
organization, it is important to provide employees with autonomy and allow them to be included in the decision-making process (Ozturk, 2011). In an education reform shift, such as the
accountability policy act, teachers’ autonomy is encouraged (Ozturk, 2011). Pearson and Moomaw (2006) further explain that in order to solve the current dilemma with the schools, administrators should concede autonomy and give teachers’ power. Relinquishing creative power to teachers gives them the opportunity to have effective decision-making control in planning educational instructions, methods, curriculum, and materials (Pearson & Moomaw, 2006). Encouraging teacher autonomy has many beneficial factors. It will give teachers some ownership in implementing measures in order for students to perform adequately, which will also affect job satisfaction. Acknowledging the teachers’ professional expertise and giving them the power to take more control, guarantees that their responsibly and job role will be accomplished appropriately (Ozturk, 2011).
Literature Review Related to Key Variables and Concepts Effects of School Poverty Level
In 2001, the premise of NCLB was to close the achievement gap among students and to hold schools accountable. As a result, in order to fulfill the demands of NCLB, educators were no longer paying attention to the overall environmental circumstances of students; instead, they placed more emphasis on making AYP (Darling-Hammond, 2004). For example, NCLB does not seem to consider significantly academically delayed children and the academic impact of the poverty line on students (Darling-Hammond, 2004). In other words, having a clear
understanding of influencing factors that may impede students’ performance will give educators the opportunity to address those needs, as opposed to solely focusing on test scores. Therefore, meeting the high expectations set by NCLB may be a challenge due to the increased focus on test scores as a measure of school and teacher performance (Darling-Hammond, 2004).
In terms of research that focuses on the effects of test-based, accountably policies and schools’ poverty level, Moon, Callahan, and Tomlinson (2003) examined the differences between the instructional methods of teachers in high poverty schools and those in low poverty schools. Researchers found that testing accountability greatly influence instruction regardless of the poverty level of the school. In other words, teachers from both environments dedicated a majority of the class time reviewing and practicing the questions of the test until the
administration of the test. However, other researchers found conflicting evidence. Wallace (2002) researched the differences of instructional methods among a high poverty and low poverty elementary schools in Texas. Wallace found that teachers in the high poverty schools focused more on the test when compared to low poverty schools. McNeil and Valenzuela (2001)
also found that as opposed to teachers challenging students intellectually, teachers in the high poverty schools placed higher emphasis on teaching to the test. Not only does poverty level have some influence on teaching methods, but it also influences the percentage of minorities in a given school
Several studies examined schools with a proportion of minority students. In New Jersey, Firestone et al. (2002) surveyed 300 fourth-grade teachers and found that, test preparation practices were used more often in districts where more than 60% of the students were minorities found that, districts where more than 60% of the students were minorities, used test preparation practices more often. Kim and Sunderman (2004), Madaus and Clarke (2001), McNeil and Valenzuela (2001), and Williams et al. (2005) obtained similar results on predominantly minority schools.
Studies also examine the difference between instructional practices among urban and suburban schools. One study found that, in urban schools in Massachusetts, teaching to the test is more evident than in suburban schools (Luna & Turner, 2001). Furthermore, Pedulla et al. (2003) examined responses from educators concerning their perspective on testing and
accountability policies. They concluded that the majority of classroom time in the urban schools focused on preparing for the test and the instruction guided by the test. Meanwhile, suburban schools’ instructional methods focused on the curriculum and not the test.
Poverty Level and the Implementation of Accountability Policy on School
Historically, the implementation of a new reform on the school level, such as the NCLB policy, affected schools differently, especially schools that are considered high-poverty schools. The ineffectiveness of a policy is a product of ambiguity and lack of knowledge on how to
implement these policies in schools that are low performing and high-poverty. For example, in 1976, McLaughlin found the guidelines and the intent of the law for the funds in the Title I mandated programs were unclear, which led to both appropriate and inappropriate uses of the funds. In other words, the content of the policy is not the deciding factor of whether the policy will be effective; rather, it is the implementation of the policy and detriments in high-poverty schools when compared to a low-poverty school due to the special needs of the school. Due to the federal guidelines not being clear for local use, the interpretation of the program was inconsistent throughout the local level. Another historical example of the correlation of school reform to the quality of implementation on a local level offered in a study conducted by Berman and McLaughlin (1978) in the 1970s called the RAND Change Agent Study. Berman and McLaughlin showed that the expectation of the school reform should be consistent across both local, district, and school level in order for the implementation to be successful. A recent study by Borman in 2005 described this same phenomenon.
It is important to understand the various factors to consider when implementing high-stakes testing policies in a high-poverty school. Several researchers found that there are different challenges and needs depending on the level of poverty of the students, as well as the
communities, in which there are high-poverty schools (Darling-Hammond, 2004; Esch et al., 2005; Horng, 2009). These challenges may interfere with applying accountability measures, such as curricula, teaching instructions, and availability of resources in order to increase students’ performance level. In addition, the turnover rate is high among highly qualified teachers from high-poverty schools when compared to low-poverty schools (Clotfelter, Ladd, & Vigdor, 2005; Jackson, 2008; NCES, 2005; McCabe, 2008). Due to the different circumstances
and the challenges, high poverty schools may respond to policy change and school reform differently, often, because of the quality of their teachers and the relative clarity or ambiguity of the implementation process.
Although the premise of the NCLB accountability act is to improve students’ academic success by narrowing the achievement gap, to facilitate high performance learning culture through rigorous curricula, and to improve graduation rates, the implementation of a new policy is challenging, depending on the poverty level of the school. These challenges not only affect students but also educators. If teachers’ perceptions of the students are negative, then their perception of the school climate will be negative as well, especially since teachers are change agents within the schools (Gehrke, 2005). According to a longitudinal study conducted by Mistry et al. (2009), when teachers have high expectations of their students, especially students considered academically at-risk, then their expectations have a positive influence on academic achievement outcomes of the students. It is important to understand how poverty level produces different outcomes and has an influence on schools’ ability to implement federal policies
effectively. This is the reason this proposed research focuses on the differences of educators’ responses between low and high poverty schools.
High-Stakes Testing and Accountability Policies on Schools
This review examines factors, such as curricula, instructional methods, available instructional support, and job satisfaction. These four factors influence educators’ perception, given the pressures of the accountability policies. In terms of curricula, researchers have shown that schools made provisions due to accountability policies, such as allocating additional time on tested subjects, as opposed to non- tested subjects, and aligning the curriculum and standards
according to the tested subjects (Faulkner & Cook, 2006; McGuire, 2007; Schemo, 2007; Watanabe, 2007). Research has also shown that educators alter the instructional methods, such as increasing emphasis on tested subjects and pacing of the curriculum, in order to prepare students for the test (Berryhill et al., 2009; Brown & Clift, 2010). Instructional support and resources for low performing schools may depend on the distribution of support throughout a school district, as well as for a particular school (Bacolod et al., 2009; Chiang, 2009; Goldhaber & Hannaway, 2004; Rouse et al., 2007). Furthermore, on the school level, researchers have found that educators modify the school’s environment, such as allocating additional instructional resource from non-tested subjects to tested subjects (McGuire, 2007; Schemo, 2007). Schools also provides additional professional development to educators (Rouse et al., 2007) and reduce class sizes (Goldhaber & Hannaway, 2004). Due to responses of accountability policies, schools also increase the spending on resources such as instruction and instructional material (Chiang, 2009). It is important to understand how the accountability measures have influenced these factors. Educators make provisions in order to meet state standards requirement and to increase student performance.
Job satisfaction is also an area affected due to accountability policy pressures. Educators reported adverse job satisfaction due to the additional pressure in order to meet AYP (Crocco & Costigan, 2007; Jackson, 2008; Leithwood et al., 2010). These pressures include educators feeling as though they are not valued and respected professional educators; there are extreme high expectations to improve low-performing students’ achievement level; and there is ambiguity of which instructional approach to use in order to improve achievement level.
Impact on Curriculum
Time allocation across subjects. When evaluating the effects of testing accountability policies, it is important to understand the influences of subject areas not considered for the promotion or retention of the child. In other words, in this southeastern state, in order to retain or promote an eighth grade student, the student must pass the reading and math portion of the HST. The social studies and science portions are also given; however, they are not promotional subjects. Because of these expectations, teachers and administrators modifies instructional time in order to focus on those tested subject areas.
According to Eisner (1994), a null curriculum refers to contents not taught in schools either intentionally or by disregard, although the level of importance is the same. For example, researchers have found that test-based accountability guides the curriculum by restricting the focus on non- promotional subject areas and emphasizing an increased focus on those areas monitored for AYP (Faulkner & Cook, 2006; Watanabe, 2007). Schemo (2007) and McGuire (2007) both stated that there is an adverse impact on non-tested subject because of limited attention and instructional time given as compared to tested subjected areas. In fact, these subject areas are nonexistent at some schools. These modifications to the instructional time are an effort to increase students’ test scores and to focus on students who require supplemental instruction.
According to a recent report from the Center for Education Policy, McMurrer (2007) noted significant differential educational outcomes for students concerning the narrowing of the curriculum. In terms of allocation of instructional time, four significant changes occurred since the 2001-2002 school year in which 62% of the schools noted that they allocated more time in