Education policy issues in Turkey
Mehmet Alper Dinçer
Submitted in partial fulfillment of the requirements for the degree of
Doctor of Philosophy under the Executive Committee of the Graduate School of Arts and Sciences
COLUMBIA UNIVERSITY 2013
© 2013
Mehmet Alper Dinçer All rights reserved
ABSTRACT
Education Policy Issues in Turkey Mehmet Alper Dinçer
Since the mid-1990s, public education provision in Turkey has been in constant transformation, a result of modernization efforts connected to the political determination of governments to
complete Turkey’s accession to the European Union. During this period two nation-wide reforms stand out due to their dramatic impact on children, students, teachers and the education system as a whole. First, the Compulsory Education Law enacted in 1997 required that all the children enrolled in grade 4 or lower must stay in school until the completion of the eighth grade. Second, in 2002, the Ministry of National Education (MONE) abandoned recruiting teachers based on lottery and started to use teachers’ test scores instead. Following new legislation, the Center of Measurement, Selection and Placement (ÖSYM) launched a central examination process which is known as the Public Servant Selection Examination (KPSS).
This dissertation provides an econometric evaluation of the impact of these interventions on education outcomes in Turkey. The dissertation seeks to establish a causal link between the enactment of KPSS and student achievement. It presents evidence indicating that teacher recruitment via a meritocratic, test-based assessment instead of a lottery may have a positive impact on student achievement. The research also shows that the increase in the average student achievement displayed by Turkey in international assessments such as PISA (Programme of International Student Assessment) and TIMSS (Trends in International Mathematics and Science Study) may be partially explained by the inception of KPSS.
The identification strategy for this assessment is based on the fact that the TIMMS data includes information on teachers and test scores for each student sampled in Turkey in both1999 and 2007, that is, before and after KPSS was enacted in 2002. This allows the estimation of a difference-in-differences model with student fixed effects. The findings highlight that students whose teachers were recruited after the enactment of KPSS perform 0.2 standard deviations higher than their counterparts whose teachers were recruited before the enactment of KPSS. This finding remains stable in several sensitivity and robustness checks.
The dissertation then turns to analyzing an earlier intervention, the Compulsory Education Law of 1997. The research estimates the impact of the Compulsory Education Law on the years of schooling of women aged between 18 and 29. For this purpose, the dissertation uses the Turkey Demographic Health Survey 2003 and 2008. The identification strategy is based on the fact that, first, cohorts born after 1986 (children enrolled in grade 4 in the1996-1997 school year and later) were subject to the Compulsory Education Law and earlier cohorts were not, and, second, the intensity of the intervention varied between regions. Hence the investigation exploited the between-cohort and between-region variation in intensity of the intervention to estimate the causal impact of the Compulsory Education Law on years of schooling. The findings suggest that the Compulsory Education Law led to a 34 percentage point increase in the probability of
completing eight years of schooling and an additional 1.5 years of schooling. Also, the econometric results indicate that the Compulsory Education Law affected high school completion rates, i.e. eleven years of schooling.
The analysis of the impact of the Compulsory Education Law is extended to a two-stage least-squares (TSLS) estimation of the impact of completing eight years of schooling/additional years of schooling on teenage marriage and fertility. The between-cohort and between-region variation
in intensity of the intervention are used to instrument completing eight years of schooling and additional years of schooling. However, in contrast with the existing research on this issue in Turkey, these TSLS estimations did not supply any evidence in favor of the presence of a causal link between completing eight years of schooling/additional years of schooling and teenage marriage and fertility.
i TABLE OF CONTENTS LIST OF FIGURES ... v LIST OF TABLES...vii ACKNOWLEDGEMENTS ... ix CHAPTER 1. INTRODUCTION ... 1
CHAPTER 2. THE EDUCATION SYSTEM IN TURKEY ... 4
I. Organization ... 4
II. Curriculum and instructional time ... 7
III. Access... 9
A. Pre-primary level ... 9
B. Primary and lower secondary levels ... 10
C. Upper secondary education ... 14
IV. Quality ... 15
A. Pre-primary level ... 15
B. Quality of basic education (primary, lower secondary and upper secondary levels) .. 17
V. Conclusion ... 31
CHAPTER 3. TEACHER SELECTION AND EFFECTIVENESS IN TURKEY: TEACHER TESTING AND QUALITY... 33
ii
A. Hypotheses explaining rising student achievement ... 39
II. Review of the Literature ... 42
A. Variation in teacher effectiveness... 43
B. What explains variation in teacher effectiveness? ... 44
III. Teacher selection regimes in Turkey ... 47
A. Overview of the teacher labor market in Turkey ... 47
B. The legal framework for teacher selection in Turkey ... 52
IV. Data and descriptive information ... 54
V. Identification Strategy ... 57
VI. Findings ... 61
A. Sub-group analysis: Female teachers ... 62
B. Sub-group analysis: Male teachers ... 62
C. Sub-group: Students with scores below the mean ... 63
VII. Robustness ... 63 A. Student-teacher sorting ... 64 B. A Time-variant factor ... 65 VIII. Discussion ... 66 IX. Conclusion ... 69 X. Tables ... 71 A. Estimation Results ... 71
iii
CHAPTER 4. EDUCATIONAL ATTAINMENT AND TIMING OF MARRIAGE AND
FERTILITY: EVIDENCE FROM TURKEY ... 78
I. Introduction ... 78
II. Relevant studies utilizing quasi-experimental methods ... 81
III. Background information ... 85
A. Population change in developing countries ... 85
B. Marriage and fertility in Turkey ... 88
C. Compulsory Education Law ... 90
IV. Data and methodology ... 92
A. Data... 92
B. Identification strategy ... 94
V. First stage analysis... 102
A. Construction of treatment/control groups ... 102
B. Impact of Compulsory Education on different levels of education ... 106
C. First stage estimation results ... 108
VI. Reduced form, ordinary least squares (OLS) and two-stage least square (TSLS) estimations ... 114
VII. Conclusions ... 117
VIII. Tables ... 120
iv
CHAPTER 5. CONCLUSIONS AND IMPLICATIONS ... 138
I. Concluding remarks and policy implications ... 138
II. Shortcomings and future research ... 143
v
LIST OF FIGURES
Figure 1: Student population and net enrollment rate at pre-primary level ... 9
Figure 2: Access to pre-primary education by SES status and urban/rural location ... 10
Figure 3: Net enrollment rate, primary education ... 11
Figure 4: Administrative records vs. survey based computation of net enrollment rates ... 12
Figure 5: Unexcused student absenteeism (%, 2007-2010) ... 13
Figure 6: Regulated minimum outdoor space requirement in square meters per child ... 16
Figure 7: Index of quality of pre-primary education ... 17
Figure 8: Average scale scores in reading comprehension (PIRLS, 2001)... 19
Figure 9: Percentage of 8th graders in Turkey by TIMSS science achievement benchmarks... 22
Figure 10: Percentage of 8th graders in Turkey by TIMSS mathematics achievement benchmarks ... 23
Figure 11: Percentage of students at the different levels of mathematics proficiency ... 24
Figure 12: Percentage of students at the different levels of science proficiency... 25
Figure 13: Percentage of students at the different levels of reading proficiency ... 26
Figure 14: Variation in reading performance between schools (expressed as a percentage of the variance in student performance across OECD countries) ... 27
Figure 15: Variation in reading performance explained by schools’ socio-economic background (expressed as a percentage of the variance in student performance across OECD countries) ... 28
Figure 16: Value added estimates of program types ... 30
Figure 17: Achievements of students in Turkey, TIMSS 1999 and 2007 ... 35
Figure 18: Score point change in mathematics between 2003 and 2009, PISA ... 36
vi
Figure 20: Percentage of students below proficiency level 2, mathematics, PISA 2003 and 2009
... 37
Figure 21: Percentage of students below proficiency level 2, science, PISA 2006 and 2009 ... 38
Figure 22: The number of open positions and applicants by subject ... 49
Figure 23: Ratio of salary after 15 years of experience to GDP per capita ... 50
Figure 24: Average teacher wage-experience profile in Turkey ... 51
Figure 25: Percentage distribution of ever-married women by age groups, 1978-2008 ... 89
Figure 26: Age specific fertility rates (per 1000 women, 1978-2008) ... 90
Figure 27: Number of students in public primary schools (grades 1 -5, 1996-1997 school year) . 95 Figure 28: Percentage distribution of student population by year of birth (1998-1999 school year, grade 8, TIMSS 1999) ... 96
Figure 29: Number of teachers per 1000 children aged 6-13 (1982-2010)... 97
Figure 30: Gross enrollment rate (%, grades 1-8) ... 98
Figure 31: Gross enrollment and teachers per child ... 103
Figure 32: Dependent variable: Completing eight years of schooling ... 104
Figure 33: Dependent variable: Years of schooling ... 105
vii
LIST OF TABLES
Table 1: National and international studies of student assessment... 18
Table 2: Absolute achievement in Evaluation Exam of Student Achievement ... 19
Table 3: Percentage Distribution of Estimated Effect of Teacher Characteristics on Student Performance ... 45
Table 4: Percentage Distribution of Estimated Effects of Teacher Characteristics on Student Performance in Developing Countries (statistically significant and positive)... 47
Table 5: A hypothetical presentation of teacher selection after 2002 ... 53
Table 6: Student characteristics ... 56
Table 7: Teacher characteristics ... 56
Table 8: Main results ... 71
Table 9: Sub-group analysis, female teachers... 72
Table 10: Sub-group analysis, male teachers ... 73
Table 11: Sub-group analysis: underperforming students ... 74
Table 12: Time variant factors: Change in pre-service teacher training programs ... 75
Table 13: Student-teacher sorting: Schools with ability sorting ... 76
Table 14: Estimations without student fixed effect ... 77
Table 15: Descriptive Statistics ... 93
Table 16: Summary of first stage estimations, total female sample ... 110
Table 17: F-ratios associated with the test for weak instruments ... 111
Table 18: Summary of first stage estimations, ever-married female subsample ... 113
Table 19: Point estimates and standard errors of θ under different specifications ... 115
viii
Table 21: First stage estimation, completing eight years of schooling ... 121
Table 22: First stage estimation, completing eight years of schooling excluding age 22 ... 122
Table 23: First stage estimation, years of schooling ... 123
Table 24: First stage estimation, years of schooling excluding age 22 ... 124
Table 25: First stage estimation, completing eight years of schooling, ever-married subsample ... 126
Table 26: First stage estimation, completing eight years of schooling, ever-married subsample excluding age 22 ... 127
Table 27: First stage estimation, years of schooling, ever-married subsample ... 128
Table 28: First stage estimation, years of schooling, ever-married subsample excluding age 22 ... 130
Table 29: Reduced form estimations ... 131
Table 30: OLS estimations, completing eight years of schooling ... 132
Table 31: OLS estimations, years of schooling ... 133
Table 32: TSLS estimations, completing eight years of schooling ... 134
ix
ACKNOWLEDGEMENTS
I am eternally grateful to my dear advisor Francisco Rivera-Batiz. He changed the course of my life with his support and advice. I am also deeply grateful to Neeraj Kaushal. Without her constant help and guidance the completion of this dissertation would not have been possible. I would like to thank the members of my dissertation committee for taking the time to read my work and give me excellent feedback as well.
I also would like to thank Erinç Özada, Haldun Taşman and Turkish Philanthropy Funds which generously and unconditionally supported my studies in US.
My parents and sister have always had faith in me and this allowed me to follow this path. Sevgili anne, sevgili baba ve sevgili kardeşim, sevginiz ve sürekli desteğiniz ile hayallerimi gerçekleştirmemi sağladınız.
At last, but certainly not the least, my wife and best friend, Sedef provided me the motivation and energy which enabled me to go beyond my expectations. Her love is well beyond this single achievement.
x
CHAPTER 1. INTRODUCTION
The most up-to-date version of the main official public planning document of Turkey, the Ninth Development Plan: 2007-2013, emphasizes political determination towards establishing a society which is growing in stability, sharing more equitably, globally competitive and in coherence with the principles of the European Union. The document stresses the strengthening of human
development as one of the key axes of development and directly connects other major areas of transformation, i.e. competitiveness, employment, social solidarity, regional development and quality and effectiveness of public services, to strengthening human development. Moreover the Ninth Development Plan 2007-2013 considers enhancing the public education system as one of the main domains of strengthening human development (State Planning Organization, 2006). This transformation perspective on policy, which is closely linked to a European Union-centered modernization framework, is also documented in detail in earlier versions of development plans since the mid-1990s (State Planning Organization, 1995), a period which also marks the
beginning of the acceleration of the integration initiatives of Turkey with the European economies. Between mid-1990s and mid-2000s this political process generated significant outcomes. In 1996, Turkey became part of the European Customs Union. In 1999 Turkey was granted candidate member status by the EU and official accession talks were launched between Turkey and EU in 2005.
In this period, the governments of Turkey focused on strengthening human development and especially reforming the public education system so as to address the wide educational gap, both in terms of quality and quantity, between the EU countries and Turkey. The World Bank reports that average years of schooling of adults in 1995 was 5.4 years in Turkey, 8.6 years in France
and 9.2 years in Germany.1 The gap in years of schooling of the adult female population between Turkey and these countries was even more striking (4.3 vs. 8.4 years of schooling). Similarly, according to the Trends in International Mathematics and Science Study (TIMSS) of 1999, mean performance of eighth grade students in Mathematics in Turkey was 0.5 standard deviations below that in Italy, the worst performing country among European participants (Ina V.S. Mullis et al., 2000). Thus, public efforts started to grow in the mid-1990s to improve access to education and to raise the quality of schooling. Ever more public resources were devoted to education provision. As a direct outcome of this effort, the share of the budget of the Ministry of National Education (MONE) in the central government budget increased from 8.02 % in 1997 to 11.2 percent in 2012 and its share in GDP increased from 1.74% in 1997 to 2.75 % in 2012 (Ministry of National Education, 2012b).
Not surprisingly, the MONE undertook many initiatives to reform different aspects of public education in Turkey. Therefore this period offers a number of natural experiments and these experiments constitute fertile ground to be studied with the perspectives and tools of economics of education. Two of these initiatives stand out due to their potentially dramatic impact on children, students, teachers and the education system as a whole. First, the Compulsory
Education Law enacted in 1997 required that all the children enrolled in grade 4 or lower must stay in school until the completion of the eighth grade. Extending compulsory years of schooling from five to eight years necessitated a dramatic increase in teacher capacity. In line with the needs of the policy change, the MONE increased the number of primary school teachers by more than 100 thousand between the1996-1997 and 2002-2003 school years. In addition, regions with low enrollment rates prior to 1997 received systematically more teachers per school-age
1
children. Second, the teacher selection regime was changed fundamentally. In 2002, the MONE abandoned the recruitment of teachers based on lottery and started to use a more meritocratic measure, i.e. test scores of teachers. Following the new legislation, the Center of Measurement, Selection and Placement (ÖSYM) launched a central examination process which is known as the Public Servant Selection Examination (KPSS); teacher recruitment was tied to performance in the KPSS.
This dissertation begins with a general discussion of the transformation of the education system of Turkey since the mid-1990s in Chapter 2. The structure of the education system, access and quality issues in pre-primary, primary and secondary education levels are presented with a critical perspective. Chapter 3 provides an evaluation of the impact of the reforms attached to the KPSS on student achievement, using quasi-experimental methods by making use of data
obtained from the Turkey samples of the TIMSS 1999 and 2007. Chapter 4 presents an analysis of the effect of the Compulsory Education Law of 1997 on years of schooling in Turkey; then demonstrates the impact of completing eight years of schooling and additional years of schooling on teenage marriage and fertility by making use of an instrumental variable approach using data from the Turkey Demographic and Health Survey (TDHS) 2003 and 2008 data sets. Chapter 5 states the dissertation’s conclusions and discusses the policy implications.
CHAPTER 2. THE EDUCATION SYSTEM IN TURKEY
I.
Organization
Two characteristics of the education system in Turkey stand out. First, private provision of education is very limited. The share of enrollment accounted for private education institutions is 9.4 percent at the pre-primary level, 2.8 percent at the primary level and 3.6 percent at the secondary level (Ministry of National Education, 2012b). By contrast, as of 2010, on average in OECD countries the share of private education institutions in total enrollment is 38 percent at the pre-primary level, 8.9 percent at the primary level and 19.5 percent at the upper secondary level (OECD, 2012b).
Second, the education system is highly centralized. Public schools are run by the MONE which is responsible for all dimensions concerning public education provision. The MONE hires, assigns and pays principals and teachers, maintains school buildings and other educational facilities, and administers programs. Education provision is directly financed via the central government budget; public schools are free of charge at primary and secondary level; however there are private fees ranging between 50 to 200 Turkish Lira (TL) per month for each child at the pre-primary level. As for private education, individuals, corporations, associations or foundations can establish and administer for-profit private schools based at the pre-primary, primary and secondary levels. Private schools are only accessible to those who can afford it. Average regional private school fees vary between 4000 and 16000 TL depending on the educational level and region where the private school locates. Given that GDP per capita in Turkey is around 17300 TL, as of 2011 it could be said that access to private schooling is very
much limited by affordability.2 On the other hand private education institutions are subject to the same regulations that public institutions have in terms of curricula, teacher qualifications,
working schedule, assessment, progression, diploma, etcetera (EACEA, 2011b). Thus, schools in Turkey operate with very limited autonomy and are designed for delivering the curriculum which is just another centrally developed and monitored component of education provision in the country. In this context, the MONE and its provincial and district offices are the sole decision-makers, regulating and monitoring education provision in public schools and in private schools as well. The OECD reports that 61 percent of all decisions in public lower secondary education in Turkey are taken at the central level and 20 percent at the provincial/district level. On average in OECD countries, 36 percent of all decisions in public lower secondary education are taken at the central level and 6 percent at the provincial/district level (OECD, 2012a).
The education system in Turkey is divided into various levels. Pre-primary education is not compulsory and covers children aged between 36 and 72 months. Primary, lower secondary and upper secondary levels constitute compulsory education (grades 1-12). Primary education consists of four years of schooling (grades 1-4) in primary schools. This is followed by lower secondary education with another four years (grades 5-8) of schooling in middle schools. Then upper secondary education is provided in high schools for a period of four years (grades 9 -12). There are different tracks that can be followed within the lower secondary and upper secondary education levels. Program differentiation during lower secondary education starts as early as age 11 (grade 5) in the form of religious middle schools. The curriculum of these schools contains extra courses on varying religious themes in addition to the general academic program followed by lower secondary education institutions. Upper secondary education consists of academic and
2
vocational/technical schools. Students attending vocational/technical schools can receive a vocational/technical diploma in different fields such as electricity, accounting, health, tourism among other technical areas. As of 2011-2012, 44 percent of students in secondary education attended vocational programs and 56 percent attended academic programs (Ministry of National Education, 2012b). In addition to differentiation of program types, education institutions at the upper secondary level also differ in terms of selectivity. Students aiming to attend selective public academic and vocational high schools have to take a centralized examination and are assigned to selective high schools based on their examination ranking and their preferences. As of 2011, 19 percent of high school students attended selective academic schools and 10 percent attended selective vocational schools (Ministry of National Education, 2012b). At the primary and lower secondary levels student-school matches are based on school location; however at the upper secondary level students are free to choose any type of high school.
The third level of Turkish education corresponds to tertiary education. Education at this level is provided by universities and higher technology institutes. These institutions usually consist of faculties, graduate schools and vocational higher schools. Faculties serve undergraduate
education, scholarly research and publications whereas graduate schools give graduate education in the fields of health, natural sciences and social sciences. Vocational higher schools provide vocationally oriented programs which usually take two to four years to complete. These may be considered as post-secondary education programs.
Only a fraction of high school graduates are able to get a seat in tertiary education institutions and as of 2011-2012, the net enrollment rate in tertiary education is 36 percent (Ministry of National Education, 2012b). Admission to tertiary education institutions requires taking a central examination conducted annually by the ÖSYM and the seats are allocated on the basis of the
applicants’ ranking in the centralized exam as well as lists of ranked preferred programs submitted by applicants. Thus the transition from high school to university is subject to fierce competition in Turkey and tutoring provided by private test preparation centers is very prevalent (EACEA, 2011a).
It should be noted that the current structure of primary and secondary education is relatively new. On 30 March 2012, in response to Law numbered 6287, compulsory years of schooling were increased from eight to twelve. Thus, high school attendance became mandatory. The Law numbered 6287 also restructured primary and lower secondary education. Between the 1997-1998 and 2010-2011 school years primary education had an integrated organization of primary and lower secondary education and eight years of compulsory primary education which allows direct access to upper secondary education were provided under the same school building; thus there were no middle schools for lower secondary education and eight years of compulsory primary education did not offer any differentiation of program types, i.e. tracking. The Law numbered 6287 established middle schools for lower secondary education and introduced religious middle schools. Lastly, following these policy changes The MONE announced the elimination of centralized examinations for selective academic and vocational high school access starting with the 2013-2014 school year. The Minister also declared that the number of program types at the upper secondary level will be reduced. However the future mechanisms for student-school matching, and the future of selective academic and vocational student-schools, are still undefined (Ministry of National Education, 2012a).
II.
Curriculum and instructional time
The curricula at the pre-primary and compulsory education levels in Turkey are nationally supervised and under the control of the Board of Education of the MONE. In primary and middle
schools, courses vary by grade and compulsory courses include Turkish, Mathematics, Science and Technology, Social Sciences, History, Foreign Languages, Religion and Ethics, Drawing, Music, Physical Education and Traffic and First-aid Training. Computer education, Drama, Speech and Writing, Tourism and Agriculture and Animal Husbandry are elective courses offered at this level. The Board of Education also has the last say on textbooks. Teachers’ preferences do not play any role regarding the selection of those textbooks. Thus instructional styles of teachers differ only within the limitations of textbooks selected by the government (EACEA, 2011a). At the primary and lower secondary education levels annual instructional time is 864 hours, which is slightly higher than the OECD average of 843 hours at the primary level and lower than the OECD average of 924 hours at the lower secondary level (OECD, 2012a). At the upper secondary level, the Board of Education regulates the content of courses and the weekly instructional time by program type. Average weekly instructional time lies between 30 and 45 hours. Curricula contain core courses in general culture, field courses, elective courses and field-based elective courses. Core courses are compulsory and include Turkish Language and literature, Religious Culture and Ethics, History, Geography, Mathematics, Biology, Physics, Chemistry, Hygiene, Foreign Language and Physical Education. In academic high schools, field courses prepare students for the program they plan to attend at the tertiary level whereas in vocational schools field courses aim to develop occupational skills (EACEA, 2011a). At the upper secondary education level, annual instructional time is 810 hours which is considerably lower than OECD average of 949 hours (OECD, 2012a).
III.
Access
A. Pre-primary level
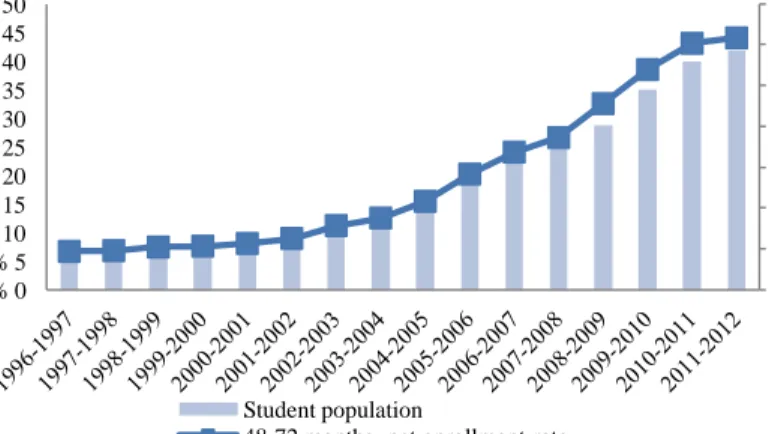
The student population aged between 48 and 72 months at the pre-primary level rose dramatically from two hundred thousand in the 1996-1997 school year to one million two hundred thousand in 2011-2012 school year, as shown in Figure 1. This reflected a rising net enrollment rate, which climbed from below 10 percent in 1996-1997 to over 40 percent in recent years. However, having reached about 44 percent, the net pre-primary enrollment rates appears to have stopped growing in the 2010-2011 and 2011-2012 school years (Ministiry of National Education, 2012).
Figure 1: Student population and net enrollment rate at pre-primary level
Source: Education Reform Initiative (2012)
This recent development imply that Turkey may be unlikely to sustain the expansion of primary schooling without either providing targeted financial assistance to families for schooling or abolishing school fees. The monthly private fee of 50 to 200 TL charged by pre-schools is not a negligible amount, especially for poor families. The poverty line for a family of four is around 700 Turkish Lira a month (Hentschel et al., 2010). Moreover, access to
pre-00 00 00 01 01 01 01 01 % 0 % 5 % 10 % 15 % 20 % 25 % 30 % 35 % 40 % 45 % 50 S tude nt popul a ti on, i n m il li ons N e t e nr ol lm e nt r a te Student population
primary education is limited not only by socio-economic status but also by location and
geography, as the data in Figure 2 clearly shows. The Study of Early Childhood Developmental Ecologies in Turkey reported by Hentschel et al. (2010) concludes that more than 80 percent of mothers with low socioeconomic status does not have access to preschool or nursery schools in their neighborhood while more than 50 percent of mothers with high socioeconomic status have access to these facilities. The same gaps are observed for families according to their urban-rural locations.
Figure 2: Access to pre-primary education by SES status and urban/rural location
Source: Hentschel et al. (2010)
B. Primary and lower secondary levels
As explained earlier, the Compulsory Education Law of 1997 increased the compulsory years of schooling from five to eight years. Following this policy change, net enrollment rates in primary education increased rapidly. As Figure 3 shows, the net enrollment rate in primary education rose from 89.51 percent in 1997 to 98.67 percent in 2011 (Ministry of National Education, 2012b).
0 10 20 30 40 50 60 70 80 90
low SES medium SES high SES rural urban
M ot h er s in t h e s am p le ( %)
There is preschool and nursery school in neighborhood There is elementary school in neighborhood
Figure 3: Net enrollment rate, primary education
Source: Ministry of National Education (2012)
Still, universal enrollment in primary and lower secondary levels have not been achieved and there are still more than 100 thousand children without access to basic education. More
importantly, these numbers hide regional and ethnic differences. The net enrollment rate is 99.53 percent in Istanbul whereas in central eastern Anatolia the net enrollment rate is 94.19 percent (Ministry of National Education, 2012b). Thus regional differences as well as urban/rural gaps may be associated with access to basic education. In terms of ethnicity UNESCO (2012) reports that 13 percent of the Kurdish speaking population aged between 7 and 16 do not have even one year of schooling compared to 1.7 percent among the corresponding Turkish-speaking
population. Finally, enrollment rates of girls and boys show only very little regional variation. It should also be noted that these net enrollment rates may not reflect actual access because, since 2007, the Ministry of National Education gathers enrollment data via an education management information system known as the e-School. The e-School is linked to the administrative population database and assigns each compulsory school age child to his/her
75% 80% 85% 90% 95% 100%
primary school in his/her local catchment area automatically. Thus even if children never attend schools they remain as registered in the e-School database. Significant discrepancies from the data provided by the e-School system have emerged once survey-based estimates of enrollment rates are compared with the official enrollment rates based on the e-School. For example, based on the nationally-representative Demographic and Health Survey of 2008, the net primary enrollment rate in Turkey is 92.7 percent whereas the corresponding net enrollment rate reported via the e-School is 97.4 percent, as Figure 4 reports (Hacettepe University Institute of Population Studies, 2009; Ministry of National Education, 2012b).
Figure 4: Administrative records vs. survey based computation of net enrollment rates
Source: Ministry of National Education (2012), Hacettepe University Institute of Population Studies (2009)
Another serious issue concerning access to basic education in Turkey is growing student absenteeism. The average unexcused student non-attendance between grades 1 and 5 was 3.2 days in 2007, but this increased by over 80 percent to 5.8 days in 2011. Additionally, the average of unexcused student non-attendance between grades 6 and 8 was 7.8 days in 2007, which had
82% 84% 86% 88% 90% 92% 94% 96% 98% 100% 2003 2008
grown to 11.6 days in 2011. Similarly, as Figure 5 shows, the ratio of students who did not attend school for more than 30 days in an academic year quadrupled between 2007 and 2011 (Bakış, Börkan, Levent, Pelek, & Dereli, forthcoming, 2012).
Concern over the growing absenteeism is magnified by the fact that it disproportionately affects the poor. A report examining the factors driving student non-attendance using four years of panel data from the e-School database concludes that academic achievement and family income are closely linked to absenteeism. In particular, the report finds that the economic recession affecting Turkey in 2009 affected students from disadvantaged socioeconomic backgrounds
disproportionately and this, in turn, was reflected in higher absenteeism (Bakış, et al., forthcoming, 2012).
Figure 5: Unexcused student absenteeism (%, 2007-2010)
Source: Bakış, et al. (forthcoming, 2012)
Serious regional disparities also exist in student non-attendance. Between grades 6 and 8, in Diyarbakır and Şanlıurfa, provinces in relatively poor and predominantly Kurdish Southeast
0 10 20 30 40 50 60 70
0 days 1-10 days 11-20 days 21-30 days 31 days or
more
Anatolia, the average days of unexcused student non-attendance is 15.6 days in an academic year, whereas the average falls to 5.2 days in Antalya, Isparta and Burdur, provinces in the relatively rich Mediterranean and Aegean regions.
C. Upper secondary education
As of the 2011-2012 school year, the net enrollment rate at the upper secondary level was 67 percent. This constitutes an increase of almost 30 percentage points when compared to its level in the 1997-1998 school year, which was 38 percent. This increase in net enrollment rates is likely to continue in the following years given that upper secondary level became a part of compulsory education beginning with the 2012-2013 school year. However it should be noted that these aggregate figures hide substantial regional differences. In the western provinces, net enrollment rates are much higher than in the eastern provinces. For example, in Bilecik and Bolu net enrollment rates exceed 90 percent whereas in Muş and Ağrı net enrollment rates are just above 30 percent.
The major issues regarding access to the upper secondary level are gender disparity and high drop-out rates. The female enrollment rate as a percentage of the male enrollment rate at this level improved substantially from 1997 to 2011, rising from 75 to 93 percent. However, gender still plays a role in enrollment at some upper secondary education institutions (Uysal & Güner, forthcoming, 2012). Additionally, the difference between male and female enrollment rates vary across provinces, reaching more than 15 percentage points in most of the Southeastern provinces, which are relatively poor, rural and predominantly Kurdish.
The latest administrative data on drop-out rates at the upper secondary level are for the 2009-2010 school year and they show a drop-out rate of 8.2 percent. However, again, this aggregate
figure conceals differences by gender and program types. Males are much more likely to drop out, with a drop-out rate of 10.2 percent and students in vocational/technical programs are also more likely to drop out, with a drop-out rate of 9.4 percent. On the other hand, administrative data on drop-out rates do not show any striking differences across regions.
IV.
Quality
A. Pre-primary level
There are no studies or projects explicitly analyzing the quality of pre-primary education across countries through outcome-based measures. Thus it is not possible to compare, for example, the level of school readiness of students at pre-primary level in Turkey and in other countries. However internationally comparable data on school resources at the pre-primary level are available and this allows to make some rough cross-country assessments.
The ratio of student to teaching staff at the pre-primary level in Turkey is 27.4 whereas the average ratio of student to teaching staff at this level in OECD countries is 14.7 (OECD, 2012a). Additionally, the minimum standards regarding the ratio of student to teaching staff is 20 in Turkey but it is on average equal to 15 in countries for which data are available. Similarly minimum standards regarding outdoor space per student are 2 square meters in Turkey and 8 square meters in countries for which data are available, on average (Figure 6) (OECD, 2012c).
Figure 6: Regulated minimum outdoor space requirement in square meters per child
Source: OECD (2012c)
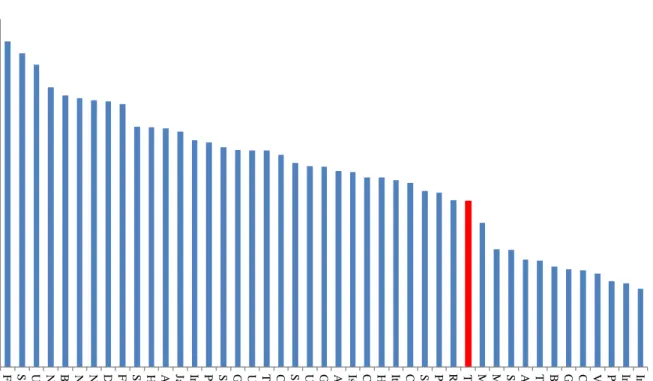
A very recent research programme conducted by the Economist Intelligence Unit (EIU) and commissioned by the Lien Foundation ranks the preschool environments for 45 countries in three domains: availability, affordability and quality, for each of which an index is constructed. The quality index is composed of 1) the average student-teacher ratio in preschool classrooms, 2) average preschool teacher wages, 3) curriculum guidelines, 4) preschool teacher training, 5) health and safety guidelines, 6) data collection mechanisms, 7) linkages between preschool and primary school, and 8) parental involvement and education programmes. As Figure 7 shows, Turkey ranks 33rd in the quality domain among the 45 countries. The EIU study highlights that although there are no clear rights to preschool education nor any effective subsidies that reach underprivileged families in Turkey, teachers in early childhood education are relatively well-trained and curriculum and health and safety standards are well-defined (Economist Intelligence Unit, 2012). 0 5 10 15 20 25 30 N or w ay G er m any - N R W S love ni a G er m any - LS G er m any - S axony G er m any - T hur ingi a T ot al A ve ra ge C ana da P E I E st oni a O E C D A ve ra ge G er m any - B er li n Is ra el G er m any - S aa rl and N ew Z ea la nd C ze ch R epu bl ic G er m any - BW N et he rl ands S lova k R epubl ic It al y T ur ke y
Figure 7: Index of quality of pre-primary education
Source: EIU (2012).
B. Quality of basic education (primary, lower secondary and upper secondary levels)
In contrast to the pre-primary level, there are national as well as international measures which provide information regarding academic competencies of students at the primary, lower
secondary and upper secondary levels. Table 1 provides a complete list of the studies designed specifically to assess student proficiency in different subjects. There are two other examinations that are not presented in Table 1. These are student selection examinations conducted to manage transition from middle to high schools and from high school to tertiary education institutions. These examinations are not intended to be nationally representative and their primary purpose is to rank students and allocate seats to students seeking to continue their schooling at the upper
0 10 20 30 40 50 60 70 80 90 100 F inl a nd S w e de n UK N or w a y B e lgi um N e w Z e a la nd N e the rla nds D e nm a rk F ra nc e S out h K or e a H ong K ong A us tr ia Ja pa n Ir e la nd P or tuga l S w itz e rla nd G e rm a ny UAE T a iw a n C z e c h R e publ ic S pa in U S A G re e c e A us tr a lia Is ra e l C a na da H un ga ry Ita ly C hi le S inga por e P ol a nd R us si a T ur ke y M e xi c o M a la ys ia S out h A fr ic a A rge nt ina T ha ila nd B ra z il G h a n a C hi na V ie tn a m P hi lippi ne s Indone si a Indi a
education levels. The potential selectivity issue prevents the use of these examinations as a measure of quality of education in Turkey.
Table 1: National and international studies of student assessment
Coverage Sampling/Universal Subjects Years International/National
Evaluation Exam of Student Achievement 4/5/6/7/8 grades Sampling Turkish, Mathematics, Science and Technology, Social Sciences 2002, 2005, 2008 National
PIRLS 4 grade Sampling Reading 2001 International
TIMSS 4 (2011) /8 grades Sampling Mathematics, Science 1999, 2007, 2011 International PISA 15 year-old student population Sampling Reading, Mathematics, Science 2003, 2006, 2009 International
The Evaluation Exam of Student Achievement is a national attempt to assess competencies of students between grades 4 and 8. The sample sizes vary between 30 to 100 thousands and students are tested in Turkish, Mathematics, Science and Technology and Social Sciences. Average achievement of students in this examination exhibits an increase between 2002 and 2008 independently of subject matter. As Table 2 shows, the increase is more less the same in Turkish, Mathematics and Social Sciences between 2002 and 2005 and 2005 and 2008. However the rise in the achievement of students in Science and Technology is much more pronounced between 2005 and 2008 when compared to 2002 and 2005. MONE links this pattern of post -2005 achievement increase in Science and Technology with curriculum reforms in primary education undertaken in 2005. A more comprehensive discussion of this issue will be provided in the following chapters.
Table 2: Absolute achievement in Evaluation Exam of Student Achievement
Turkish Mathematics Science and Technology Social Sciences
Grade 2002 2005 2008 2002 2005 2008 2002 2005 2008 2002 2005 2008 4 43 46 50 40 45 53 40 45 63 41 47 49 5 51 59 62 46 49 52 46 49 47 43 48 52 6 45 50 55 38 37 35 38 37 48 36 42 49 7 48 51 51 36 37 40 36 37 44 40 41 47 8 53 59 63 41 45 46 41 45 49 47 50 51 Source: Celik (2012)
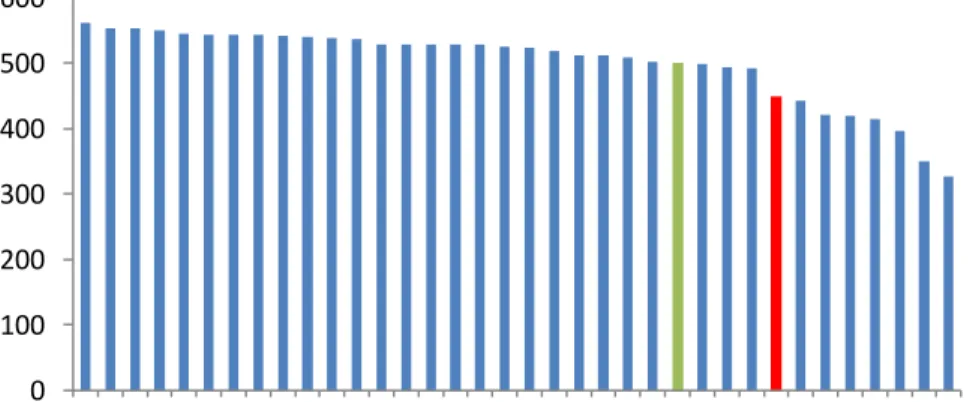
The Progress in International Reading Literacy Study (PIRLS) is an assessment of students’ reading achievement at the 4th grade in a cross-section of countries. PIRLS evaluates a range of reading comprehension skills and a wide spectrum of questions requires students to construct and write their answers. PIRLS was conducted in 2001, 2006 and 2011 and 4th graders in Turkey participated in the 2001 PIRLS. In this assessment, the average score of students in Turkey was almost a half standard deviation below the international average and on par with students in Macedonia, Colombia and Argentina, as Figure 8 shows. Only 2 percent of students in Turkey reached the top 10 percent benchmark and only 9 percent of students reached the upper quarter benchmark in reading comprehension (I.V.S. Mullis, Martin, Gonzalez, & Kennedy, 2003).
Figure 8: Average scale scores in reading comprehension (PIRLS, 2001)
0 100 200 300 400 500 600 S w ed en N et h er la n d s E n g la n d B u lg a ria L a tv ia C a n a d a L ith u a n ia H u n g a ry U n ite d S ta te s It a ly G er m a n y C ze ch R ep u b lic N ew Z ea la n d S co tla n d S in g a p o re R u ss ia n F ed er a tio n H o n g K o n g F ra n ce G re ec e S lo v a k R ep u b lic Ic el a n d R o m a n ia Is ra el S lo v en ia In te rn a tio n a l a v er a g e N o rw a y C y p ru s M o ld o v a T u rk ey M a ce d o n ia C o lo m b ia A rg en tin a Ir a n K u w a it M o ro cc o B el iz e
Source: Mullis, Martin, Gonzalez, & Kennedy (2003)
Ten years later, 4th graders were tested again for the Trends in International Mathematics and Science Study (TIMSS) of 2011. TIMSS is an international evaluation of mathematics and science student achievement at the 4th and 8th grades. TIMSS has been conducted since 1995 in four-year cycles. TIMSS 2011 represented the fifth cycle and it assembled nationally
representative samples of 4th and 8th grade students in 63 countries. Note that countries have the option to participate in the fourth grade assessment, the eighth grade assessment, or both. In TIMSS 2011, Turkey participated in both the fourth and eighth grade assessments.
Turkey’s average mathematics scale score of 4th
grade students ranked 37th out of 52 countries evaluated. The score was on par with Romania, Poland, Azerbaijan and Chile and it was approximately 0.3 standard deviations below the international average. In science, the average score of students in Turkey ranked 38th among 52 countries, on par with Chile, Thailand, Georgia and Iran and approximately 0.4 standard deviations below the international average (Martin, Mullis, Foy, & Stanco, 2012; I.V.S. Mullis, Martin, Foy, & Arora, 2012).
The average mathematics and science performance of 8th graders in Turkey, as reported by TIMSS, does not differ much from the average mathematics and science performance of 4th graders. The average mathematics scale score of 8th graders in Turkey ranked 24th among 45 participating countries and stands more than half a standard deviations below the international average. Similarly, the average science scale score of 8th graders in Turkey ranked 21st among 45 participating countries and stands more than 0.2 standard deviations below the international average (Martin, et al., 2012; I.V.S. Mullis, et al., 2012).
Is there a change over time in the performance of students in Turkey relative to other countries? Eighth graders in Turkey participated in the 1999, 2007 and 2011 TIMSS, so it is possible to compare student achievement over time using these data. Even though the learning outcomes of 8th graders in Turkey are much lower than international benchmarks, the data for 2011 does reflect an improvement when compared with the previous assessment in 2007. Indeed, the average mathematics score of eighth graders in Turkey was 0.7 standard deviations below the international average in 2007 (compared to about 0.5 standard deviation in 2011), and the science average score in 2007 was 0.45 standard deviations below the international average (compared to 0.2 standard deviations in 2011) (Martin, Mullis, Foy, & Olson, 2008a, 2008b). A closer look at the achievement distribution of 8th graders in Turkey highlights the fact that the increase in learning outcomes was much more pronounced at the lower end of the achievement distribution. From 2007 to 2011, the percentage of 8th graders who scored below the low benchmark in the science test went down from 29 percent to 21 percent. Likewise, as Figure 9 shows, the percentage of students scoring at the low benchmark in science decreased from 31 to 25 between 2007 and 2011 in science achievement.
Figure 9: Percentage of 8th graders in Turkey by TIMSS science achievement benchmarks
Source: Martin, et al. (2012), Martin, Mullis, Foy, & Olson (2008b)
A similar pattern can also be seen in mathematics achievement. However the reduction in those who failed to reach the low benchmark is much higher when compared to the science test. From 2007 to 2011, the percentage of 8th graders who failed to reach the low benchmark in
mathematics declined from 41 percent to 33 percent. On the other hand, as Figure 10 displays, there is not much change in the percentage of those students that just met the low benchmark in the mathematics test: the percentage of students at the low benchmark in mathematics slightly increased from 26 percent to 27 percent between 2007 and 2011.
0 5 10 15 20 25 30 35 Advanced benchmark High benchmark Intermediate benchmark Low benchmark Below low benchmark 2007 2011
Figure 10: Percentage of 8th graders in Turkey by TIMSS mathematics achievement benchmarks
Source: Mullis, et al. (2012), Martin, Mullis, Foy, & Olson (2008a)
Not surprisingly, the findings from PISA 2003, 2006 and 2009 run parallel to what has just been described regarding student achievement in Turkey and its trend from the early 2000s to the late 2000s. However, note that PISA evaluates the skills of a different age group: 15 year-olds. In terms of grade levels, a significant majority of the student population that took the PISA assessment in Turkey were in 9th and 10th grades, the first and second grades of high school. The tests are in reading, mathematics and science literacy. The average reading, mathematics and science achievements of the 15-year old student population in Turkey were 0.8, 0.6 and 0.7 standard deviations below the OECD average in PISA 2003, respectively (OECD, 2004). In all of these subjects, the achievement gap diminished by approximately 0.2 standard deviations by 2009. Therefore, although there is still a significant distance between average student
achievement in Turkey and in OECD countries as a whole, students in Turkey have been approaching their counterparts in the OECD (OECD, 2004, 2010b).
0 5 10 15 20 25 30 35 40 45 Advanced benchmark High benchmark Intermediate benchmark Low benchmark Below low benchmark 2007 2011
A closer look at the achievement distributions in the three subject areas also reveals that the percentage of students at the lower levels of proficiency went down between PISA 2006 and 2009. As Figure 11 depicts, in mathematics, those who could not reach Proficiency Level 1 decreased from 24 percent to 18 percent and those who could only reach Proficiency Level 1 dropped from 28 percent to 24 percent (OECD, 2007, 2010b) (Figure 11).
Figure 11: Percentage of students at the different levels of mathematics proficiency
Source: OECD (2007, 2010b)
The drop in the percentage of students at the lower levels of science proficiency is even more dramatic. As Figure 12 shows, from 2006 to 2009 those who could not reach Proficiency Level 1 in science declined from 13 percent to 7 percent and those who could only reach Proficiency Level 1 decreased from 34 percent to 23 percent (OECD, 2007, 2010b).
0 5 10 15 20 25 30 Below Level 1
Level 1 Level 2 Level 3 Level 4 Level 5 Level 6
Figure 12: Percentage of students at the different levels of science proficiency
Source: OECD (2007, 2010b)
By contrast, the improvement in the reading achievement of 15-year old students in Turkey is not predominantly concentrated at the lower end of the achievement distribution. Although the percentage of students who lie below Proficiency Level 1 has dropped from 32 to 25, there is no remarkable change in the percentage of students who reach only Proficiency Level 1. And as Figure 13 presents, there are also noteworthy increases at the higher end of the achievement distribution: the percentage of students who reached Proficiency Level 3 increased from 24 to 29 (OECD, 2007, 2010b). The relatively lackluster improvements in reading achievement at the lower proficiency levels, when compared to the more significant improvements in science and math may be related to the ethno-linguistic diversity in Turkey and the concentration of poverty among linguistic minorities. This question cannot be answered by using the PISA data sets because their comparably small samples do not provide reliable information on which language students speak at home. In fact, in the PISA Turkey data sets only approximately 2 percent of
0 5 10 15 20 25 30 35 40 Below Level 1
Level 1 Level 2 Level 3 Level 4 Level 5 Level 6
students report that they do not speak Turkish at home whereas the more comprehensive UNESCO (2012) study reports that 18.2 percent of the population in Turkey speaks Kurdish.
Figure 13: Percentage of students at the different levels of reading proficiency
Source: OECD (2007, 2010b)
The overall increased learning outcomes at the lower end of the achievement distribution exhibited via TIMSS and PISA can be interpreted as an improvement in the equity of learning outcomes of 8th graders or the 15-year old student population. However, as Figure 14 shows, Turkey still tops the charts when it comes to variation in academic performance between schools, i.e. an important indicator of inequality in the quality of schools or student-school sorting based on academic performance (OECD, 2010c). It should be also noted that schools’ socio-economic background is very strongly associated with academic performance in Turkey while students’ socio-economic background has been found to play a lesser role, especially when compared to OECD countries overall. As Figure 15 displays, in OECD countries, 55 percent of the variation in student academic performance is associated with schools’ socio-economic background and 4 percent of the variation in academic performance is associated with students’ socio-economic
0 5 10 15 20 25 30 35 Level 1 or lower
Level 2 Level 3 Level 4 Level 5
background. In Turkey 68 percent of variation in academic performance is associated with schools’ socio-economic background and 2 percent of the variation in academic performance is associated with students’ socio-economic background (OECD, 2010c). On the other hand variation in academic performance within schools in Turkey is below the OECD average.
Figure 14: Variation in reading performance between schools (expressed as a percentage of the variance in student performance across OECD countries)
Source: OECD (2010c) 0 10 20 30 40 50 60 70 80 90 Ita ly T u rk e y Is ra e l G e rma n y H unga ry A us tr ia B e lgi um L uxe m bour g N e the rla nds Ja pa n C hi le G re e c e C z e c h R e publ ic S love ni a U ni te d st a te s M e xi c o S lova k R e publ ic Ir e la nd U ni te d ki ngdom K or e a S w itz e rla nd A us tr a lia N e w Z e a la nd P or tuga l C a na da S w e de n S pa in P ol a nd E st oni a Ic e la nd D e n ma rk N or w a y F inl a nd
Figure 15: Variation in reading performance explained by schools’ socio-economic background (expressed as a percentage of the variance in student performance across OECD countries)
Source: OECD (2010c)
Regarding this issue, the centralized testing mechanism managing the transition from 8th to 9th grade in Turkey deserves special emphasis. As mentioned earlier, students who wish to attend 9th grade in a selective vocational or academic high school are subject to selection through the use of a centralized test. Thus it may be argued that this selection mechanism is the main driver of the high between-school variance in academic performance presented via the PISA data, which covers mainly 9th and 10th graders. Additionally, some of the high explanatory power of schools’ socio-economic background on academic performance may be attributed to this selection
mechanism because students targeting the more competitive institutions usually attend private tutoring centers. Annual costs associated with enhanced test preparation may exceed 12000 TL.3 Therefore, family income prevails as one of the key predictors of selective high school
attendance. 3 http://t24.com.tr/haber/ogrencilerin-dershane-fiyati-can-yakiyor/66269 0 10 20 30 40 50 60 70 80 90 L uxe m bour g U ni te d ki ngdom U ni te d st a te s N e w Z e a la nd D e nm a rk C hi le T ur ke y S w e de n A us tr a lia G e rm a ny C z e c h R e publ ic B e lgi um P ol a nd H unga ry P or tuga l Ir e la nd S lova k R e publ ic K or e a Ja pa n A us tr ia S w itz e rla nd S pa in E st oni a N e the rla nds C a na da Ita ly Israe l S love ni a G re e c e M e xi c o N o rw a y Ic e la nd F inl a nd
On the other hand, little is known regarding the differentiation of educational quality across program types in Turkey. Indeed there is only one econometric study which utilizes a value-added specification and provides estimates of value value-added for program types (Alkan, Çarkoğlu, Filiztekin, & İnceoğlu, 2008). In this study, researchers matched university entrance examination scores with high school examination scores for 1.8 million individuals. The study included also additional detailed information for a subsample of 12,838 students. For this subsample
information was collected by survey and added to the database. Then researchers estimated a value added specification where the dependent variable was percentile ranking in the university entrance examination, and in which a large set of controls were added, including the high school examination scores, student effort, parental income and education, and school fixed effects. Following this exercise, they regressed estimated school fixed effects on program type dummies. Figure 16 presents estimates for program types obtained in this final regression. Non-selective academic programs constitute the comparison category. The findings highlight the fact that there are considerable differences across program types in terms educational quality, as measured by percentile ranking in the university entrance examination. Students who attend selective science high schools, a branch of academically selective public high schools, have on average more than 6 points higher percentile rankings whereas students who attend vocational and selective
vocational programs have 14-15 points lower in percentile rankings when compared to students attending non-selective general high schools.
Figure 16: Value added estimates of program types
Source: Alkan, Çarkoğlu, Filiztekin, & İnceoğlu (2008)
These estimated impacts are very significant because there are approximately 430 thousand seats in four year university programs and more than 2 million applicants take university entrance exam. Thus those ranked below the 21th percentile have very little chance to get a seat in a four year university program and those who attend a vocational and selective vocational high school have a handicap of 14-15 percentile points. Thus, differences in educational quality across program types appear to be highly influential in determining the likelihood of university attendance. However this finding should be considered as suggestive given the study of Alkan, Çarkoğlu, Filiztekin, & İnceoğlu (2008) is not based on a quasi-experimental approach and may be subject to a variety of endogeneity issues.
-0.2 -0.15 -0.1 -0.05 0 0.05 0.1 S el ec tive voc at iona l V oc at iona l M ul ti-pr ogr am m ed voc at iona l P riva te sc ie nc e A ca de m ic ( for ei gn l angu age ) S el ec tive a ca de m ic P riva te S el ec tive s ci enc e
V.
Conclusion
The education system in Turkey is full of intriguing questions. At the pre-primary level, there is very limited research on the determinants of access and the impact of preschool attendance on school readiness and later educational and social outcomes. At the primary, lower secondary and upper secondary levels, there are no econometric evaluations of private/public school
effectiveness as well as analyses of the determinants of school and teacher quality. Additionally, policy changes made over the last 20 years –combined with increased availability of data--provide fertile ground for research in the field of economics of education. Looking to the future, the education reform in 2012, i.e. the restructuring of basic education, the establishing of middle schools and religious middle schools, and the expansion of compulsory years of schooling from eight to twelve years, provide natural experiments for potential research.
This dissertation is focused on an econometric examination of two major policy developments of the last two decades. First, it tries to understand whether the change in teacher selection regime in 2002 made a contribution to the significant gains in learning outcomes of 8th graders and 15-year old students between 1999 and 2009, as shown earlier in this chapter. For this purpose, an identification strategy based on a difference-in-differences strategy coupled with student fixed effects will be utilized using the TIMSS 1999 and 2007 Turkey micro data sets.
Chapter 4 analyzes the impact of another major policy change discussed earlier: the increased years of compulsory education in 1997. The research aims to give an insight on the impact of increasing compulsory years of schooling from five to eight years on the actual years of
schooling of the target population. It intends to assess the effectiveness of the policy change. For that purpose, the identification strategy is based on a difference-in-difference-in-differences strategy which makes use of variation in time (across cohorts) as well as regional variation of
treatment intensity. This analysis sets the first stage for a two stage least square specification aiming to get causal estimates of additional years of schooling and completing eight year primary education on teenage marriage and motherhood. This investigation utilizes the Turkey
Demographic and Health Surveys of 2003 and 2008 and administrative records of regional teacher assignments, i.e. treatment intensity measure, from MONE’s statistical yearbooks.
CHAPTER 3. TEACHER SELECTION AND EFFECTIVENESS
IN TURKEY: TEACHER TESTING AND QUALITY
I.
Introduction
In 2002, the MONE undertook a major reform of its teaching recruitment strategy. The existing teacher selection system based on a lottery was replaced with a teacher selection model which operates based on a teacher examination called the Public Servant Selection Examination (KPSS). This chapter seeks to determine the impact of this reform on student achievement in Turkey.
In order to examine the role played by the teacher selection reform on the effectiveness of the education system, this thesis uses data on student achievement available before and after the reform. The Trends in International Mathematics and Science Study (TIMSS) and the Program for International Student Assessment (PISA) periodically measure student achievement on an international scale and it is possible to track student achievement in participating countries over time and make cross-country comparisons with the help of these projects.
Students in Turkey participated in TIMSS in 1999 and 2007 and PISA in 2003, 2006 and 2009. TIMSS covers a representative set of 8th graders and measures their mathematics and science skills whereas PISA focuses on a representative set of the 15-year old student population and measures reading, mathematics and science literacy.
The average TIMSS mathematics and science achievement of students in Turkey in 1999 and 2007 are not directly comparable in time4. However one may standardize mathematics and science test scores for a set of common countries which took part in TIMSS in 1999 as well as 2007 with mean 0 and standard deviation 1 for each year and then compare achievement
distributions in 1999 and 2007 and draw inferences about the relative achievement of students in Turkey. Such a treatment suggests that the average mathematics achievement in Turkey
increased by 0.17 standard deviations between 1999 and 2007 and the average science achievement increased by 0.21 standard deviations during this time period.
Figure 17 presents kernel density estimations of standardized mathematics and science scores in Turkey and all of the other countries. These estimations demonstrate two important points: First, the density of the distribution of students in Turkey who perform below the cross-country average was much higher in 1999 than in 2007. Second, the density of the distribution of students in Turkey who performed above the cross-country average was much lower in 1999 than in 2007.
4
Turkey is one of the few countries that experienced hardship in translating trend items from English to Turkish in 2007. Therefore the validity of the trend items in the TIMSS 2007 application of Turkey is questionable and in-time comparison of average achievement of students in Turkey was not reported by the IEA. This information is obtained via an email exchange with Ebru Erberber, a collaborator of TIMSS 2007 at IEA.
Figure 17: Achievements of students in Turkey, TIMSS 1999 and 2007
PISA offers more definitive information about the trend of learning outcomes of students in Turkey. The mathematics achievement of students is comparable between 2003 and 2009 and the science achievement of students is comparable between 2006 and 2009 (OECD, 2010a). During the 2003 and 2009 time period, the average mathematics score of 15-year old students in Turkey increased by 22 points, as is depicted in Figure 18. This corresponds to more than 0.2 standard deviations. The average science score of 15-year old students in Turkey increased by 30 points between 2006 and 2009 which is approximately 0.3 standard deviations, as depicted in Figure 19 (OECD, 2010a). 0 .1 .2 .3 .4 .5 D e n s it y -4 -2 0 2 4 Mathematics, Turkey 0 .1 .2 .3 .4 D e n s it y -4 -2 0 2 4
Mathematics, All except Turkey
0 .1 .2 .3 .4 .5 D e n s it y -4 -2 0 2 4 Science, Turkey 0 .1 .2 .3 .4 D e n s it y -4 -2 0 2 4
Science, All except Turkey
Kernel Density Estimations
TIMSS 1999 TIMSS 2007
Figure 18: Score point change in mathematics between 2003 and 2009, PISA
Figure 19: Score point change in science between 2006 and 2009, PISA
-25 -20 -15 -10 -5 0 5 10 15 20 25 30 35 40 M e xi c o 0 B ra z il 0 T ur ke y 1 G re e c e 0 P or tuga l 0 It a ly 0 T uni si a 0 Indone si a 5 G e rm a ny 4 S w it z e rl a nd 15 S e rbi a 29 P ol a nd 29 U rugua y 33 U ni te d S ta te s 37 H ong K ong -C hi na 46 K or e a 47 N or w a y 48 T ha il a nd 74 L ie c ht e ns te in 97 H un ga ry 97 O E C D a ve ra ge -28 98 R us si a n F e de ra ti on 92 L a tvi a 78 S lova k R e publ ic 76 S pa in 67 M a c a o -C hi na 58 F inl a nd 28 L uxe m bour g 10 N e w Z e a la nd 27 Ja pa n 36 C a na da 7 Ic e la nd 0 A us tr a li a 1 D e nm a rk 1 N e the rl a nds 5 B e lgi um 0 F ra nc e 0 S w e de n 0 Ir e la nd 0 C z e c h R e publ ic 0 S c o re p o in t c h a n g e i n m a th e m at ic s p e rf o rm a n ce b e tw e en 2 0 0 3 a n d 2 0 0 9 p-value in % -20 -15 -10 -5 0 5 10 15 20 25 30 35 Q a ta r 0 T u rk e y 0 P or tuga l 0 K or e a 0 T uni si a 0 B ra z il 0 C ol om bi a 1 It a ly 0 N or w a y 1 U ni te d S ta te s 3 P ol a nd 2 R om a ni a 10 A rge nt ina 23 C hi le 11 Ja pa n 14 K yr gyz st a n 12 S e rbi a 12 H on g K on g -C hi na 13 M e xi c o 13 B ul ga ri a 56 S w it z e rl a nd 31 Ic e la nd 15 G e rm a ny 38 L a tvi a 38 T ha il a nd 34 L it hua ni a 47 D e nm a rk 47 F ra nc e 59 O E C D a ve ra ge -33 24 S lova k R e publ ic 70 N e w Z e a la nd 72 Is ra e l 86 A us tr a li a 93 M a c a o -C hi na 94 S pa in 97 Ir e la nd 95 U rug ua y 84 U ni te d K ing do m 80 R us si a n F e de ra ti on 83 H un ga ry 79 L ie c ht e ns te in 70 L uxe m bour g 43 N e the rl a nds 69 G re e c e 57 E st oni a 43 B e lgi um 39 C a na da 11 Jor da n 21 C roa ti a 13 S love ni a 2 S w e de n 6 A z e rba ij a n 6 F inl a nd 2 M ont e ne gr o 0 Indone si a 14 C hi ne se T a ipe i 2 C z e c h R e pu bl ic 2 S c or e poi nt c ha nge i n sc ie nc e pe rf or m a nc e be tw e e n 2006 a nd 2009 p-value in %
However these improvements did not occur uniformly. The percentage of students that falls below the proficiency level 2 decreased from 52 percent to 42 percent in mathematics (Figure 20) and from 47 percent to 30 percent in science5 (Figure 21). On the other hand, the percentage of top performers did not show any increase or decrease between the two respective periods.
Figure 20: Percentage of students below proficiency level 2, mathematics, PISA 2003 and 2009
5
In mathematics literacy students at proficiency level 2 can understand and discern situations in contexts that require no more than direct inference. Students at this level can make use of basic algorithms, formulae, procedures, or conventions. They are competent of direct reasoning and literal interpretations of the results. In science literacy students at proficiency level 2 have sufficient scientific knowledge to offer possible explanations in familiar contexts or draw conclusions based on uncomplicated investigations. They are competent of direct reasoning and literal interpretations of the results (OECD, 2010d).
0 10 20 30 40 50 60 70 80 90 F inl a nd o K o re a o H ong K ong -C hi na o L ie c ht e ns te in o M a c a o -C hi na o C a na da o Ja pa n o N e the rl a nds o S w it z e rl a nd o N e w Z e a la nd o A us tr a li a o Ic e la n d + D e nm a rk o N or w a y o G e rm a ny o B e lgi um + P ol a nd o Ir e la nd + S lova k R e publ ic o S w e de n + H unga ry o C z e c h R e publ ic + F ra nc e + L a tvi a o U ni te d S ta te s o P or tuga l -S pa in o L uxe m bour g + It a ly -R us si a n F e d o G re e c e - S e rbi a o T ur ke y -U rug ua y o M e xi c o -T ha il a nd o B ra z il - T un is ia - Indone si a o P e rc e nt a ge of s tude nt s be low pr of ic ie nc y L e ve l 2 2009 2003