The Impact of Measuring and Publicizing Teacher Value-Added on
Teacher Turnover and School Performance:
The Case of Ohio’s 2011 Value-Added Pilot Program
Undergraduate Research Thesis
Presented in partial fulfillment of the requirements for graduation with honors research distinction in Public Policy Analysis in the undergraduate colleges of The Ohio State University
by Eleni Packis
The Ohio State University May 2018
Project Advisor: Dr. Stéphane Lavertu, The John Glenn College of Public Affairs
ABSTRACT
Research has shown that teacher quality—as measured by the annual test score gains of their students—is an important predictor of students’ educational and life outcomes. As a result, teacher evaluation systems increasingly employ student test score gains, otherwise known as teacher “value added” scores. Unfortunately, there has not been much research into whether a school and district’s use of these evaluation systems actually leads to an improvement in student achievement. This study examines a unique pilot program in Ohio that brought value-added measurement methods to a sample of districts in 2011, which enables a comparison of outcomes between districts that did and did not utilize value-added metrics. Additionally, because
individual teacher value-added scores were published in a prominent newspaper shortly
thereafter, this case allows for the estimation of the impact of publishing teacher evaluations on teacher turnover and the performance of school districts. The results indicate that schools that participated in the study and had teachers’ scores published experienced greater teacher turnover and higher student achievement gains than schools that did not. Specifically, immediately after the pilot began in 2011, the average student in a participating school experienced the equivalent of almost 9 additional “days of learning” per year as compared to the average student in a school that did not participate. Then, in 2014—immediately after the public dissemination of test scores—student achievement increased by a similar 8 additional days’ worth of learning. The analysis also reveals that low-rated teachers left at higher rates than high-rated teachers during these years, which is consistent with the notion that improvements in teacher quality are responsible for students’ achievement gains.
INTRODUCTION
Teachers have a significant impact on their students’ academic and life outcomes.
Research has shown that there is significant variation across teachers in terms of how much their students learn, and that students whose teachers do a better job of educating them receive great social and economic benefits, including becoming more likely to attend college, more likely earn higher salaries, and less likely to have children as teenagers (Chetty et al., 2013; Rockoff, 2004; Deming, 2011; Rivkin, 2005; Jackson, 2012). One estimate indicates that a highly effective teacher in a classroom of 20 students raises students’ aggregate earnings by over $400,000 each year (Hanushek, 2011).1 Because of the significant evidence validating “value added” metrics of teacher quality, there is quite a heavy push by some policy-makers and other interested parties to increase the extent to which public schools use student test score gains to evaluate teachers—so that “good” teachers can be rewarded and “bad” teachers can improve or leave.
In 2011, Ohio launched a teacher evaluation pilot program that brought value-added measurement methods to a voluntary sample of 139 districts. Teacher value-added was calculated for math and reading teachers in grades four through eight. Two years later, the Cleveland Plain Dealer obtained and published 4,200 teachers’ value-added scores. This sequence of events in the implementation of the pilot program, as well as the eventual publication of teachers’ scores, enabled me to conduct a comparison of outcomes between districts that did and did not utilize value-added metrics and have their teachers’ scores published.
To estimate the impact of districts participating in the pilot program and of the eventual public disclosure of individual teachers’ scores, I obtained from the Ohio Department of
1 Here, a “highly effective” teacher is one designated as located at the 84th percentile in effectiveness, as measured by student test score gains in math and reading.
Education (ODE) 2009-2017 data on all Ohio teachers and the characteristics of the schools and districts in which they worked. In particular, I obtained Ohio teachers’ education levels, salaries, specific job position and location within their school district, and value-added measures of school and district performance. Using a difference-in-differences design that compares teacher turnover and the performance trajectories of schools and districts, I was able to estimate whether districts experienced performance gains immediately after participation in the initial pilot in 2011 and immediately after the Plain Dealer’s publication of teachers’ scores.
The results indicate that schools that participated in the pilot experienced greater teacher turnover after 2010. Specifically, participating in this value-added pilot is associated with increases in teacher turnover of 1.24 percentage points beginning in 2011—a magnitude that increases to 5.07 by 2016. Additionally, I found higher average school-level achievement gains in test scores among schools that participated in the value-added teacher evaluation program. Specifically, in 2011, the average student in a participating school experienced the equivalent of almost 9 additional “days of learning” per year as compared to the average student in a school that did not participate. There was a similar bump of roughly 8 additional days of learning per year in 2014, immediately after the Cleveland Plain Dealer’s publication of teachers’ names and corresponding value-added scores. These findings suggest that districts that participated in this study may have taken action to remove teachers receiving low value-added scores, and through doing so, may have improved their average student performance. Similarly, it may be that the publication of teachers’ scores in 2013 led to poorly rated teachers leaving voluntarily. This carries interesting implications for the usage of value-added or other teacher evaluation measures in the future.
value-added metrics of teacher quality, and explain the decision by The Plain Dealer to make teachers’ scores publicly available. Second, I review the Ohio value-added pilot program that is the focus of this study. Third, I describe my data. Fourth, I detail the difference-in-differences research design and the statistical models I use to implement it. Finally, I review my results and discuss the implications for policy.
BACKGROUND
Information on teacher quality and performance has become increasingly relevant in the education sector as more research continues to support the notion that high-quality teachers can have an enduring positive influence over their students’ lives. Making this information public has also been shown to have particular benefits. Studies have shown that releasing value-added information can provide principals with previously unknown information on teachers’
performance levels, and thus foster within-district mobility for high-performing teachers and lead to low-performing teachers leaving the district (Bates, 2016; Cullen et al., 2017; Rockoff et al., 2012). In terms of student performance, research into the outcomes of a teacher evaluation program in D.C. Public Schools showed that the district was able to identify and replace low-performing teachers, which then led to increased student academic performance (Adnot et al., 2017).
This increase in student academic performance—i.e., test scores—could be caused by a plethora of factors. Perhaps low-rated teachers, out of reputation and image fears, become more likely to seek out advice and guidance from higher-rated teachers to improve their
performance—or they may exit the profession entirely (Benabou and Tirole 2006; Besley and Ghatak 2005; Jin and Leslie 2003; Jackson and Bruegmann 2009, Papay et al., 2016).
Additionally, teachers may work in private to improve themselves after receiving a low rating (Kolstad, 2013).
In recent years, multiple places across the country have publicized teacher performance information—including districts in Florida, New York, Los Angeles, and the focus of this particular study, Cleveland, Ohio. In June of 2013, the Cleveland Plain Dealer took bold action in the world of value-added. In collaboration with StateImpact Ohio (a journalistic organization associated with ideastream that reports on education in Ohio), they obtained data on individual teachers’ value-added scores. They decided to publish 4,200 teachers’ scores on their website – their argument being that they would include only those teachers for which there were two years of value-added data available, since there is variation in scores from year to year (O’Donnell, 2013). This database permits users to search by teachers’ last name, district, school, and rating (Exner, 2013). It is open and free for public access. Figure 1 in the Appendix shows what the searchable database looks like to users, and how its drop-down search function operates.
The Plain Dealer described this publication as an effort to help parents, suggesting that value-added provides another source besides the “parent grapevine” for finding the optimal teacher and classroom environment for your child (O’Donnell, 2013). They summarize their rationale for the publication by saying:
“Plain Dealer and StateImpact editors said they considered those concerns2 but decided
it was more important to provide information—even if flawed—to help parents
understand their children’s education and for the public to better understand a measure
2 “Concerns” here referring to teachers’ fears about their scores becoming public—the Plain Dealer included a quote from a fourth-grade language arts and social studies teacher who called the publishing act “scary” and described her fears that this would create a “stigma” in the community toward teachers who received low scores (O’Donnell, 2013).
increasingly used by the state and school districts” (O’Donnell, 2013).
This publication decision incited a national uproar, contributing to a larger ongoing discourse about the publication of teacher evaluations. The Washington Post picked up the story from Cleveland and wrote a strong response against the Plain Dealer’s decision, commenting that value-added has so many issues tangled up in it that “the results are far too questionable to be used for high-stakes decisions – or for publishing in a newspaper as if they actually have great meaning,” going on to say that “the very act of publishing…imbues the ratings with more validity than they deserve” (Strauss, 2013). This mirrors similar backlash that occurred in other places across the country, including Los Angeles and New York City.
When the L.A. Times published its own statistical analysis ranking of L.A. teachers in 2010, hundreds of teachers from the L.A. Unified School District turned out at the L.A. Times to protest; the President of their teachers union made a statement declaring, outraged, that “teachers are more than a test score” (Lopez, 2010). On the other hand, the federal Secretary of Education at the time, Arne Duncan, praised the L.A. Times’s decision—declaring that “silence is not an option” on the subject of the public having the right to know their teachers’ effectiveness levels (Lopez, 2010). When New York City took similar action in 2012 and released the ratings of nearly 18,000 New York City teachers, teachers felt attacked; the chancellor of the State Board of Regents at that time, Merryl H. Tisch, released a statement saying that “from every
perspective, it sets the wrong tone moving forward” (Santos and Gebeloff, 2012).
Some academic researchers have taken a stance against the publishing of these scores as well. Darling-Hammond et al. (2011) wrote a detailed report for a Capitol Hill research briefing which summarizes issues with relying too much upon value-added models of teacher
effectiveness—including the instability in ratings from year to year (or even from test to test) as well as the large differences caused by the nature of randomness involved in the student pools assigned to each teacher from year to year (Darling-Hammond et al., 2011). The RAND
Corporation released a research brief in 2004 that discusses similar issues, including how failure to control for variation in individual student characteristics and school composition, as well as failure to control for external effects such as the quality of prior teachers, has an impact on teachers’ value added estimates (“The Promise and Peril,” 2004).
While some researchers have studied the resulting effects of publishing teacher performance information in other places (see Bergman and Hill, 2015; Imberman and
Lovenheim, 2016; Pope, 2017), to my knowledge, no study has ever tracked or investigated the lasting effects of the Plain Dealer’s publication. In this project, I returned to this issue nearly four years after it reached its peak (it occurred in June of 2013, and I conducted my analysis
throughout the years 2016 – 2017). I sought to examine the aftermath created by the Plain Dealer’s publication decision in education in Ohio—looking at districts and schools that
contained teachers who had their scores published, and the resulting changes that occurred when treating the publication of scores as an exogenous shock to the system.
OHIO’S PILOT PROGRAM
In 2011, the state of Ohio decided to launch a pilot program to calculate teachers’ value-added. This was done in order to aid in management of school districts, and was paired with support for districts to help them understand how to use this information. As the program was only in its beginning stages, it was open for districts interested in getting more information on the effectiveness of their teachers to volunteer to participate. The results of this program were
never intended to be made public.
Teachers’ value-added ratings were estimated based upon their students’ academic progress on the Ohio Achievement Assessment up to 2012, taking account of up to five prior years in students’ test score histories. Ohio hired a company called SAS Institute Inc. to calculate value-added, which they did by using its regression-based Education Value-Added Assessment (EVASS)3 technique. Value-added was calculated only for math and reading teachers in grades four through eight. The Plain Dealer was careful to note that Ohio’s value-added ratings did not take the socioeconomic backgrounds of students into account, an aspect of value-added
calculation that is done in other states (O’Donnell, 2013).4 However, controlling for multiple prior years of student test scores largely makes this unnecessary. In a white paper they released detailing their calculation methods, SAS describes value-added models as seeking to “measure the amount of growth a group of students is making and [attribute] it up to the district school or teacher level” (SAS Institute Inc., pg. 3).
They had two general types of value-added models that their EVAAS system provided, both of which were made up of district-, school-, and teacher-level reports (SAS Institute Inc.). One of these models was a Multivariate Response Model (MRM), which they used for tests given in consecutive grades since these occur frequently in math and reading in grades three through eight (SAS Institute Inc., pg. 3). They sum up the MRM model, conceptually, by saying
3 See Amrein-Beardsley (2008) for a critique of the EVAAS system – issues touched upon in this paper include the insufficient user-friendliness in explaining the measure, calculation problems created by missing data, regression to the mean, and the omission of students’ background and demographic variables.
4 This is a particularly controversial decision – see Figure 2 in the Appendix for percentages of published teachers considered “Effective” (that is, those who received either an Average, Above Average, or Most Effective rating) in each district type. Suburban districts have the highest percentage of publicized teachers designated as effective, and urban districts have the lowest percentage of publicized teachers designated as effective. This brings into question the true nature of differences that are picked up in the value-added calculation method; perhaps these differences are driven, at least in part, by socioeconomic status and the opportunity gaps faced by students in these different district types.
it is essentially answering the question, “did a group of students maintain the same relative position with respect to statewide student achievement from one year to the next for a specific subject and grade?” (SAS Institute Inc., pg. 4). The MRM model used normal curve
equivalents—that is, they converted scaled test scores to a normal distribution in order to be able to meaningfully compare differences in academic achievement from year to year (SAS Institute Inc., pg. 6). For teacher value-added specifically, SAS used what they call a “layered” model that considered current and previous teacher effects, all the students’ testing data over the years, and the percentage of instructional responsibility that a teacher had for each student to accommodate scenarios like team teaching (SAS Institute Inc., pg. 10). Estimates for teacher effects were obtained by best linear unbiased prediction or empirical Bayesian estimation, meaning that they considered each teacher to be average—having a teacher effect of zero—until there is sufficient student data to indicate the contrary; ideally, this protects against false positives and false negatives, especially for teachers who had very few students (SAS Institute Inc., pg. 11). This model was the focus of teacher evaluations.
The other model was a Univariate Response Model (URM), which they used when a test is given in non-consecutive grades; it can also be used for any type of testing scenario (SAS Institute Inc., pg. 3). The URM was used more to contribute to a district’s or school’s value-added calculation, rather than a teacher’s calculation.5 The five teacher value-added score designation options were as follows, ranging from lowest to highest:
1. Least Effective 2. Approaching Average 3. Average
5 Due to the complex nature of SAS Institute Inc.’s calculations, I am not able to fully describe all of the methodology used in calculating each sect of value-added. For additional details, please see their full white paper, as cited in the text.
4. Above Average
5. Most Effective
DATA
I downloaded each of the 4,200 teacher observations from the Plain Dealer’s open database, which included each teacher’s full name, district, school, and their value-added rating (Exner, 2013). I also obtained a dataset containing all of the information over time on individual Ohio teachers’ specific characteristics for the years 2009 – 20176. This dataset includes
information such as each teacher’s staff ID code, gender, race, district name, building name, salary, highest level of education obtained (i.e. Bachelor’s vs. Master’s degree) and more for each year. I merged the sample of 4,200 teachers and their value-added scores that were published in June of 2013 by The Cleveland Plain Dealer into this master dataset7.
I also merged in information on district characteristics that I obtained from the Ohio Department of Education’s online resources, including whether a district is urban, rural, or suburban, as well as information on the student population and poverty levels within that particular district type. I also added in data on demographics and building- and district-level value-added from Lavertu and St. Clair (2017). One of these datasets contained information from 2007 – 2015 on buildings’ average value-added “gains” in math, reading, and overall for each year.
I consider “treated” buildings or districts to be those that participated in the value-added pilot program. Specifically, I generated indicator variables for those buildings and districts that
6 I received confirmation that this data was approved to be shared publicly outside of the agency by Data Managers at the Ohio Department of Education, and can provide evidence from my correspondence with ODE to prove this if needed.
7 This merge had a high success rate, with only 7 unmatched observations. When only looking at full-time teachers, this drops to 3,841 observations, which is still a sizable treatment group.
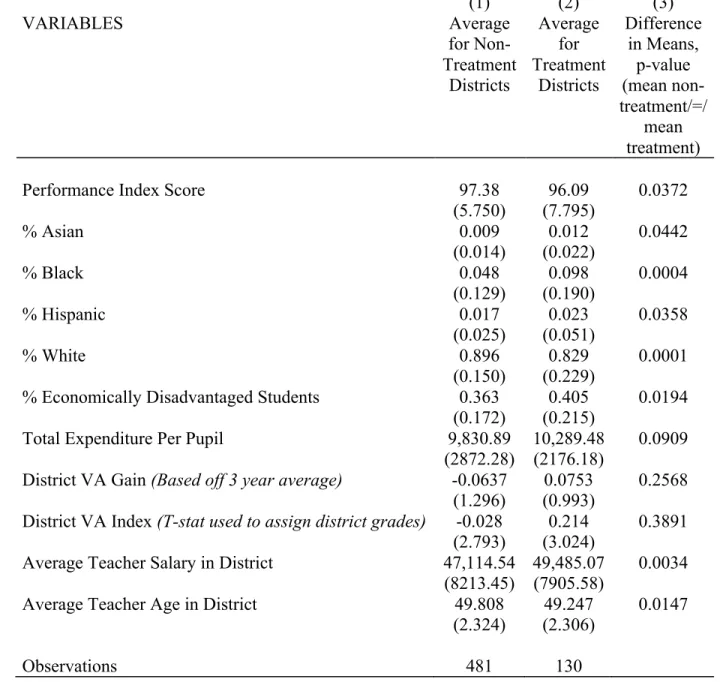
had at least one teacher included in the Cleveland Plain Dealer’s publication and study. Table 1 provides profiles of treatment and non-treatment districts from the year 2010, before the value-added program launched—comparing the performance index score8, percentages of particular racial groups, percentage of economically disadvantaged students, total expenditure per pupil, district value-added gain9, district value-added index10, average age of a teacher in the district, and the average teacher salary in the district. The table also contains p-values from doing a difference-in-means test for each category to calculate the probability that the mean for the non-treatment districts is not statistically different than the mean for the non-treatment districts.
As shown in Table 1, there seem to be significant differences in terms of district demographics—performance index score, racial demographic percentages, percentage of economically disadvantaged students, and average district teacher salary and age are all significant at the α = 0.05 significance level for a two-tailed test. However, there is no
statistically significant difference in terms of student achievement gains from year to year for treatment and non-treatment districts. The educational effectiveness of the districts (as measured by districts’ value-added gains and value-added index) appears to be comparable, as these p-values are not significant at the α = 0.05 significance level. Total expenditure per pupil is also not significant at this level. These differences in district demographics do not matter to my statistical design, however, as difference-in-differences requires common trends before a treatment is applied, and not common levels.
8 The performance index score is one of ten graded measures used by the Ohio Department of Education to create report cards for schools and districts. It is based upon student performance on the Ohio
Achievement Tests in grades 3 through 8, and the Ohio Graduation Test in grade 10. Scores range from 0 to 120, with 100 being the goal.
9 A district’s value-added estimate, based off of three-year averages. 10 A t-statistic used to assign a grade/designation to districts.
[Insert Table 1 here.]
TEACHER TURNOVER ANALYSIS
I employ a difference-in-differences design, comparing student learning and teacher turnover in district buildings that did and did not participate in the value-added pilot program. The design requires common trends between the treatment and control groups—essentially, if the publication of certain teachers’ value-added scores had not happened in these buildings and districts, these buildings and districts would have continued on in similar trajectories. Thus, the analysis compares student learning and teacher turnover before the 2011 pilot (to examine the plausibility of the common trends assumption) and after the pilot began (to estimate the impact of participation in the pilot). I implement this research design with the following OLS regression:
𝑇𝑢𝑟𝑛𝑜𝑣𝑒𝑟2010!" = 𝛽! 𝐵𝑙𝑑𝑔𝑃𝑎𝑟𝑡𝑖𝑐𝑖𝑝𝑎𝑡𝑖𝑜𝑛!∗𝜆! + 𝛼! + 𝜆! + 𝑒!" !"#$
!!!""#
(where t ≠2010)
In this equation, 𝑇𝑢𝑟𝑛𝑜𝑣𝑒𝑟2010!" indicates the proportion of teachers in building b in year t who were (or would be) in building b in 2010. Thus, 𝑇𝑢𝑟𝑛𝑜𝑣𝑒𝑟2010!" equals 0 for all b if t = 2010, and either 0 or a fraction between 0 and 1 in other building-years. 𝛽!is the coefficient on the interaction term between a variable indicating whether (1) or not (0) a building
participated in the pilot program in 2011 (𝐵𝑙𝑑𝑔𝑃𝑎𝑟𝑡𝑖𝑐𝑖𝑝𝑎𝑡𝑖𝑜𝑛!) and year fixed effect (𝜆!) for all years except 2010. The value of the 𝛽! coefficients represents how much more or less turnover (on average since 2010) treatment buildings had as compared to non-treatment buildings for each
year. 𝛼!captures building fixed effects, 𝜆!captures time (year) fixed effects, and 𝑒!" is the idiosyncratic error term. I estimated these models with standard errors clustered at the district level to account for the correlation in observations within districts over time.
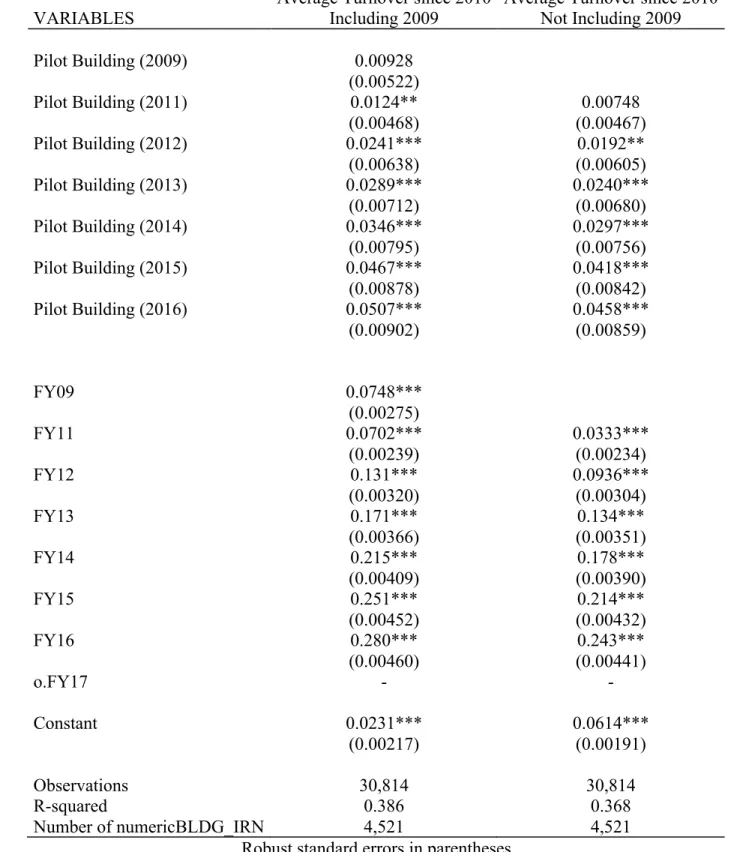
Table 2 displays the results of this regression. As column 1 in the table indicates, treatment schools experience greater teacher turnover after the pilot. Specifically, beginning in 2011, teachers were more likely to have left a building by a magnitude of 1.24 percentage
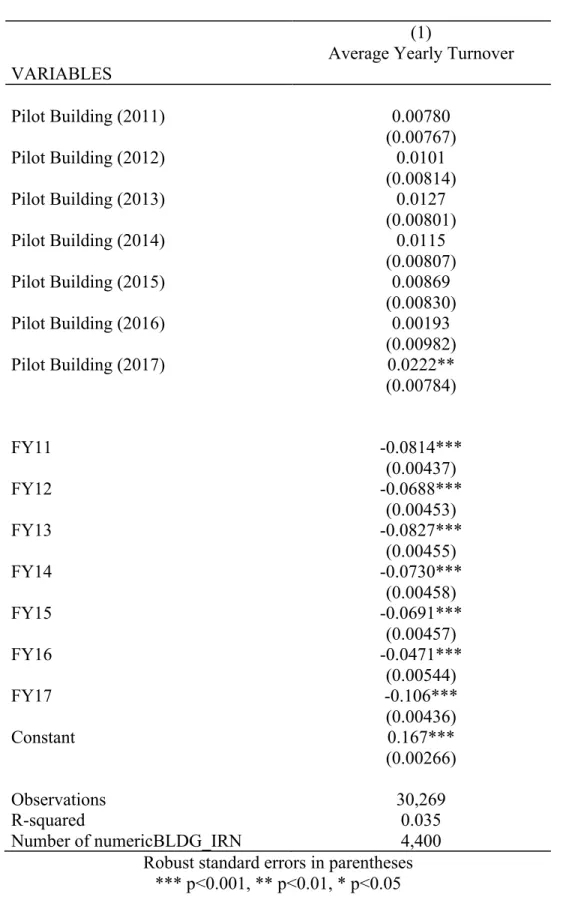
points—a magnitude that increases to 5.07 by 2016. Importantly, column 1 also indicates that the coefficient for 2009 is not statistically significant, which helps to validate the difference in differences design. Nevertheless, to better control for any minor pre-treatment imbalances and to enhance the precision of the estimates, column 2 employs both 2009 and 2010 as a baseline. The results remain nearly identical, although the turnover effects become statistically significant beginning in 2012. Overall, these results provide convincing evidence that participation in the pilot study is associated with an increase in teacher turnover. However, as an analysis of year-to-year turnover indicates (see Table 3), there are no discernable jumps in turnover when the pilot began (2011) or when the Plain Dealer released the estimates (2013).
[Insert Table 2 and Table 3 about here.]
I next examined how individual teachers’ value-added scores—thus, their effectiveness levels—related to these turnover rates. Specifically, limiting the analysis to buildings that participated in the pilot, I examine whether teachers rated as ineffective were more likely to leave than those that were not using the following OLS model:
𝑇𝑢𝑟𝑛𝑜𝑣𝑒𝑟2010!" = 𝛽! 𝐼𝑛𝑒𝑓𝑓𝑒𝑐𝑡𝑖𝑣𝑒!∗𝜆! + 𝛼! + 𝜆! + 𝑒!" !"#$
!!!""#
(where t ≠2009, 2010)
𝑇𝑢𝑟𝑛𝑜𝑣𝑒𝑟2010!" indicates the proportion of teachers in a building who received a rating in 2011 who are no longer in the same building in year t, as they were in 2010. The variable
𝐼𝑛𝑒𝑓𝑓𝑒𝑐𝑡𝑖𝑣𝑒! indicates the number of teachers in a building who received a rating that indicates
they are ineffective (a score of Least Effective or Approaching Average, as compared to
effective ratings of Average, Above Average, and Most Effective) as a proportion of all teachers in the building who received a rating. Thus, 𝛽! indicates how much more or less turnover (on average since 2010) buildings with low-rated teachers experienced as compared to buildings with high-rated teachers.𝛼!captures building fixed effects, 𝜆!captures time (year) fixed effects, and
𝑒!" is the idiosyncratic error term. I estimated these models with standard errors clustered at the teacher level to account for the correlation in observations within teachers over time.
[Insert Table 4 about here.]
Table 4 presents the results. The results indicate that buildings with a higher proportion of teachers with low value-added scores experienced more turnover. Specifically, buildings with poorly rated teachers in 2010 experienced greater turnover by a magnitude of over 7 percentage points than those with high value-added scores. Importantly, as column 2 indicates, there are noteworthy jumps in the year-to-year turnover probabilities in 2013 and 2014, although these estimates do not quite attain conventional levels of statistical significance (p = 0.073 and p =
0.146, respectively). These results leave open the question of whether the publication of teacher quality estimates—or the actions of administrators—were the cause for this increased turnover.
SCHOOL EFFECTIVENESS ANALYSIS
The results of the analysis above indicate that buildings that participated in the pilot experienced greater teacher turnover, which appears to have been driven by the turnover of teachers receiving low value-added scores. From here, I sought to determine whether this turnover led to any changes in students’ academic performance. To do this, I examined
differences in building-level, annual student achievement gains for treatment and non-treatment buildings using the following OLS regression model:
𝐴𝑣𝑔𝑇𝑜𝑡𝑎𝑙𝐵𝑢𝑖𝑙𝑑𝑖𝑛𝑔𝐺𝑎𝑖𝑛𝑠!" = 𝛽! 𝐵𝑙𝑑𝑔𝑃𝑎𝑟𝑡𝑖𝑐𝑖𝑝𝑎𝑡𝑖𝑜𝑛!∗𝜆! + 𝛼! + 𝜆! + 𝑒!" !"#$
!!!""#
(where t ≠2010)
In this equation, 𝐴𝑣𝑔𝑇𝑜𝑡𝑎𝑙𝐵𝑢𝑖𝑙𝑑𝑖𝑛𝑔𝐺𝑎𝑖𝑛𝑠!" indicates the average building-level value-added growth in building b and year t. 𝛽!is the coefficient on the interaction term between a variable indicating whether (1) or not (0) a building participated in the pilot program in 2011 (𝐵𝑙𝑑𝑔𝑃𝑎𝑟𝑡𝑖𝑐𝑖𝑝𝑎𝑡𝑖𝑜𝑛!) and year fixed effect (𝜆!) for all years except 2010. The values of the 𝛽! coefficients represent the difference in average value-added gains (calculated based upon changes in students’ test scores) that treatment buildings experienced as compared to
non-treatment buildings for all years except 2010. 𝛼!captures building fixed effects, 𝜆!captures time (year) fixed effects, and 𝑒!" is the idiosyncratic error term. I estimated these models with
standard errors clustered at the district level to account for the correlation in observations within districts over time.
[Insert Table 5 about here.]
Table 5 contains the results of this regression. When including 2009 in the variable list for the regression, as shown in column 1, the results do not quite attain conventional levels of statistical significance. To enhance statistical power, I again omit 2009 with 2010 as the baseline category. When doing this in column 2, there is a statistically significant value-added effect for treatment buildings as compared to non-treatment buildings in the years 2011 and 2014 (both at the 0.05 significance level). These two years are important in the context of my study—fiscal year 2011 was the year that the pilot program was introduced in the state of Ohio, and fiscal year 2014 was the school year that immediately followed the Plain Dealer’s publication of Ohio teachers’ individual value-added scores.
In Table 6 I re-scaled these average building value-added gain estimates from Normal Curve Equivalent (NCE) units to standard deviations in student-level gains. Thus, I can see how many more or fewer standard deviation gains a treatment building’s average student has
compared to the average student in a non-treatment building in the state of Ohio. As shown in this table, in 2011, the average student in a treatment building experienced annual achievement gains that were roughly 0.017 standard deviations greater than the average student in a non-treatment building in the state of Ohio. In 2014, the average student in a non-treatment building experienced annual achievement gains that were roughly 0.0148 standard deviations greater than the average student in a non-treatment building in the state of Ohio.
Working off of research that has shown that students in grades 3 – 8 increase their achievement in math and reading by an average of 0.37 standard deviations per year,11 and also assuming that a standard school year is composed of 180 days, these standard deviations have more meaning. In 2011, the average student in a treatment building experienced the equivalent of almost 9 additional “days of learning” per year as compared to the average student in a non-treatment building12. In 2014, the average student in a treatment building experienced the
equivalent of almost 8 additional “days of learning” per year as compared to the average student in a non-treatment building13.
The overall implications of these findings, when taken together, suggest that those buildings that participated in the state of Ohio’s pilot program may have decided to remove teachers who received low value-added scores, and the effect of this may have been to actually improve the average student’s performance in their buildings. It is also important to note that these effects that I observed may have nothing to do with the Cleveland Plain Dealer’s
publication of these teachers’ value-added scores, but rather with these teachers, buildings, and districts choosing to participate in the pilot program; however, it is also worthy of mention that there was a second instance of a statistically significant difference between treatment and non-treatment buildings in the building value-added regression in 2014, which was directly after the Plain Dealer’s actions took place.
LIMITATIONS
The analysis has some limitations. Perhaps most importantly, the only specific
11 See Hill et al., 2008 as cited at the close of this paper for details on where this figure comes from. 12 Calculation as follows: 180 days = 0.37 standard deviations, so 1 day = 0.0019 standard deviations. In 2011, they had 0.017 more standard deviations. 0.017/0.0019 = 8.9 days
information from an individual who worked on the pilot program that I was able to obtain was the following, through email correspondence:
“This group of teachers were from districts participating in the 2011-12 pilot program of the Ohio Teacher Evaluation System (OTES). There were 139 districts that volunteered to be in the pilot. All districts and community schools had the opportunity. I am not sure of the specifics of how teachers within those districts were selected. I think that was also voluntary for the most part.”14
I was unable to obtain any more detailed information on how the pilot program on teacher evaluation was being implemented at that time, beyond the fact that the program first launched in the 2010-2011 school year (where 6,300 teachers had their value-added scores calculated) and these numbers then increased to over 16,000 teachers in the 2011-2012 school year, followed by a complete increase to calculating it for all math and reading teachers from then on (O’Donnell, 2013). However, the common trends assumption was met based upon pre-treatment comparisons, so it does not appear that there is anything fundamentally different between districts that did and did not participate. Thus, despite being uncertain of how individual teachers were evaluated, it appears unlikely that the modeling assumptions were violated.
Additionally, I cannot be certain that the results that I observed are traceable back to the Plain Dealer’s publication rather than from some other factor I am not taking into consideration in this study. Perhaps the act of volunteering from buildings and districts that participated in this pilot program was a signal of a desire to take initiative and make improvements. Therefore, the higher turnover and improvement in buildings’ value-added that I observed in treatment
buildings may be a result of self-selection bias of buildings that were already about to start working to improve their student achievement levels and to remove their poorer performing teachers, regardless of any publication of scores. It is very important to note that any effects that I observed may have nothing to do with the publishing of these teachers’ scores, but rather with their choosing to participate in the program in the first place. That said, the timing of the effects, as well as the correspondence between turnover and improvements in student learning, are highly suggestive.
CONCLUSION
As much research has shown, an effective teacher can make a great deal of difference for their students in terms of both academic performance and life outcomes. Determining the
effectiveness of a teacher in terms of their “value-added” on students’ test scores has become a task that many places have attempted to take on, from Los Angeles, to New York City, to Cleveland. This has created a national discussion on the ethics and usefulness of knowing a particular teacher’s value-added score.
The state of Ohio piloted a teacher evaluation program using value-added metrics in 2011, and while a handful of studies have examined the effects of publishing teachers’ value-added scores, to my knowledge, there has yet to be a study looking into the effects of the Plain Dealer’s publishing of Ohio teachers’ value-added scores in 2013. Thus, I sought to compare particular outcome variables between treatment and non-treatment places in Ohio to study whether using value-added can improve student learning and school performance.
The results of this study indicate that after the pilot, treatment schools experience greater teacher turnover. Starting in 2011, teachers were more likely to have left a treatment building by
1.24 percentage points, and by 2016, this increases to 5.07 percentage points. (However, when examining year-to-year turnover, there are no notable changes in turnover at the start of the pilot in 2011 or when the Plain Dealer released teachers’ value-added scores in 2013.) In addition to this, the results show that buildings with a higher proportion of teachers with low value-added scores experienced higher turnover rates. These schools with poorly rated teachers in 2010 experienced greater turnover by over 7 percentage points than those with high value-added scores. When looking at differences in year-to-year turnover, there are discernable jumps in 2013 and 2014 (even though these are not quite at the conventional statistical significance level).
In conjunction with these results, schools that participated in the pilot achieved higher student performance gains than those that did not. In 2011, the average student in a participating school out-performed the average student in a non-participating school on academic assessments to such a degree that it was as if the student had experienced the equivalent of almost 9
additional “days of learning” per year. Similarly, in 2014, the average student in a treatment school experienced the equivalent of almost 8 additional “days of learning” per year as compared to the average student in a non-treatment school.
These findings suggest that buildings that took part in the value-added measurement program may have removed teachers who received low value-added scores, and by doing so, may have improved their students’ average academic performance. While both remaining aware of this study’s limitations as well as considering similar findings of other researchers, in the broader context of education policy, this may suggest that the evaluation and information dispersal of teachers’ value-added is beneficial for students and schools on the whole. This carries interesting implications for policymakers in the use of value-added or other teacher evaluation measures in the future.
Table 1: District Profiles for 2010 (1) (2) (3) VARIABLES Average for Non-Treatment Districts Average for Treatment Districts Difference in Means, p-value (mean non-treatment/=/ mean treatment)
Performance Index Score 97.38 96.09 0.0372
(5.750) (7.795) % Asian 0.009 0.012 0.0442 (0.014) (0.022) % Black 0.048 0.098 0.0004 (0.129) (0.190) % Hispanic 0.017 0.023 0.0358 (0.025) (0.051) % White 0.896 0.829 0.0001 (0.150) (0.229)
% Economically Disadvantaged Students 0.363 0.405 0.0194
(0.172) (0.215)
Total Expenditure Per Pupil 9,830.89 10,289.48 0.0909
(2872.28) (2176.18)
District VA Gain (Based off 3 year average) -0.0637 0.0753 0.2568 (1.296) (0.993)
District VA Index (T-stat used to assign district grades) -0.028 0.214 0.3891 (2.793) (3.024)
Average Teacher Salary in District 47,114.54 49,485.07 0.0034 (8213.45) (7905.58)
Average Teacher Age in District 49.808 49.247 0.0147
(2.324) (2.306)
Table 2: Average Turnover since 2010, Individual Building Level
(1) (2)
Average Turnover since 2010 Average Turnover since 2010
VARIABLES Including 2009 Not Including 2009
Pilot Building (2009) 0.00928 (0.00522) Pilot Building (2011) 0.0124** 0.00748 (0.00468) (0.00467) Pilot Building (2012) 0.0241*** 0.0192** (0.00638) (0.00605) Pilot Building (2013) 0.0289*** 0.0240*** (0.00712) (0.00680) Pilot Building (2014) 0.0346*** 0.0297*** (0.00795) (0.00756) Pilot Building (2015) 0.0467*** 0.0418*** (0.00878) (0.00842) Pilot Building (2016) 0.0507*** 0.0458*** (0.00902) (0.00859) FY09 0.0748*** (0.00275) FY11 0.0702*** 0.0333*** (0.00239) (0.00234) FY12 0.131*** 0.0936*** (0.00320) (0.00304) FY13 0.171*** 0.134*** (0.00366) (0.00351) FY14 0.215*** 0.178*** (0.00409) (0.00390) FY15 0.251*** 0.214*** (0.00452) (0.00432) FY16 0.280*** 0.243*** (0.00460) (0.00441) o.FY17 - - Constant 0.0231*** 0.0614*** (0.00217) (0.00191) Observations 30,814 30,814 R-squared 0.386 0.368 Number of numericBLDG_IRN 4,521 4,521
Robust standard errors in parentheses *** p<0.001, ** p<0.01, * p<0.05
Table 3: Yearly Turnover
(1)
Average Yearly Turnover VARIABLES Pilot Building (2011) 0.00780 (0.00767) Pilot Building (2012) 0.0101 (0.00814) Pilot Building (2013) 0.0127 (0.00801) Pilot Building (2014) 0.0115 (0.00807) Pilot Building (2015) 0.00869 (0.00830) Pilot Building (2016) 0.00193 (0.00982) Pilot Building (2017) 0.0222** (0.00784) FY11 -0.0814*** (0.00437) FY12 -0.0688*** (0.00453) FY13 -0.0827*** (0.00455) FY14 -0.0730*** (0.00458) FY15 -0.0691*** (0.00457) FY16 -0.0471*** (0.00544) FY17 -0.106*** (0.00436) Constant 0.167*** (0.00266) Observations 30,269 R-squared 0.035 Number of numericBLDG_IRN 4,400
Robust standard errors in parentheses *** p<0.001, ** p<0.01, * p<0.05
Table 4: Turnover, by Ineffectiveness of Teachers15
(1) (2)
Turnover since 2010 Year-to-Year Turnover
VARIABLES By Effectiveness By Effectiveness
Ineffective_11 0.0232 0.00907 (0.0119) (0.0166) Ineffective_12 0.0433** -0.00620 (0.0140) (0.0155) Ineffective_13 0.0630*** 0.0314 (0.0164) (0.0175) Ineffective_14 0.0740*** 0.0264 (0.0184) (0.0182) Ineffective_15 0.0757*** 0.00550 (0.0198) (0.0181) Ineffective_16 0.0767*** 0.00259 (0.0206) (0.0194) Ineffective_17 0.0190 0.0134 (0.0183) (0.0191) FY11 0.0311*** -0.0520*** (0.00510) (0.00741) FY12 0.0655*** -0.0739*** (0.00601) (0.00708) FY13 0.118*** -0.0417*** (0.00717) (0.00773) FY14 0.170*** -0.0364*** (0.00810) (0.00788) FY15 0.209*** -0.0422*** (0.00887) (0.00820) FY16 0.235*** -0.0288*** (0.00933) (0.00856) FY17 0.656*** -0.0650*** (0.00940) (0.00801) Constant 0.0438*** 0.120*** (0.00394) (0.00477) Observations 27,045 25,354 R-squared 0.226 0.009 Number of numericSTAFF_ID 3,647 3,647
15 Here, “Ineffective” refers to those teachers given a Least Effective or Approaching Average value-added rating.
Table 5: Average Total Gains on Building Level
(1) (2)
Average Total Gains Average Total Gains
VARIABLES Including 2009 Not Including 2009
Pilot Building (2009) -0.0305 (0.238) Pilot Building (2011) 0.351 0.357* (0.186) (0.166) Pilot Building (2012) 0.0552 0.0615 (0.171) (0.169) Pilot Building (2013) 0.0295 0.0359 (0.187) (0.158) Pilot Building (2014) 0.307 0.312* (0.200) (0.145) Pilot Building (2015) 0.364 0.371 (0.448) (0.437) o.Pilot Building (2016) - - o.Pilot Building (2017) - - FY09 1.777*** (0.0884) FY11 0.0838 -0.789*** (0.0974) (0.0838) FY12 0.397*** -0.476*** (0.114) (0.102) FY13 0.320** -0.552*** (0.0978) (0.0808) FY14 0.189 -0.684*** (0.101) (0.0858) FY15 -0.229 -1.102*** (0.178) (0.172) o.FY16 - - o.FY17 - - Constant -0.0277 0.848*** (0.0620) (0.0442) Observations 17,880 17,880 R-squared 0.062 0.020 Number of numericBLDG_IRN 2,953 2,953
Robust standard errors in parentheses *** p<0.001, ** p<0.01, * p<0.05
Table 6: Average Standard Deviation Gains on Building Level
(1) (2)
Average SD Average SD
VARIABLES Including 2009 Not Including 2009
Pilot Building (2009) -0.00145 (0.0113) Pilot Building (2011) 0.0166 0.0170* (0.00882) (0.00787) Pilot Building (2012) 0.00262 0.00292 (0.00811) (0.00801) Pilot Building (2013) 0.00140 0.00170 (0.00890) (0.00752) Pilot Building (2014) 0.0146 0.0148* (0.00951) (0.00687) Pilot Building (2015) 0.0173 0.0176 (0.0213) (0.0208) o.Pilot Building (2016) - - o.Pilot Building (2017) - - FY09 0.0844*** (0.00420) FY11 0.00398 -0.0374*** (0.00462) (0.00398) FY12 0.0188*** -0.0226*** (0.00540) (0.00482) FY13 0.0152** -0.0262*** (0.00464) (0.00384) FY14 0.00897 -0.0325*** (0.00478) (0.00407) FY15 -0.0109 -0.0523*** (0.00846) (0.00818) o.FY16 - - o.FY17 - - Constant -0.00132 0.0403*** (0.00294) (0.00210) Observations 17,880 17,880 R-squared 0.062 0.020 Number of numericBLDG_IRN 2,953 2,953
REFERENCES
Adnot, M., Dee, T., Katz, V., & Wyckoff, J. (2017). Teacher Turnover, Teacher Quality, and Student Achievement in DCPS. Educational Evaluation and Policy Analysis, 39.1 (54-76).
Amrein-Beardsley, A. (2008). Methodological concerns about the education value-added assessment system. Educational Researcher, 37.
Bates, M. (2016). Public and private learning in the market for teachers: Evidence from the adoption of value-added measures. University of California, Riverside Working Paper.
Benabou, R. & Tirole, J. (2003). Intrinsic and extrinsic motivation. The Review of Economic Studies, 70.3 (489-520).
Bergman, P. & Hill, M. (2015). The Effects of Making Performance Information Public: Evidence from Los Angeles Teachers and a Regression Discontinuity Design. CESifo Working Paper, 5383.
Besley, T. & Ghatak, M. (2008). Status incentives. The American Economic Review, 98.2 (206-211).
Chetty, R., Friedman, J. N., & Rockoff, J.E. (2013). Measuring the Impacts of Teachers II: Teacher Value-Added and Student Outcomes in Adulthood. National Bureau of Economic Research Working Paper, 19424.
Cullen, J.B., Koedel, C., & Parsons, E. (2017). The Compositional Effect of Rigorous Teacher Evaluation on Workforce Quality. National Bureau of Economic Research Working Paper, 22805.
Darling-Hammond, L., Amrein-Beardsley, A., Haertel, E. H., & Rothstein, J. (2011). Getting Teacher Evaluation Right: A Background Paper for Policy Makers, Getting Teacher
Evaluation Right: A Challenge for Policy Makers, Dirksen Senate Office Building, Washington, D.C., 14 September 2011.
Deming, D. J. (2011). Better schools, less crime? The Quarterly Journal of Economics, 126.4.
Exner, R. (2013). “Find Ohio teacher ratings based on value added scores.” Cleveland.com.
Hanushek, E.A. (2011) The Economic Value of Higher Teacher Quality. Economics of Education Review, 30.
Hill, C. J., Bloom, H.S., Black, A. R., & Lipsey, M.W. (2008). Empirical Benchmarks for Interpreting Effect Sizes in Research. Child Development Perspectives 2 (3): 172-177.
Imberman, S. A. & Lovenheim, M. F. (2016). Does the Market Value Value-Added? Evidence from Housing Prices After a Public Release of School and Teacher Value- Added. Journal of Urban Economics, 91 (104-121).
Jackson, C. K. (2012). Non-Cognitive Ability, Test Scores, and Teacher Quality: Evidence from 9th Grade Teachers in North Carolina. National Bureau of Economic Research, 18624.
Jackson, C. K. & Bruegmann, E. (2009). Teaching students and teaching each other: The importance of peer learning for teachers. American Economic Journal: Applied Economics, 1.4 (85-108).
Jin, G. Z. & Leslie, P. (2003). The effect of information on product quality: Evidence from restaurant hygiene grade cards. The Quarterly Journal of Economics (409-451).
Kolstad, J. T. (2013). Information and Quality When Motivation Is Intrinsic: Evidence from Surgeon Report Cards. American Economic Review (2875-2910).
Lavertu, S. & St. Clair, T. (2017). Beyond Spending Levels: Revenue Uncertainty and the Performance of Local Governments. AEFP 42nd Annual Conference.
Lopez, R. J. (2010). “L.A. Unified teachers stage protest at Times building.” Los Angeles Times.
O’Donnell, P. (2013). “Why we decided to publish teachers’ names, value-added ratings.” The Plain Dealer.
Papay, J., Taylor, E., Tyler, J., Lanski, M. (2016). Learning job skills from colleagues at work: Evidence from a field experiment using teacher performance data. NBER Working Paper, 21986.
Pope, N. (2017). “The Effect of Teacher Ratings on Teacher Performance.” Draft. “The Promise and Peril of Using Value-Added Modeling to Measure Teacher
Effectiveness.” (2004). RAND Research Brief. RAND Corporation, Santa Monica, California. Rockoff, J. E. (2004). The impact of individual teachers on student achievement: Evidence from panel data. American Economic Review, 94.2.
Rockoff, J. E., Staiger, D. O., Kane, T. J., & Taylor, E. S. (2012). Information and Employee Evaluation: Evidence from a Randomized Intervention in Public Schools. American Economic Review, 102.7: (3184-3213).
Rivkin, S. G., Hanushek, E. A., & Kain, J. F. (2005). Teachers, schools, and academic achievement. Econometrica, 73.
Santos, F. & Gebeloff, R. “Teacher Quality Widely Diffused, Ratings Indicate.” The New York Times.
Strauss, V. (2013). “Should news organizations publish teachers’ value-added ratings?” The Washington Post.
West, M. R. & Chingos, M. M. (2009). Teacher effectiveness, mobility, and attrition in Florida. In M. G. Springer (Ed.), Performance incentives: Their growing impact on American K-12 education (251–271): Washington, DC: Brookings Institution Press.
APPENDIX
Figure 1: Images of Cleveland Plain Dealer’s Online Searchable Database of Teacher Value-Added Scores
Figure 2: Percent of “Effective”16 Publicized Teachers by District Type
16 Here, “Effective” refers to those teachers given an Average, Above Average, or Most Effective value-added rating.