1
Selecting the Ideal Windows for a High Performance Home in a Cold
Climate
Prepared by: Ari S. Rapport1
Abstract
As part of the U.S. Department of Energy’s (DOE) Building America (BA) Program research for developing and implementing zero energy homes on a widespread basis, IBACOS has
undertaken the task of identifying windows with appropriate performance characteristics for this level of energy efficient construction. While there are a growing number of window options available that meets either the energy savings or the pricing needs for this type of construction, finding a window with a combination of the right thermal properties and the right price is more difficult. This research focused on the process of identifying the best performing windows in a cold climate zone with specific consideration to their constructability, cost, and thermal performance. This paper reports on the favorite windows that emerged from the research and why they were chosen.
Key words: high performance, window, U-value, SHGC, fenestration, energy efficiency, cold climate zone, energy modeling, constructability, cost, thermal performance, Building America, zero energy
1
2
Introduction
As part of Building America (BA) research toward zero energy homes on a widespread basis, IBACOS is currently building a lab home in the Pittsburgh, PA region. This home is being designed to achieve a nominal 70% whole house source energy savings when compared to the BA Benchmark Definition (Hendron 2008) using an advanced thermal enclosure, LAMEL (Lighting, Appliances, and Miscellaneous Electrical Loads) upgrades, and mechanical system improvements. The home will use only electricity, which will be supplied by a photovoltaic system. To successfully achieve 70% energy savings, technical and process-oriented challenges had to be overcome to integrate the most efficient and available technologies at the most
affordable prices. The research presented in this paper is a thorough examination of relevant performance issues, constructability, availability, and pricing for windows.
The Pittsburgh lab home is a 2000 square feet, two-story, single-family house on an infill lot in a dense, urban neighborhood. The house is an elongated rectangle with the shorter elevations facing East-West and the longer elevations facing North-South. On the West elevation there is 82 square feet of rough window area; on the East elevation there is 77 square feet; the South
elevation has 157 square feet of rough window area; and there are no windows located on the North elevation. The windows are predominately single-hung models, along with several casement units.
The parameters for the ideal window product were first generated using the Window Selection Tool provided by the Efficient Windows Collaborative (EWC) website
(www.efficientwindows.org/selection.cfm). The selection tool indicated that the highest performing window available in the Pittsburgh area had a total unit U-value of 3.7 kJ/hr·m²·K
(0.18 BTU/hr·°F·ft2) and a total unit Solar Heat Gain Coefficient (SHGC) of 0.40. This window
was used as the performance benchmark for research into other available window products. According to the window selection tool, as window performance improves the effects of orientation and total glazing area on annual energy consumption become negligible. Although passive energy savings (and product cost savings) are likely available from “fine tuning” window performance by size and orientation to minimize energy consumption, this study simplified the comparative analysis by keeping constant the total unit U-values and SHGC ratings for all windows in each energy use simulation of the lab house; all window areas remained constant between simulations, as well.
For all comparative energy analyses and incremental cost calculations, the builder’s standard window was used as the base window; this window had a total unit U-Value of 6.7 kJ/hr·m²·K
(0.33 BTU/hr·°F·ft2)and a total unit SHGC of 0.30.
Evaluation
IBACOS developed a detailed system to evaluate the available window products and help to identify the best product for the lab home. Each window was ranked according to a set of “Must
Meet” and “Should Meet” criteria (Table 1) that resulted in a final numerical value, which was
used to select the most favorable window product. This system provided a comprehensive evaluation of each window that made sure the best product was chosen in the end.
3 Table 1: Evaluation Criteria for Window Selection
“Must Meet” Criteria “Should Meet” Criteria
• Minimum Energy Performance Specification
• Code Acceptance
• Market Availability of the Technical Solution
• Constructability
• Trade Skill Set Change
• Functionality
• Architectural Flexibility
• Scalability Potential
• Durability: Climate Appropriate Moisture
Management
• Cost vs. Energy Savings Ratio
• Homeowner Impact
• Systems Integration and
Elimination Potential
• Environmental Responsibility
• Cycle Time
• Durability and Maintenance
• Comfort
The evaluation process is divided into two stages—Initial Gate and Detailed Scoring. During the Initial Gate stage, the “Must Meet” criteria are evaluated using a “go/no go” decision. If a technical option is given a “no go” for any of the “Must Meet” criteria, then it does not go to the second stage of the evaluation. Any technical solutions that receive “go’s” for the entire “Must Meet” criteria advance to the more detailed second stage of the evaluation process.
During the Detailed Scoring stage, a technical solution is evaluated against “Must Meet” criteria and “Should Meet” criteria. The technical solution is given a ranking depending on how well it meets the requirements. Also in this stage, each criterion is assigned a weight value based on its importance. The rank of each technical solution is multiplied by this weight, resulting in a weighted ranking. The weighted rankings are totaled for each technical solution with the highest total score becoming the first system choice.
Initial Survey
Research began with the EWC, an organization of window and door manufacturers, suppliers, and non-industry affiliates that include trade associations, utilities, consultants, and government agencies. The EWC is a publicly and privately funded organization that offers comprehensive information on energy efficient windows and offers a Window Selection Tool to help identify suitable windows for a particular city or geographical region. This tool was used to identify windows that are available in Pittsburgh, and it provided a general comparison of energy use associated with the windows that were identified. It listed the windows with their thermal performance characteristics (U-value and SHGC) as rated by the National Fenestration Rating Council (NFRC).
With the list of window products provided by the EWC selection tool, window manufacturers were called to obtain information on local suppliers and pricing. Additional manufacturers were also contacted based on known market penetration, location of manufacturing facilities, and performance characteristics identified through additional searches on the NFRC website (www.nfrc.org). Overall, more than a dozen window manufacturers were contacted for
4
information on their windows. Of these, a small subset of manufacturers was identified who produce windows with performance ratings close to the specifications supplied by the EWC. It is important to note that this initial search for manufacturers was not exhaustive. There are many window manufacturers on the market, and a quick survey of the NFRC website will reveal hundreds. Therefore, the study was limited to some of the larger window manufacturers in the United States and Canada, in addition to a few smaller manufacturers.
From these phone calls and follow-up email correspondence, it appeared that the majority of the window manufacturers that had products meeting the EWC specifications were located in Canada or Europe. Surprisingly, most of the initial U.S. manufacturers questioned did not have windows with U-value and SHGC ratings close enough to the specified values to be considered for this project. This generated questions such as why is there such a difference in thermal performance between U.S. and Canadian windows (European windows were not considered for this research). And if this difference is real, why are U.S. manufacturers not encouraged to produce higher performing windows? Part of this phenomenon can be attributed to Canadian legislation that pushed the production of high performance windows, and part can be attributed to the extreme climate in much of Canada. While the answers to these questions are beyond the scope of this study, they still led to further investigation into the effect of U-value and SHGC on energy use in a cold climate building. What are the optimum U-value and SHGC ratings for windows in a cold climate, and specifically, what are the ideal performance ratings for windows for the Pittsburgh lab home?
To conduct this research, a model of the lab home was created in the EnergyGauge® USA
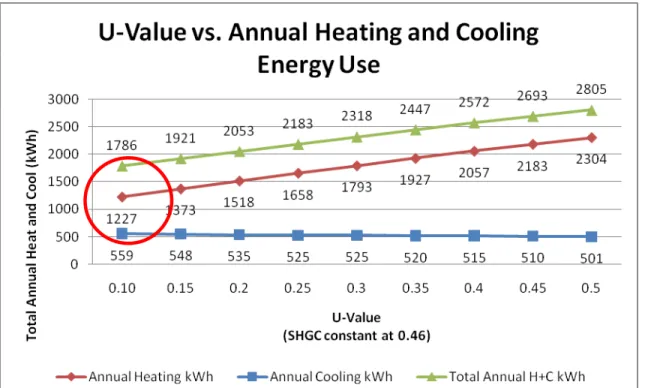
(version 2.8.01) software program, a program that is able to simulate annual energy use for a particular home design. This program was first used to generate the annual heating and cooling energy use of the model home with a range of U-values; SHGC values were held constant. The
5
Figure 1: U-Value vs. Annual Heating and Cooling Energy Use
As seen in the graphs, there is a clear correlation between the U-value and annual heating energy use, while annual cooling energy use appears largely independent of the U-value (annual cooling energy in fact slightly increases as the U-values decrease). This indicates that in a cold climate where heating energy use is dominant, changing the U-value plays a more significant role in the annual energy savings.
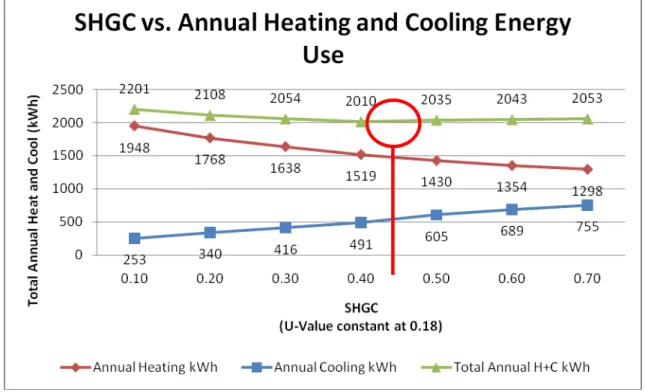
Annual energy use was then calculated for a range of SHGC values at a constant U-value. For
the SHGC study, the results were quite different. Figure 2 below shows a distinct decrease in
annual heating energy use as the SHGC value increases and a distinct increase in annual cooling energy use as the SHGC value increases.
6
Figure 2: SHGC vs. Annual Heating and Cooling Energy Use
The results shown above make sense, because SHGC is responsible for admitting solar gain through a window, which could offset cooling load in the summer but could reduce useful solar gain and increase heating load in the winter. What is interesting in this graph is the total heating and cooling energy use, which appear to dip to a low spot somewhere in the 0.35-0.50 SHGC range. This indicates the presence of an “ideal” SHGC value where total heating and cooling energy use is minimized. To pinpoint this ideal value, the 0.35 – 0.50 SHGC intervals were reduced, and EnergyGauge simulations were performed for each new set of values. When the
new graph (Figure 3) was generated the results indicated that the lowest total heating and
cooling energy use was 0.46 SHGC. This amount was assumed to be the ideal SHGC value for Pittsburgh.
It would be useful in future studies to perform the above SHGC optimization analysis using U-values from the high and low ends of the performance spectrum, to determine the impact (if any) of U-value on SHGC thermal performance. For this study, however, only one U-value variable was considered.
7
Figure 3: SHGC (0.35 – 0.50) vs. Annual Heating and Cooling Energy Use
Research and correspondence with U.S. window manufacturers revealed that available windows
rarely had higher SHGC values around 0.46 with lower U-values around 0.20 BTU/hr·°F·ft2 or
below. Only a few specialized window products met this specification. More common on the market were windows with either a higher U-value and higher SHGC, or a lower U-value and lower SHGC. Products with a lower U-value and higher SHGC were identified in Canada, but cost and a preference for locally available products ruled them out. The existence of these windows in Canada can be explained in part by the superior thermal properties of the Canadian window frames compared to the frames of the U.S. products that were surveyed. Canadian frames have integrated interstitial insulation materials that reduce the total unit U-value of the window. This difference appears to be a critical element in meeting lower U-values while maintaining higher SHGC properties, and it represents a major improvement area for U.S. windows.
A review of the initial energy use simulations indicated that significant energy savings could still be achieved by a window with a combination of a lower U-value and lower SHGC. This
combination could take advantage of both the higher heating energy savings potential that comes from reducing the U-value and the higher cooling energy savings potential that comes from reducing SHGC. It would also provide a more realistic standard for identifying existing window products in the U.S. market. As seen in Figures 1 and 2 above, the difference in annual space conditioning energy use from windows with a higher SHGC (0.40) and lower SHGC (0.20) is close to 100 kWh; however, the difference in annual space conditioning energy use from
windows with a lower U-value of 4.1 kJ/hr·m²·K (0.20 BTU/hr·°F·ft2) and a higher U-value of
7.2 kJ/hr·m²·K (0.35 BTU/hr·°F·ft2) is close to 400 kWh. Keeping the U-value lower is more
8
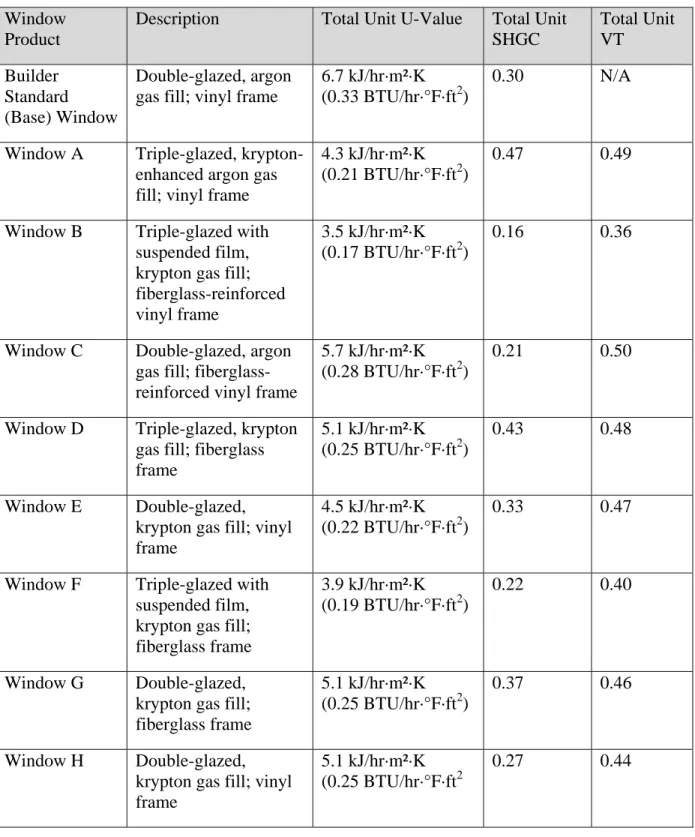
Table 2 below lists the performance characteristics of the windows that were evaluated beyond the Initial Gate stage for this study.
Table 2: Summary of Window Products in Study Window
Product
Description Total Unit U-Value Total Unit
SHGC Total Unit VT Builder Standard (Base) Window Double-glazed, argon gas fill; vinyl frame
6.7 kJ/hr·m²·K
(0.33 BTU/hr·°F·ft2)
0.30 N/A
Window A Triple-glazed,
krypton-enhanced argon gas fill; vinyl frame
4.3 kJ/hr·m²·K
(0.21 BTU/hr·°F·ft2)
0.47 0.49
Window B Triple-glazed with
suspended film, krypton gas fill; fiberglass-reinforced vinyl frame
3.5 kJ/hr·m²·K
(0.17 BTU/hr·°F·ft2)
0.16 0.36
Window C Double-glazed, argon
gas fill; fiberglass-reinforced vinyl frame
5.7 kJ/hr·m²·K
(0.28 BTU/hr·°F·ft2)
0.21 0.50
Window D Triple-glazed, krypton
gas fill; fiberglass frame
5.1 kJ/hr·m²·K
(0.25 BTU/hr·°F·ft2)
0.43 0.48
Window E Double-glazed,
krypton gas fill; vinyl frame
4.5 kJ/hr·m²·K
(0.22 BTU/hr·°F·ft2)
0.33 0.47
Window F Triple-glazed with
suspended film, krypton gas fill; fiberglass frame
3.9 kJ/hr·m²·K
(0.19 BTU/hr·°F·ft2)
0.22 0.40
Window G Double-glazed,
krypton gas fill; fiberglass frame
5.1 kJ/hr·m²·K
(0.25 BTU/hr·°F·ft2)
0.37 0.46
Window H Double-glazed,
krypton gas fill; vinyl frame
5.1 kJ/hr·m²·K
(0.25 BTU/hr·°F·ft2
9
The following sections capture the research conducted for all of the “Must Meet” criteria as part of the second stage of the evaluation process.
Minimum Energy Performance
Minimum energy performance is based on the annual energy use of the lab home with the builder standard window installed. EnergyGauge USA was used to establish an annual energy use for each window product based on its total unit U-value and SHGC. If the annual energy use for the window option was lower than the annual energy use for the base window, the minimum energy
performance requirement was met. Every window in Table 2 above fulfilled this minimum
performance requirement.
Code Acceptance
Based on the performance ratings for each window listed in Table 2, all of these windows meet
the fenestration requirements listed in Table 402.1.1 of the 2009 International Energy Conservation Code (IECC 2009).
Market Availability
Market availability is based on the prevalence of the window product throughout the new home construction market in the cold climate zone. Prevalence is categorized into four levels of
availability: mass market, niche market, available within the next two years, and available within the next two to five years. Mass market availability allows for competitive bidding, with many regional suppliers carrying similar products. Niche market availability describes limited market penetration, where competitive bidding is unlikely as only one supplier in a region may carry the product or its equivalent. Availability was determined through conversations with the
manufacturers and surveys of their existing supplier/dealer networks.
In some cases, as in two of the eventual three top window selections, a window product was marketed as a replacement product only. However, the same window was still available as a new construction window with options, such as snap-on nailing fins, that allow it to be installed in typical new construction applications. While the supply chains for these windows are clearly defined for the replacement window market, the purchase and delivery process for new construction is more unclear. When questioned about purchasing new construction windows outside of their replacement dealer network, some manufacturers had no defined dealer network for doing so and would only sell these products factory-direct. In such cases, the window was defined as “niche” even though the replacement product was widely available throughout the cold climate zone.
Constructability, Trade Skill Set Change, and Functionality
Constructability is measured by the availability of details, components, instructions, and
installers for each window product under consideration. The constructability metric answers the questions: how easy is this window product to install in a home? Is it easier, equivalent or more difficult to install than the builder standard window?
A major question that developed during the evaluation of constructability was how to install the window in a wall assembly with multiple layers of external rigid foam sheathing. With thicker
10
layers of foam sheathing, the outer drainage plane of a home is increasingly separated from the framed opening in the wall. This results in anywhere from 1-4” of foam where there would typically be wood framing and provides an uncertain bearing surface for the window. Although this detail was more of an issue when evaluating suitable exterior wall assemblies, it presents an interesting challenge to manufacturers of high performance windows who may be faced with resolving this issue in a housing market increasingly geared toward increased energy efficiency. Trade skill set changes are based on whether additional training is needed for the trades to properly install the windows under consideration for this project. Although installing windows requires no special training, it is questionable whether or not trades were using proper window installation techniques initially, including window flashing details and other aspects of
integration with the drainage plane.
Window functionality is based on the window providing the same or better level of performance as the builder standard window. Functionality is defined from a mechanical standpoint rather than by energy performance, and it includes aspects of physical operation and maintenance. Although certain window options appeared to have sleeker engineering or upgraded operating features, the overall performance of each window was essentially the same.
Architectural Flexibility and Scalability Potential
Architectural flexibility looks at how well the window can be effectively installed in a variety of housing types and styles. All of the windows that were under consideration for this project work with essentially every type and style of home construction. Scalability potential defines the number of homes that can be built annually using a particular window given the current production capacity of the manufacturer. Higher ranking is given to an existing capacity for production on a national scale (1000+ homes annually). All of the windows that were under consideration for this project had national scale capacity, although not every product was widely available in every region.
Durability
The durability criterion measures the level of difficulty required to integrate climate-appropriate moisture management techniques. In the case of the windows that were under consideration for this project, standard and proper window installation and flashing techniques were sufficient to ensure effective moisture management.
Physical testing was not performed in this study to determine the amount, if any, of bulk water intrusion through the window units.
Cost vs. Energy Savings Ratio
The cost vs. savings criterion compares the dollars per annual kWh saved per window product relative to the builder standard window. The calculated amount for each window product cannot exceed $20 per kWh annually saved, which is an amount roughly twice the cost of a photovoltaic (PV) system. This equation attempts to justify using that window product in place of purchasing additional amounts of renewable energy from an installed PV system or utility ”green” credits.
11
Quotes were collected from each manufacturer directly or from one of their suppliers. The quotes were based on typical contractor prices, transportation fees to the project site, and all taxes. These quotes were used to generate a table of incremental costs for each window product from the established cost of the base window. An incremental cost per square foot was also calculated. Figure 4 shows the incremental costs per square foot of each window option.
Figure 4: Incremental Cost per Square Foot of Window Area
For this study, the cost/savings ratio was generated using the incremental cost of each window divided by its incremental total annual heating and cooling energy savings (kWh) from the base
12 Figure 5: Cost vs. Energy Savings Ratio for Windows
The cost vs. energy savings ratio identifies the favorable window options with the lowest incremental costs and highest energy savings. As the cost of a window decreases and the energy savings increases, the ratio grows smaller. Using this metric, the smaller cost/savings ratio indicates the more favorable window selections. This comparison was taken a step further by generating an amortized annual cost for each window and dividing that figure by the total annual heating and cooling incremental energy savings for that window, resulting in an amortized annual cost per unit energy savings ($/kWh). This calculation shows the value of the windows in terms of a yearly payback to the consumer.
Comfort
Although comfort is considered a “Should Meet” criterion in this evaluation process, occupant comfort is an important factor that must be considered in assessing the performance of any window product. Therefore, a discussion of the research performed to evaluate occupant comfort has been included in this paper.
Several criteria were weighed to assess the effect on occupant comfort that each of the dominant window options presented, including the Visible Transmittance (VT) rating of the window, the TCPI measurement, and the average zone temperature. The VT for each of the three leading window options was a measure of their visual comfort level for occupants. The VT rating was gathered from the NRFC label and used to rank each window from most to least preferable based on descending VT ratings. Thus, the window with the highest VT rating was given the highest preference for visual comfort. A window with a VT rating below 0.50 is visibly darker; for a
13
window with a VT rating below 0.40, the darkness of the glazing becomes restrictive to vision. Particularly in colder, cloudier climates, the reduced visibility and reduction of natural sunlight in the home may be more oppressive. According to Marc LaFrance, the Technology
Development Manager for the DOE’s Building Envelope and Windows R&D programs, a VT
rating of 0.50 or above is a safe choice to provide adequate visual comfort2. In general, windows
with higher SHGC ratings have higher VT ratings and vice versa.
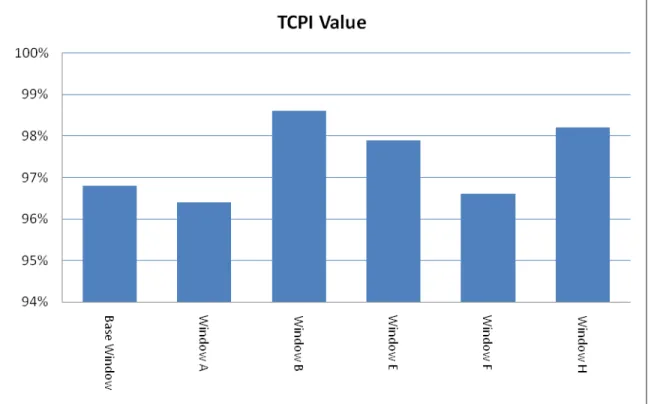
TCPI was used to compare the relative comfort provided by the window options to each thermal zone of the home. TCPI values are generated by TRNSYS simulation and compare the predicted mean vote (PMV) against a series of predetermined comfort criteria at each simulation time step. Each TCPI value is calculated by dividing the number of predicted values that meet the
predetermined comfort criteria by the total number of values calculated. A value of 1.0 represents perfect comfort all the time, with a value between 98% and 100% considered to be preferable. For all TRNSYS simulations, only the window inputs were changed; all other component inputs remained constant.
Figure 6 shows the average whole house TCPI results calculated from the average monthly TCPI values for all thermal zones in the home for several of the leading windows.
Figure 6: Average Whole House TCPI Values for Leading Window Products
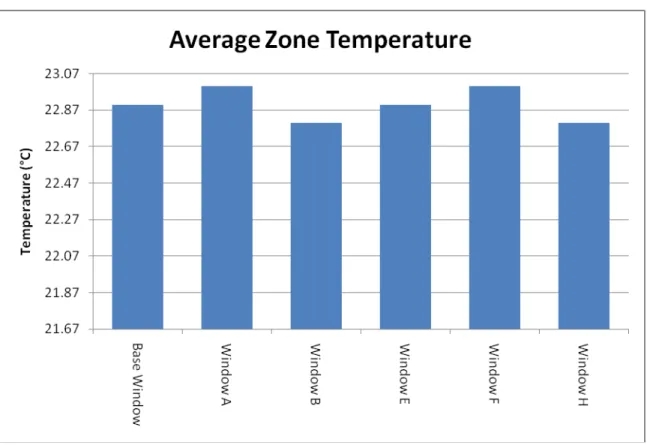
Average zone temperature for the entire volume of each zone was calculated from a TRNSYS simulation of annual zone temperatures at regular intervals throughout the heating and cooling
2
14
seasons. This average was then compared to a thermostat set point of 21.67ºC (71ºF) to calculate the average deviation from that set point. This comparison indicates the relative effect of each
window sample on the average dry bulb temperature of the home. Figure 7 shows the average
zone temperature for each window sample along with the average deviation from the thermostat set point. The smaller deviation indicates the more preferable window.
Figure 7: Average Zone Temperatures for Leading Window Brands
Conclusion
Based on the research, the ideal window for a high performance home in a cold climate is one with a balance of thermal performance and affordability that is available with typical installation features like integral nailing fins and J-channels and that provides adequate levels of occupant visual comfort. U-value performance is more significant than SHGC in determining potential energy savings in a cold climate, and VT levels should be above 0.40 minimally and above 0.50 ideally.
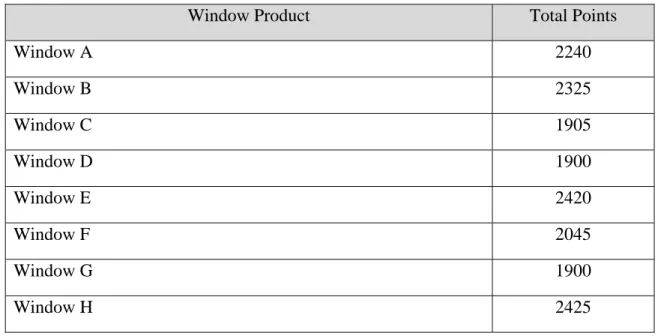
Table 3 shows the final scores for each window evaluated in this research based on the “Must Meet” and “Should Meet” criteria. From these results, Window H was determined to be the ideal window selection for the Pittsburgh lab home.
15 TABLE 3: Summary of Window Scores
Window Product Total Points
Window A 2240 Window B 2325 Window C 1905 Window D 1900 Window E 2420 Window F 2045 Window G 1900 Window H 2425
Table 4 shows the final scores for each window evaluated in this research based on the “Must Meet” evaluation criteria only. These criteria include cost and energy savings measures but do not include a valuation of occupant visual or thermal comfort. From these results, Window E was determined to be the ideal window selection for the Pittsburgh lab home.
TABLE 4: Summary of “Must Meet” Window Scores Only
Window Product Total Points
Window A 2000 Window B 2005 Window C 1905 Window D 1900 Window E 2180 Window F 1805 Window G 1900 Window H 2105
16
Next Steps
From this research, there are additional topics to consider when choosing the right window for a high performance home in a cold climate. Research being conducted by the DOE and industry specialists is seeking to identify and implement technologies to get high performance windows into the U.S. mass marketplace. The volume purchase of R-5 windows is geared toward
incentivizing U.S. window manufacturers to invest their resources in these activities. It is assumed that some of the issues related to the availability and constructability of high
performance windows will be addressed by U.S. manufacturers as they develop cost-effective products for the mass market.
The evaluation process used for this research project can be expanded to include multiple regions within the cold climate zone. Knowing a favorable window in, for example, Fargo, ND or
Anchorage, AK, will help U.S. window manufacturers, builders of high performance homes, and the research community to better understand the elements influencing the selection of a favorable cold climate window. The evaluation process can also be expanded to include the effects of window orientation and area on energy performance and cost savings.
Acknowledgments
The authors acknowledge the support of the U.S. Department of Energy’s Building America program.
References
Hendron, R., et al, Building America Research Benchmark Definition. Golden, Colorado.
National Renewable Energy Laboratory, 2008.
IECC. 2009 International Energy Conservation Code. Country Club Hills, IL. International