Quantifying the Impact of Construction Waste Charging Scheme
1on Construction Waste Management in Hong Kong
2C.S. Poon
1; Ann T.W. Yu
2; Agnes Wong
3; and Robin Yip
4 3_____________________________________________________________________________________ 4
ABSTRACT 5
A considerable amount of solid wastes is generated every year from construction and demolition (C&D)
6
activities in Hong Kong. The C&D waste can be classified into inert and non-inert wastes, in which the
7
inert waste is normally disposed of in public fills as reclamation materials, and the non-inert part is dumped
8
at landfills. Under the current waste generation trend, all landfills and public fills in Hong Kong would be
9
used up within the few years. To tackle this problem, in December 2005, the Hong Kong Government
10
implemented the Construction Waste Disposal Charging Scheme (CWDCS) to provide financial incentives
11
to C&D waste generators to reduce waste and encourage reuse and recycling. This paper presents the results
12
of a study to explore the perceptions of the Hong Kong construction participants towards the CWDCS after
13
its 3-years implementation. The study was conducted by a questionnaire survey with follow-up interviews
14
to experienced professionals in the building industry. The results revealed that there was no consensus view
15
among the construction participants on C&D waste reduction especially on on-site waste sorting and
16
recycling. The findings also revealed that 40% of the survey respondents believed that waste reduction is
17
less than 5% after CWDCS has been implemented. The interviewees expressed that some waste generation
18
were unavoidable despite a waste disposal charge has been imposed. In addition, 30% of survey respondents
19
agreed that the cost of CWDCS was not high enough to raise the awareness on waste management on
20
construction sites.
21
1
Professor, Dept. of Civil and Structural Enginneering, The Hong Kong Polytechnic Univ., Hung Hom, Kowloon, Hong Kong. Email: [email protected]
2
Assistant Professor, Dept. of Building and Real Estate, The Hong Kong Polytechnic Univ., Hung Hom, Kowloon, Hong Kong (corresponding author). Email: [email protected]
3
Research Assistant, Dept. of Civil and Structural Engineering, The Hong Kong Polytechnic Univ., Hung Hom, Kowloon, Hong Kong.
4
Research Student, Dept. of Civil and structural Engineering, The Hong Kong Polytechnic Univ., Hung Hom, Kowloon Hong Kong
KEYWORDS 22
Construction and demolition waste, Polluter-Pays-Principle, recycling, sorting, waste disposal charging
23 scheme 24 25 1. INTRODUCTION 26
1.1 Nature of C&D Waste and the Current Problems in Hong Kong 27
Construction activities generally have negative effects on the environment, which includes exploitation of
28
natural land and other resources for development, and the generation of waste and various forms of pollution
29
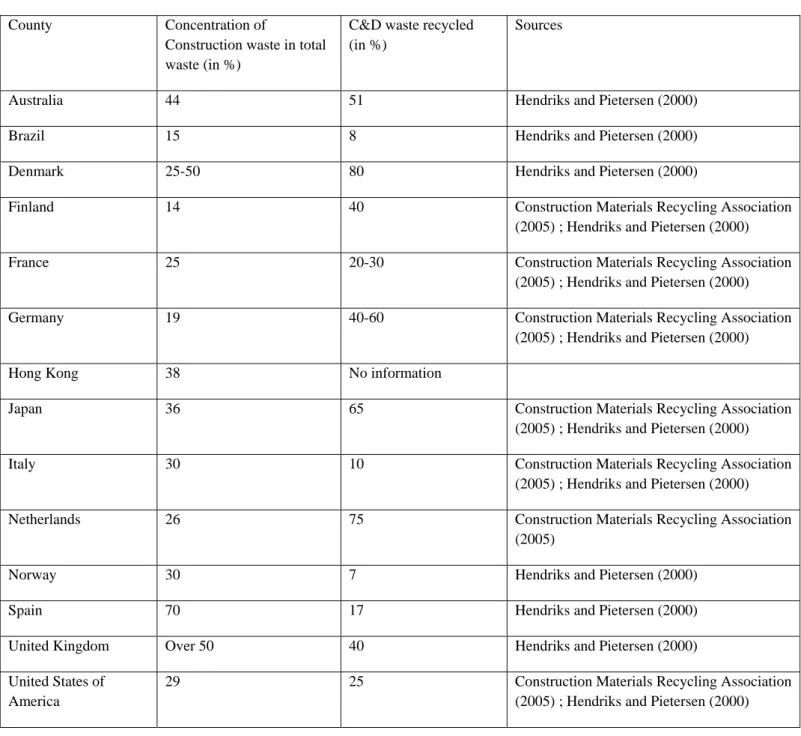
(Tam et al. 2005, 2006). The quantities of waste generated from construction activities in a number of
30
different countries are shown in Table 1. In the United Kingdom, more than 50% of landfilled materials
31
come from construction waste (Ferguson et al. 1995), and 70 million tonnes of waste are generated from
32
construction and demolition activities. In Australia, about 14 million tonnes of waste is landfilled annually,
33
and 44% of the total waste is contributed by the construction industry (Craven et al. 1994; McDonald 1996).
34
In the United States, around 29% of solid waste is from construction works (Hendriks and Pietersen 2000),
35
and in Hong Kong about 38% of the landfilled solid waste come from the construction industry (EPD 2006).
36
Construction and demolition (C&D) waste is a mixture of inert and non-inert materials arising from various
37
construction activities like excavation, demolition, construction, renovation and roadwork. Construction
38
waste consists of two major categories: inert materials and non-inert waste. According to government
39
statistics, in Hong Kong, soft inert materials (such as soil, earth and slurry) account for about 70% of all
40
C&D waste and they can only be reused as fill materials in reclamation and earth filling works. The hard
41
inert materials (such as rocks and broken concrete) represent about 12-15% of the total waste and they can
42
be reused/recycled as granular materials or recycled aggregates for construction activities. The recycled
43
aggregates can be used in road sub-base, drainage bedding layers and concrete mix applications. The
non-44
inert waste (like timber, bamboo and packaging waste) account for about 15-18% of all the construction
45
waste and they are mainly disposed of at landfills (Legislative Council Panel 2006).
46
Based on the information generated from a developed planning model, the government has made a forecast
47
on the quantities of C&D material arising in 2006, 2011, and 2016 (see Fig. 1). With an estimation of about
48
24% annual increase in C&D waste generation it is likely that the landfills and public fills in Hong Kong
49
will be full within the next 10 years (EPD 2007).
Management of construction wastes is a global environmental issue experienced by countries all over the
51
world. Driven by shortage of disposal sites, means of construction waste management and minimization at
52
work sites were initiated (Baldwin et al, 2009; Fatta et al., 2003; Cosgun and Esin, 2007; Poon et al., 2004).
53
Studies that aimed to quantify and investigate the physical and chemical properties of C&D wastes were
54
also launched (Bianchinni et al., 2005; Brunner and Stampfli, 1993; Jaillon and Poon, 2009). Furthermore,
55
possibilities of recycled aggregates utilization from C&D materials have been pursued worldwide with
56
promising results (Hansen 1996, Dhir et al. 1998, Xiao et al 2010)
57
58
As regards regulatory measures to tackle the C&D waste problem, the California Department of Resource
59
Recycling and Recovery (CalRecycle) was established in California in January 2010. CalRecycle promotes
60
C&D waste diversion by developing a C&D waste diversion model ordinance for local jurisdictions and
61
general contractors. Educational materials and information about alternatives facilities that accept C&D
62
waste are also provided in the ordinance. The ordinance establishes an Incentive Programs to encourage
63
waste haulers to implement C&D waste diversion. Also, it provides grants and loans to help organizations to
64
meet the State’s waste reduction, reuse, and recycling goals (CalRecycle, 2010).
65
In Alberta, Canada, in 2008 a new landmark agreement was developed between the Government of Alberta,
66
the Alberta Construction Association and the Canadian Home Builder’s Association-Alberta to set out a
67
timeline to create a provincial stewardship program “Too Good to Waste” to deal with the waste problem.
68
This stewardship program targeted to increase the recycling rate of various construction wastes, including
69
concrete, wood, asphalt, and drywall, thus preventing them from clogging Alberta’s landfills. (Government
70
of Alberta, 2010).
71
In UK, the Site Waste Management Plans Regulations was promulgated in April 2008. The regulation aims
72
to increase the quantity of materials that can be recovered, re-used and recycled from construction waste and
73
improve materials resource efficiency. The plan should includes details of construction project, estimates of
74
the types and quantities of waste produced and confirmation of the quantity of waste generated and how they
75
are managed. It is a requirement that waste is disposed appropriately in accordance with the duty-of-care
76
provisions. (UK Government, 2010)
77
In Germany, it is a requirement by law to carry out separation, pre-treatment and recovery of C&D waste
78
since 2003. The ordinance stated that the producers and holders of C&D waste must hold, store, collect,
79
transport and consign the waste for the recovery of wood, glass, plastic, metals (including copper, bronze,
80
brass, aluminum, lead, zinc, iron, steel and tin), concrete, bricks, tiles, mixture of concrete, bricks, tiles, and
ceramics, separately. The mixed C&D waste shall undergo pre-treatment prior to energy recovery, in
82
particular by sorting, crushing, compacting or pelletizing (German Government, 2010)
83
1.2 Hong Kong Government Policy on C&D Waste 84
For the past two decades, the Government of HKSAR has implemented various measures trying to reduce
85
waste generation, including the amendment of the Waste Disposal Ordinance, issuance of a policy paper for
86
a comprehensive 10-year plan to reduce construction waste, launching a green manager scheme on
87
construction sites, promulgated a waste reduction framework plan, issuance of a practice note promoting the
88
use of recycled aggregate, implementing the policy of Waste-Management-Plan (WMP) on construction
89
sites, commissioning a pilot concrete recycling plant, and introduced a charging scheme for the disposal of
90
construction waste (see Table 2). All these actions are clear indications that the Government of HKSAR is
91
determined to tackle the increasing problem of waste generation from construction activities in Hong Kong.
92
93
2 PREVIOUS WORKS ON WASTE REDUCTION AND MANAGEMENT
94
2.1 The Polluter-Pays-Principle 95
The Polluter-Pays-Principle (PPP) is in line with the principle that polluters are responsible for the damage
96
caused to the natural environment and the PPP is widely adopted by many countries (Hao et al., 2009). In
97
the construction industry, this ‘polluter pays’ principle provides economic incentives for building
98
professionals to initiate means to minimize waste generation by sorting and recycling waste as part of the
99
construction process.
100
This principle is strongly supported by the Organization for Economic Cooperation and Development
101
(OECD) and the European Union (EU) and is applied in many developed and developing countries
102
(International Coalition for Sustainable Production and Consumption 2007).
103
In the Unites States, there is no national landfill tax or fee. However, many states and local governments
104
collect fees and taxes on the collection or disposal of solid waste. For example, in California, landfills fees
105
and taxes are levied by cities and countries, as well as by the state. In order to reduce and recycle C&D
106
waste, San Jose has implemented a “Construction & Demolition Deposit for Diversion program” by which
107
the contractor must pay a deposit to the city, when it is granted a new construction permit. The contractor
108
also needs to show a recycling facility has accepted all construction and demolition waste for reclaiming the
109
deposit.
The landfill tax was found to be most effective in Belgium, Denmark and Austria, since these countries
111
could achieve a decrease of waste disposed of landfills of over 30% after the tax was introduced. In
112
Denmark, building waste had been reduced by more than 80%, and 61% of recycling rate was achieved
113
(Bartelings et al. 2005). However, in France, only a drop of waste to landfill by 4% was achieved after 16
114
years of implementation. In Norway and the United Kingdom, the effectiveness of landfill taxes was not
115
obvious as waste generation kept growing only at a slower rate (Anderson 1998, Glazyrina et al. 2006,
116
Magrinho et al. 2006). In December 2005, the Hong Kong Government implemented the “Construction
117
Disposal Waste Charging Scheme” (CDWCS). The disposal of construction waste is subject to a charge of
118
HK$125/ton to landfills, HK$100/ton to sorting facilities and HK$27/ton to public fill reception facilities
119
(Table 3).
120
2.2 Implementation of CWDCS in Hong Kong 121
According to Government information, the CWDCS targets to encourage construction waste producers to
122
reduce, reuse, sort, and recycle construction waste before sending it for disposal. According to government
123
figures, the average amount of construction waste disposed in three landfills in Hong Kong decreased by
124
40% from 6,600 tons per day in 2005 to around 4,000 tons per day in 2006 (EPD, 2007). However, the
125
number of detected fly-tipping cases of waste building materials increased by more than 400 percent from
126
365 cases in 2005 to 1,587 cases in 2006. Although a construction waste fly-tipping spotting system has
127
been implemented to encourage the public to report illegal dumping activities, it is difficult to find concrete
128
proof for the illegal dumping (Chui, 2007).
129
130
3. AIM OF STUDY 131
It is expected that the implementation of the Construction Waste Disposal Charging Scheme (CWDCS) in
132
Hong Kong would induce changes in the construction industry. After three years of its implementation, the
133
study aims to evaluate the effectiveness of CWDCS in the following aspects:
134
(i) How much waste has been reduced?
135
(ii) Steps that have been taken by the construction industry both in construction planning, site operation
136
and project management to accommodate the impacts of the waste charge.
137
(iii)What changes have taken place among building professionals in handling C&D waste?
138
4. RESEARCH METHODOLOGY 140
The study comprised a questionnaire survey and structured interviews with construction professionals. The
141
research findings from both the questionnaire survey and interviews are used to cross-reference with each
142
other to validate the research outcomes.
143
144
4.1 Questionnaire Survey and Structured Interviews 145
The questionnaire was developed to investigate the change of views of the building professionals since the
146
implementation of the CWDCS in 2005. The questionnaire was designed to collect data on actions taken to
147
respond to the implementation of CWDCS. The questionnaire targeted to capture the views of the
148
respondents on the following issues before and after the implementation of CWDCS:
149
- Overall reduction in waste generation
150
- Actions taken to reduce waste by means of waste sorting and recycling at site level
151
- Barriers to waste minimization by means of sorting and recycling
152
- Method on Estimating construction waste disposal cost at tender stage
153
- Progress after the implementation of CWDCS
154
The survey was administered by distributing the questionnaire to 319 target professionals who were working
155
in the areas of construction project management, construction operation and project finance. The
156
respondents could be broadly classified into the following three disciplines:
157
- Project manager (representing project management stream)
158
- Engineer (site agent is included in this group, representing site operation stream)
159
- Quantity surveyor (representing project finance stream)
160
The survey was conducted in year 2009 and 109 completed questionnaires were received. The response rate
161
was 34%. Out of the total 109 returned questionnaires, 89 were valid responses in which 41 respondents
162
(46%) identified themselves as project/construction managers, 30 respondents (34%) were quantity
163
surveyors, and 18 respondents (20%) were engineers. Thus, it is believed that each of the three groups was
164
adequately represented in the survey.
165
Interviews were also carried out with selected professionals who were either construction managers (project
166
directors and project managers) or frontline construction supervisors (site agents and construction engineers).
The questions asked in the interviews were similar to those in the questionnaire survey but they were
168
structured in the direction to explore the views of the interviewees on the effectiveness of CWDCS and the
169
subsequent changes in practice in the construction industry of Hong Kong.
170
4.2 Data Analysis and Findings from Questionnaire Survey 171
The results of the survey indicated that the respondents had been working in the construction industry for
172
relatively long periods. 67% of them possessed over 10 years of experience and only 14% had less than
6-173
year experience. Half of the respondents are working in organizations of less than 400 employees and they
174
were participated or in charge of projects with contract sums of > HK$100 million. The above organization
175
size and the project size are common in Hong Kong.
176
4.2.1 Method of Estimation of Construction Waste Disposal Cost at Tender Stage 177
The survey results tabulated in Fig. 2 indicate that before CWDCS was implemented, 35% of the
178
respondents estimated the waste disposal cost by the total contract sum, 34% by gross floor area and 18% by
179
contract sum of selected work trades of the building project. However, after the implementation of CWDCS,
180
more respondents prefer calculating the disposal cost by basing on the contract sum of each work trade (33%)
181
to that of the total contract sum (27%).
182
Cost of Waste Management
183
The survey results also revealed that over 70% respondents put 0.5% of the total contract sum as waste
184
disposal cost before the implementation of CWDCS. Up to 24% respondents placed less than 0.1% of the
185
total contract sum on waste management (see Fig. 3). It is interesting to note, after the implementation of
186
CWDCS the results show that 7% of the respondents opined that there would be no change in cost for waste
187
disposal (see Fig. 4). But more than 60% of the respondents expected an increase of waste disposal cost
188
within 1% of the total contract sum. The stated reasons for the increased cost estimation was due to (i) the
189
increase in waste disposal cost (64%), (ii) the additional handling cost for on-site sorting of waste (47%) and
190
(iii) complex site management (24%) (see Fig. 5).
191
4.2.2 The Level of Waste Generation Before and After Implementation of Waste Charging Scheme 192
The results of the survey investigated on the change of waste generation before and after the CWDCS
193
(Fig.6). It revealed that more than 40% respondents believed that the waste generation level was reduced by
194
no more than 5% after the implementation of the CWDCS and 11% of respondents opined that the reduction
195
was 5-10%. However, about 29% of the respondents reported that there was “No Change” in waste
196
generation level. More than 66% of all the respondents opined that the waste generation from certain work
trades on site were unavoidable, and 33% believed that it was the designers’ responsibility to reduce waste at
198
design stage rather than at construction stage (Fig.7).
199
This study also tried to identify actions taken in the industry to reduce waste generation. The respondent’s
200
views on the ranking of actions taken are shown in Fig. 8. The top three actions adopted to reduce waste
201
generation included better work sequence and management, better subcontractor materials control/handling
202
and better design input.
203
4.2.3 Barriers of Sorting and Recycling of Construction Waste 204
Analyses of the barriers of waste minimization by means of sorting and recycling are displayed in Fig. 9 and
205
10 respectively.
206
There was some consensus on the barriers for implementing waste sorting in their construction projects. All
207
the respondents ranked ‘limited waste storage area on site’ as the major barrier for implementing waste
208
sorting while the project manager’s group ranked ‘intensive labor cost in sorting waste’ as the most
209
important barrier. The second important barrier was ‘no sorting area on site’ according to all the respondents
210
and project manager’s group. This result was not surprising as construction sites in Hong Kong were very
211
congested. The next three important barriers were ‘high supervisory to subcontractors’ behaviors’, ‘intensive
212
labor cost in sorting wastes’ and ‘inference with normal site activities’, which were based on the results of
213
all the respondents.
214
There was also some consensus on the barriers for implementing waste recycling in Hong Kong. All the
215
groups except quantity surveyor’s group ranked ‘not cost effective’ as the most important barrier for
216
implementing waste recycling. The second important barrier was “complex treatments before reusing the
217
recycled materials’ based on the survey results of all respondents and project manager’s group. The third
218
important barrier was ‘no market’ where the result of project manager’s group was agreed with all the
219
respondents.
220
4.2.4 Progress Made After Implementation of CWDCS 221
As shown in Fig. 11, the collective views of the respondents of the questionnaire survey on the progress
222
made after the implementation of the CWDCS are: (1) Increase in environmental awareness, (2) Increase in
223
material recycling awareness, (3) Reduction of site wastage level, (4) Improvement of material estimation
224
before ordering, (5) Improvement of inventory control. However, the lowest ranked item is (6) More
225
efficiency in waste sorting on site. It is a strong evident that on-site sorting is not supported by most of the
226
respondents.
In view of the listed items in the questionnaire are mainly related to environmental awareness and material
228
recycling, it is not unexpected that quantity surveyors, whose major roles are related to financial issues,
229
were less inclined to concur with the views of the building engineers and project managers.
230
4.3 Interviews of Building Professionals 231
Seven structured interviews have been carried out with building professionals at different levels who were
232
working in seven different building development projects in Hong Kong. The questions raised during these
233
interviews were similar to those of the questions set up in the questionnaire survey and focused on the
234
effectiveness of the disposal charges and actions taken to mitigate its impact on construction operation and
235
management on sites. The interviewees were particularly encouraged to provide their views on the changes
236
undertaken before and after the implementation of the CWDCS.
237
4.3.1 Overall Waste Reduction After the Implementation of CWDCS 238
Cross-referencing with the questionnaire results on the reduction of waste generation, one of the
239
interviewees, a project manager of a building contractor firm, pointed out that the reduction rate of waste
240
generation was not apparent. Some of the wastes were “unavoidable”, in particular when they were
241
generated as a result of the design changes initiated by the developer. He also emphasized that the waste
242
generation level from brick work and tiling work were highly dependent on design, such as matching pattern
243
according to aesthetic requirements. Other than design changes and aesthetic requirements, it was opined
244
that other important causes of waste generation were the traditional work practices and poor workmanship.
245
As for carpentry work, a building professional interviewed opined that as the major drive for reducing
246
wastage of timber materials on construction sites was due to the soaring cost of timber rather than
247
environmental awareness.
248
The project director of another building project commented that “unavoidable” was only the excuse of doing
249
nothing for waste reduction. He stated that to achieve waste reduction, action are required not only on
250
individual construction sites but also require a change of a company’s culture. He also pointed out that the
251
effectiveness of CWDCS was dependent on a number of different factors. For example, public sector
252
projects in Hong Kong have imposed more stringent contractual clauses to reduce waste generation and
253
often provided financial incentives for waste reduction; while private sector projects emphasis on time and
254
cost efficiency. Site conditions and project designs are other crucial issues. However, he stressed that the
255
most important factor that influences the implementation of sustainable construction of a project is the
256
company policy, in particular, the attitudes of the top management and the policy formulated to manage and
257
control subcontractors.
4.3.2Actions Taken at Site Level 259
According to the project managers of two different construction sites, waste reduction should be considered
260
at the very beginning of the projects, such as choice of construction materials and construction methods,
261
planning of construction site layouts, design of temporary and false work etc. After the implementation of
262
the mandatory Waste Management Plan in year 2003, contractors were required to carry out monthly
263
reviews on environmental issues. Penalty clauses that have been included in subcontract documents and
264
training on good environmental practices provided to construction workers were effective measures to
265
reduce waste.
266
The interviewees also commented that there is great reluctance for contractors to:
267
- carry out sorting of construction waste on site
268
- reuse of packaging materials, and
269
- use of recycled aggregate
270
This is because they thought that these green practices are either not practical on site, or comparatively
271
more costly than traditional practices. Moreover, they thought that the implementation of these works on
272
site would result in obstruction of normal work causing delay in completion dates.
273
4.3.3 Barriers of Sorting and Recycling of Construction Waste 274
Another interviewee who was involved in a private building project located in the urban area with the use of
275
traditional construction methods commented that due to space constraints (only 20% of the total site area of
276
4000m2 was available for construction circulation and logistic arrangment). Delivery of construction
277
materials and waste removal had to be well managed to avoid obstruction and congestion. Allocating space
278
for waste sorting within the site area was almost impossible and sending the waste off-site for sorting was
279
costly and impractical.
280
The interviewees who worked on a public housing project located in the sub-urban area using prefabriaction
281
construction method commented that the relatively larger site area allowed arrangements of sorting of
282
construction waste onsite (with 20% of the total site area of 5,000m2 was assigned as the circulation area and
283
logistic arrangment). Two large enclosed waste storage areas could be located within the site, one for “inert
284
waste” and the other for “non-inert waste”. The mechanism of waste sorting was achieved by using the
285
main waste delivery chute to convey inert materials such waste concrete, rubbles etc., whereas the lighter
286
non-inert materials such as waste formwork, packaging waste and waste plastic conduits were collected at
287
individual floors by using small containers and they were hoisted to the ground floor by a tower crane. This
arrangement required coordination between the subcontractors who collected the waste and the tower crane
289
operator. The inert and non-inert waste delivered to the ground level would be sorted manually) and stored
290
temporarily in the enclosed storage areas and disposed of at public fills and landfills separately. The survey
291
results indicate that the waste sorting levels (as a % of total waste) between inert and non-inert waste types
292
before and after CWDCS were 13.74% and 24.8 % respectively with an increase of 9%. In the case study,
293
the project manager further remarked that there were other factors contributing to achieving on-site waste
294
sorting including the company policy in encouraging the implementation of good environmental practices,
295
the relatively longer project duration and providing environmental awareness training to subcontractors and
296
their workers. But project managers responsible for private construction projects expressed that the prime
297
goal in managing a private sector project was “to complete the project within the budget in the shortiest
298
possible time”. There was no or very limited cost initiative allowed for waste sorting and recycling. They all
299
considered that additional cost was definitely required in providing labour and plant for waste sorting and
300
recycling on-site. Such provisions in private sector projects would increase the tender price which would
301
jeopardize the chance in winning jobs. Moreover, under the current traditional subcontracting arrangment,
302
removal of waste from construction sites is normally subcontracted to a General Cleaning Subcontractor
303
who usually incorporates a number of risk factors in their subcontracting tender price with very little
304
bargaining margin. (refer to the following sections 4.3.4 and 4.3.5). Therefore, to impose additional
305
responsibility for waste sorting on the sub-contractor would require a very complicated estimation process to
306
reconsile the whole tendering strategy.
307
4.3.4 Disposal Cost Estimation in Tender Stage 308
All the interviewees agreed that removal of site waste was normally subcontracted to a trade subcontractor
309
named General and Miscellaneous Site Cleaning Work (General Cleaning). The cost of such cleaning works
310
was non-recoverable from the client. In common practice, costs incurred in General Cleaning is allowed and
311
priced in various items of the Preliminaries section of the Bills of Quantities.
312
The costs incurred for the delivery of waste from construction site to landfills or public fills (including labor
313
and transportation costs) are paid by the main contractor and are absorbed in the contract amount. In the
314
tender stage, site cleaning cost is priced as a certain percentage of the total contract sum which is estimated
315
according to the total gross floor area of the project. The percentage value is based on the the company’s
316
database taking reference from past projects of similar nature. Any increase in this estimatedvalue is likely
317
to reduce the chance of successfullt bidding the project.
318
However, traditional practices in the finishing trades like plastering, brick work and painting, subcontractors
319
and workers do not pay much attention in site cleaning, it is because wastes generated by these trades are
collected by the General Cleaning subcontractor employed by main contractor, and the trade subcontractors
321
are not responsible for paying or the management of the waste. After the implementation of CWDCS, in
322
order to better control of wastage and waste generation by different work trades, more and more main
323
contractors are in the process of amending the terms and conditions of subcontract work to ask
324
subcontractors be responsible for waste generated from their respective work trades. As a result, the
325
awareness of subcontractors in waste reduction is increased and the method of waste disposal cost
326
estimation using the percentage of sub-contract sum of the individual work trades has become more
327
common.
328
By such a change, it has been commented by an interviewee that the estimated waste disposal cost is
329
reduced to around 0.2% to 0.3% of the total contract sum and this will increase the chance of bidding a
330
project.
331
For the main contactor perspective, it was commented that although the reduction of waste as a result of the
332
CWDCS may have reduced a few truck loads of waste, the amount in terms of cost is negligible when
333
compared to the total contract sum. Undeniably, the CWDCS would somehow increase the cost of the main
334
contractor. But the cost remains low. The result of interviews concurred in general with the outcome from
335
the questionnaire survey.
336
4.3.5 Progress made after the Implementation of CWDCS 337
The direct progress is the physical reduction of waste generated in the construction industry. Also,
338
indirectly, there have been gradual changes from the traditional work practice which are less
339
environmentally friendly to the less waste producing waste practices. More main contractors are changing
340
their contractual arrangements with the subcontractors by shifting the waste reduction and waste cleaning
341
responsibilities to them. Although such a change is mainly financially driven, but the mal-practices of
342
workers can be better controlled and they are even provided with training to raise their environmental
343
awareness.
344
4.4 Comparison of the Outcomes of Questionnaire Survey and Interviews 345
Comparison of the research findings by questionnaire survey and interviews is illustrated by Table 4. The
346
majority of the respondents of the questionnaire survey believed that waste reduction is not more than 5%.
347
The interview respondents concurred with these views that the reduction rate is not apparent. The
348
respondents of the questionnaire survey suggested various actions to be taken for waste minimization at site
349
level. However, the interviewees raised that contactors are reluctant to implement waste sorting on site due
to site constraints. They recommended that waste reduction should be considered at the early stage of the
351
project when materials and construction methods were decided. Nevertheless, it was agreed that progress
352
had been made after the implementation of CWDCS. The environmental awareness of contractors is
353 improved. 354 355 5. CONCLUSION 356
The study has quantified the impact of construction waste charging scheme on construction waste reduction
357
after three years of implementation in Hong Kong by means of questionnaire survey and interviews. The
358
following conclusions can be drawn:
359
The research findings revealed that 40% of the survey respondents believed that waste reduction is less than
360
5% after CWDCS has been implemented. The interviewees agreed that the waste reduction rate was not
361
significant. They expressed that some waste generation were unavoidable despite a waste disposal charge
362
has been imposed. In addition, 30% of survey respondents agreed that the cost of CWDCS was not high
363
enough to raise the awareness on waste management on construction sites.
364
Changes in construction management are evident in handling C&D waste in construction operations and
365
tender strategy. Shifting the responsibility of construction waste generation and minimization from main
366
contractors to trade subcontractors is gradually perceived by participants of the construction industry of
367
Hong Kong. Such a shift has evoked amendments in subcontract documents as well as the estimation of
368
waste handling charge in the tender amount. The evaluation waste handling cost at tender stage is changed
369
from the total floor area of the project to the total amount of selective trade subcontracts.
370
371
ACKNOWLEDGEMENT 372
The authors wish to thank the Hong Kong Polytechnic University for funding support. The cooperation of
373
various construction professionals in participating in the questionnaire survey and interviews are also
374
gratefully acknowledged.
375
376
REFERENCES 378
Andersen, M.S., Dengsoe, N. (2002). “A Baumol-Oates Approach to Solid Waste Taxation”. Journal
379
of Material Cycles Waste Management, Vol. 4, 23-28. 380
Anderson, M.S. (1998). “Denmark’s Waste Taxes”. Environment, 40, 38-41.
381
Baldwin, A., Poon, C.S., Shen, L. Y., Austin, S., Wong , I (2009). Designing out waste in high-rise
382
residential buildings: Analysis of precasting methods and traditional construction, Renewable Energy 383
34, 2067-2073. 384
Bartelings H., Van Buekering P., Kuik O., Linderhof V., Oosterhuis F. (2005). Effectiveness of
385
landfill taxation, report prepared for the Dutch Ministry of Housing, Spatial Planning and the 386
Environment, Institute for Environmental Studies, Vrije Universiteit, and Amsterdam. 387
Bianchini G, Marrocchino E, Tassinari R. and Vaccaro C. (2005) Recycling of construction and
388
demolition waste materials: a chemical–mineralogical appraisal, Waste Management, 25, 149-159.
389
Brunner P. H. and Stampfli D. M. (1993) Material Balance of a Construction Waste Sorting Plant,
390
Waste Management & Research, 11, 27-48.
391
Census & Statistics Department (ed.), accessed April 2010, from
392
http://www.censtatd.gov.hk/hong_kong_statistics/index_tc.jsp
393
California Department of Resources Recycling and Recovery, accessed April 2010, from
394
http://www.calrecycle.ca.gov/ 395
Chui, T. (2007). “Fly-tipping of Building Materials on the Rise”, The Standard, 27 March.
396
Craven, E.J., Okraglik, H.M., and Eilenberg, I.M. (1994). “Construction Waste and a New Design
397
Methodology”, paper presented at the Sustainable Construction: Proceedings of the 1st Conference of
398
CIB TG 16.
399
Cosgun N. and Esin T. (2007). A Study Conducted to Reduce Construction Waste Generation in Turkey,
400
Building and Environment, 42, 1667-1674.
401
Dhir, R.K., Henderson, N.A. and Limbachiya, M.C (ed.)(1998). Proceedings of the International
402
Conference on the Use of Recycled Concrete Aggregates, Thomas Telford, UK.
403
Environmental Protection Department (ed.) (2007). A Green Manager Scheme.
Environmental Protection Department (ed.) (2007). Environmental Protection.
405
Fatta D., Papadopoulos. A., Avramikos E., Sgourou E., Moustakas K., Kourmoussis F., Mentzis A. and
406
Loizidou. M. (2003) Generation and Management of Construction and Demolition Waste in Greece –
407
an Existing Challenge, Resources, Conservation and Recycling, 40, 81-91.
408
Ferguson, J., Kermode, N., Nash, C.L., Sketch, W.A.J. and Huxford, R.P. (1995). Managing and
409
Minimizing Construction Waste: A Practical Guide, London.
410
German Government - Federal Ministry for the Environment (ed.), accessed Jan 2010 from
411
http://www.bmu.de/english/waste_management/doc/6885.php
412
Glazyrina, R., Glazyrin, V. and Vinnichenko, S. (2006). “The Polluter Pays Principle and Potential
413
Conflicts in Society”. Ecological Economics, 59, 324-330.
414
Government of Alberta, accessed on Jan 2010 from http://alberta.ca/home/ 415
Government of United Kingdom (ed.), accessed on Jan 2010 from
416
http://www.defra.gov.uk/environment/waste/topics/construction/index.htm 417
Hansen, T. C., RILEM REPORT 6., Recycling of Demolished Concrete and Masonry, published by
418
E&FN Spon, Bodmin, UK, 1996.
419
Hendriks, C.F. and Pietersen, H.S. (2000). “Sustainable Raw Materials: Construction and Demolition
420
Waste”, RILEM Publication, Cachan Cedex, France.
421
International Coalition for Sustainable Production and Consumption (ed.) (2007). Polluter Pay
422
Principle.
423
Legislative Council Panel of the HKSARG (2007). Construction and Demolition Waste and Landfill
424
Charging Scheme.
425
Legislative Council Panel of the HKSARG (2006). Progress Report on the Management of
426
Construction and Demolition Materials, Environmental Affairs, 24 April.
427
Magrinho, A., Didelet, F. and Semiao, V. (2006). “Municipal solid waste disposal in Portugal”,
428
Waste Management, 26, 1477-1489.
429
Jaillon, L and Poon C.S. (2009). “Quantifying the Waste Reduction Potential of Using Prefabrication
430
in Building Construction in Hong Kong”, Waste Management, 29, 309-320.
Poon, C.S., Yu, A.T.W., Wong, S.W. and Cheung, E. (2004). “Management of Construction Waste
432
in Public Housing Projects in Hong Kong”, Construction Management and Economics, 22 (7), 675–
433
689.
434
Tam, C.M., Tam, W.Y.V., Chan, K.W.H. and Ng, C.Y.W. (2005). “Use of Prefabrication to
435
Minimize Construction Waste – A Case Study Approach”, International Journal of Construction
436
Management, 5 (1), 91-101.
437
Tam, W.Y.V. (2007). “On the Effectiveness in Implementing a Waste-Management-Plan Method in
438
Construction”, Waste Management, 28, 1072-1080.
439
Tam, W.Y.V., Tam, C.M., Chan, W.W.J. and Ng, C.Y.W. (2006). “Cutting Construction Wastes by
440
Prefabrication”, International Journal of Construction Management, 6 (1), 15-25.
441
Xiao, J.Z., Zhang, Y., Cheung, M.S. and Chu R. P.K. (ed)(2010). Construction Waste Recycling and
442
Civil Engineering Sustainable Development, RILEM Pro 73, Proceeding of 2nd International
443
Conference on Waste Engineering and Management.
444 445 446 447 448 449 450 451 452
Table 1: Comparison of Construction Waste Concentration in Various Countries 453
County Concentration of
Construction waste in total waste (in %)
C&D waste recycled (in %)
Sources
Australia 44 51 Hendriks and Pietersen (2000)
Brazil 15 8 Hendriks and Pietersen (2000)
Denmark 25-50 80 Hendriks and Pietersen (2000)
Finland 14 40 Construction Materials Recycling Association
(2005) ; Hendriks and Pietersen (2000)
France 25 20-30 Construction Materials Recycling Association
(2005) ; Hendriks and Pietersen (2000)
Germany 19 40-60 Construction Materials Recycling Association
(2005) ; Hendriks and Pietersen (2000)
Hong Kong 38 No information
Japan 36 65 Construction Materials Recycling Association
(2005) ; Hendriks and Pietersen (2000)
Italy 30 10 Construction Materials Recycling Association
(2005) ; Hendriks and Pietersen (2000)
Netherlands 26 75 Construction Materials Recycling Association
(2005)
Norway 30 7 Hendriks and Pietersen (2000)
Spain 70 17 Hendriks and Pietersen (2000)
United Kingdom Over 50 40 Hendriks and Pietersen (2000)
United States of America
29 25 Construction Materials Recycling Association
(2005) ; Hendriks and Pietersen (2000) 454 455 456 457 458 459 460
Table 2: HKSAR Government Initiatives Policy in C&D Waste Reduction 461
1980 The Waste Disposal Ordinance [Chapter (Cap.) 354] was enacted as the principal legal framework
1989 Establishment of the framework for a comprehensive 10-year plan to reduce C&D waste and other pollution problems, such as commitments to review its progress for every two years 1995 A “Green Manager Scheme” was launched for requiring every
governmental department to appoint a green manager to manage the environmental performance of individual organizations Nov 1998 “Waste Reduction Framework Plan (WRDP)” was introduced
with the aim of attempting to change the waste treatment habits of the public
Feb 2003 Building Department issued a practice note for structural engineers named “Use of Recycled Aggregated in Concrete”. This technical guideline can be applied to prescribed mix concrete (20P) and designed mix concrete (25D to 35D) to adopt 100% and 20% recycled aggregate respectively
May 2003 Environmental Transport and Works Bureau produced a circular (Ref:15/2003) on “Waste Management on Construction Sites” which explained the implementation of the government’s “Waste Management Plan” and “Pay for Safety and Environmental Scheme” for public construction projects
2004 Civil Engineering Department commissioned a pilot recycling plant at Tuen Mun Area 38 in a view of supplying recycled aggregate to a number of public projects from 2004 to 2006 Dec 2005 Government implemented “Construction Waste Disposal
Charging Scheme” that charges who dump their waste into public landfills. 462 463 464 465 466
Table 3: Government Waste Disposal Facilities and Disposal Charge (EPD) Government waste disposal
facilities
Charge per tone Type of waste accepted
Public fill reception facilities HK$27 Consisting entirely of inert construction waste Sorting facilities HK$100 Containing more than 50% by weight of inert
construction waste
Landfills HK$125 Containing not more than 50% by weight of inert construction waste
Outlying Island transfer facilities
HK$125 Containing any percentage of inert construction waste
Table 4: Findings of Questionnaire Survey Versus Interview Results
Study objectives Findings from questionnaire survey Views of interview respondents
Overall reduction in waste generation
Respondents believed that waste reduction is not more than 5% and some believed that there is no change in waste reduction.
The reduction rate is not apparent. Some wastes are unavoidable such as wastes caused by change of design and aesthetic reasons. Workers are not keen to change their traditional practice to reduce waste but are more open to using materials in an uneconomical way in order to save material cost. The situation can be improved enforcement of company policy prescribed by top-management.
Actions taken to reduce waste by means of waste sorting and recycling at site level
Better work sequence and management
Better subcontractor materials control
Better design
Better supervision on quality
Better inventory procurement monitoring
Better worker training
Better supervisory staff training
Reuse packaging materials
Reuse recyclable materials
Waste reduction should be considered at early stage of the project in choosing materials, construction methods, planning site layout, and imposing penalty on subcontractors and training of workers.
But contractors are reluctant to implement sorting of waste on site.
Barriers to waste
minimization by means of sorting and recycling
Limited waste storage area on site
No sorting area on site
High supervisory to subcontractors’ behaviors
Intensive labor cost in sorting wastes
Interference of normal construction activities
Low waste sortability
Narrow site access
Impractical in using too many waste delivery chutes
Sorting of waste and recycling on
construction site is constrained by site area and transportation assess. Achieving TIME and COST saving are major objectives rather than implementation of waste reduction in construction site.
Estimation of construction waste disposal cost in tender stage
Allow 0.5% of the total contract sum as waste disposal cost before the implementation of CWDCS is the general practice, after the implementation of CWDCS, more than 60% of respondents expected an increase of waste disposal cost within 1% of the total contract sum. Only a small minority (7%) opined that there is no change in tender estimation for waste disposal cost.
In order to better control of wastage of materials and reduce waste generation; main contractors are shifting the responsibility of waste management to different work trades. Also, the estimation of waste disposal cost is being changed from based on gross floor area to a percentage of the sub-contract sums of individual work trades. By such a change, the overall cost is reduced to around 0.2% to 0.3% of the total contract sum.
Progress made after the implementation of CWDCS
Reduction of site wastage level
Increased in environmental awareness
Increased in material recycling awareness
Improvement of material estimation before ordering
Improvement of inventory control
More efficiency in waste sorting on site
The direct progress is the physical reduction of construction waste. Indirectly, there are gradual changes of work practices to more environmentally friendly practice to reduce waste generation. Shifting of waste generation and site cleaning responsibility to subcontractors help rectify mal-practice of workers. Their environmental awareness is improved