Using Cognitive Maps of Mental Models to
Evaluate Learning Challenges: A Case Study
Full Paper
Zixing Shen
Dakota State University
[email protected]
Songxin Tan
South Dakota State University
[email protected]
Keng Siau
Missouri University of Science and Technology
[email protected]
Abstract
Mental models are organized knowledge structures that individuals form to make sense of the world around them. Cognitive maps are the externalized portrayals of mental models in graphical format. Mental models and cognitive maps have been used as an instructional design method, an assessment tool, and a learning strategy in college education. In this paper, we propose a novel use of mental models and cognitive maps as a device to elicit students’ challenges in learning course materials. Our case study in an Information Systems class illustrates how cognitive maps are constructed from students’ mental models, how learning challenges are identified from cognitive maps, and how learning challenges can be coped with in teaching. Our proposed use of cognitive maps and mental models can provide educators with insights into the learning challenges from students’ perspectives, and help design instructional strategies for more effective teaching.
Keywords
Mental Models, Cognitive Maps, Concept Mapping, Learning Challenges, Teaching, Learning
Introduction
Mental models are organized knowledge structures that individuals form to make sense of the world around them (Rouse and Morris, 1986). Cognitive maps are the externalized portrayals of mental models in visuospatial layout (Swan, 1997). Mental models and cognitive maps have been used in a variety of disciplines (see Wilson and Rutherford, 1989). In college education, mental models and cognitive maps have been used as an instructional design method (e.g. Ihlenfeldt, 1981), an assessment tool (e.g., Naveh-Benjamin et al., 1986), and a learning strategy to aid students to organize and develop conceptual knowledge (Pinto Zipp et al., 2015). In this paper, we propose a novel use of mental models and cognitive maps as a device to elicit students’ challenges in learning course materials. We conduct a case study in an Information Systems (IS) class to illustrate how cognitive maps are constructed from students’ mental models, how challenges in grasping course materials are identified from cognitive maps, and how the learning challenges can be coped with by adjusting teaching priorities and strategies.
The article is organized as follows: Next section discusses mental models, its applications in college education, and why it is useful in evaluating learning challenges. This is followed by elaboration on cognitive maps and cognitive mapping approaches and techniques. Then detailed report of the case study, including case design, procedures, findings and implications, is presented. The final section concludes the paper.
Mental Models and Learning
Mental models are used by individuals to internally represent the specific aspects of the world around them and reflect domain-specific knowledge structures in memory (Rouse and Morris, 1986). They reflect how domain knowledge of individuals is arranged, connected, or situated in their minds, present what is
known and believed, and show the reasoning behind purposeful actions (Fiol and Huff, 1992). As such, mental models can help capture students’ knowledge structures relating to the specific course domain, understand how students make sense of a particular topic, and explain the “hows” and “whys” of specific issues in learning. They have been employed extensively in teaching various subject areas such as biology (Kinchin, 2000) and nursing (Farrand et al., 2002). Interests in mental models have also been increasing in business education, as mental models have been incorporated into the curricula of marketing (Eriksson and Hauer, 2004) and management (Nadkarni, 2003). In this paper, we continue this line of inquiry. Specifically, we propose the use of mental models as a device to elicit challenges in learning course content.
College students face various learning challenges. Learning challenges can be related to students’ characteristics such as their preparedness, motivation, background, and cognitive and learning styles. Instructors’ expectations on performance and effort, teaching pedagogy, and availability and support may also be contributors. In addition, factors such as learning culture, technical infrastructure, and academic resources in the learning environment can create barriers. Last but not the least, course contents can be difficult to comprehend. Some subject areas are just intellectually and cognitively challenging to learn. Here we are interested in challenges in learning academic subject matter. Within any given course, there are concepts and topics that are of varying degrees of difficulty. Some are of average or less difficult, whereas others very challenging. Most students will be able to master average or less difficult concepts and topics by following instructional lectures, reading teaching materials, and completing relevant exercises. In contrast, for average students to learn concepts that are very difficult, the need to spend a lot of effort on developing alternatives for these concepts is critical. We argue that the use of mental models can help educators identify the more difficult concepts that create “bottleneck” within a course. We do not imply that mental models should replace existing practices used to understand the academic challenges in learning. Rather, mental models can be used to supplement other techniques – such as the instructor-centered assessments - to better understand learning challenges from learners’ perspective.
Cognitive Maps
Cognitive maps are used to externalize mental models (Swan, 1997). Cognitive maps are not the same as the true mental models which reside inside people’s minds. But rather, they are reconstructions of subjective beliefs that have been revealed to the researchers (Eden, 1992). The correlation between “true” mental models and “revealed” cognitive maps is never perfect. Cognitive maps, like any other research artifacts, are shaped by the techniques used in constructing cognitive maps (i.e. cognitive mapping).
Step Description
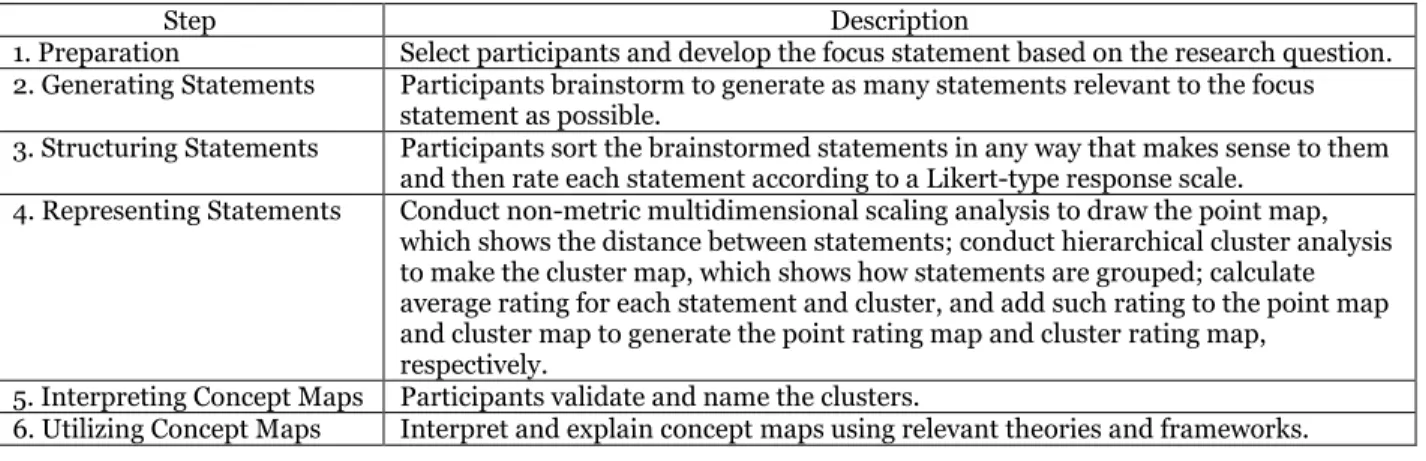
1. Preparation Select participants and develop the focus statement based on the research question. 2. Generating Statements Participants brainstorm to generate as many statements relevant to the focus
statement as possible.
3. Structuring Statements Participants sort the brainstormed statements in any way that makes sense to them and then rate each statement according to a Likert-type response scale.
4. Representing Statements Conduct non-metric multidimensional scaling analysis to draw the point map, which shows the distance between statements; conduct hierarchical cluster analysis to make the cluster map, which shows how statements are grouped; calculate average rating for each statement and cluster, and add such rating to the point map and cluster map to generate the point rating map and cluster rating map,
respectively.
5. Interpreting Concept Maps Participants validate and name the clusters.
6. Utilizing Concept Maps Interpret and explain concept maps using relevant theories and frameworks.
Table 1. Procedures of Trchim’s Concept Mapping Approach
Cognitive mapping involves extracting subjective statements from individuals, within specific areas of interest, about meaningful concepts and relationships among these concepts, and displaying these concepts and relationships in some kind of diagrammatic layout (Swan, 1997). Commonly used cognitive mapping approaches include causal mapping, semantic mapping and concept mapping (Siau and Tan, 2005). Casual mapping is concerned with what events or actions will lead to particular outcomes and portraying the cause-effect relations embedded in individuals’ mental models (Eden et al., 1992). Semantic mapping, also known as idea mapping, explores an idea without the constraints of
superimposed structure (Buzen, 1993). Concept mapping helps understand how various and different concepts are linked in people’s mental models regarding some domain areas (Novak, 1993).
We use concept mapping to reveal students’ mental models of learning challenges. We do not know exactly what these learning challenges are, and so we do not have the “central idea” that is needed for semantic mapping. Causal mapping represents unidirectional antecedent-consequence relation between two concepts, but relationships among learning challenges might not be explicitly causal in nature. Concept mapping is useful in generating and communicating ideas relevant to the topic of interest (Jonassen et al., 1993), and therefore, enables us to identify learning challenges (i.e., the concepts) and how learning challenges are linked (i.e., relationships). Specifically, we use the concept mapping technique developed by Trochim (1989). We choose this technique for three reasons: first, it taps into human mental models and can discover the latent characteristics in learning challenges; secondly, it has been used considerably in many fields such as social services (Galvin, 1989) and healthcare (Valentine, 1989), and is reliable according to generally recognized standard for acceptable reliability levels (Trochim, 1993); last but not the least, it provides clear procedures (as shown in Table 1) for collecting data and allows for systematic analysis and representation of mental models.
Case Study
Course and Subjects
We conducted our empirical study in the Design Object-Oriented Systems course. The course was offered in the College of Business Administration in a large public university to both undergraduate and graduate students in several areas, including IS, computer science, industrial engineering, and management. Conducted in a traditional classroom, the 16-week semester course was lecture-based focusing on introducing the fundamental concepts, syntax, semantics, and the diagramming techniques of Unified Modeling Language (UML). During the course, the students did quizzes, exams and in-class exercises and finished a one-semester long systems analysis and design project using UML. Seven seniors and 25 graduate students, who had successfully completed the course, participated in our study.
Constructing Concept Maps
Concept maps were constructed in four phases: generating statements, structuring statements, representing statements, and naming clusters. Here, one statement represents one learning challenge (i.e., concept) and clusters indicate how learning challenges are related (relationships). The first two phases involves extracting mental models and the last two representing mental models in four concept maps – point map, cluster map, point rating map, and cluster rating map.
Generating statements
We were interested in the difficulties, problem and concerns that students had in learning UML. As students were only exposed to the basics of UML in this course, we focused on their learning challenges in the UML fundamentals - UML notational elements. UML notational elements, defined as UML graphical constructs (i.e., icons, 2-dimensional symbols, paths, and strings) and the combinations of UML graphical constructs, are used to form UML diagrams (Booch et al. 2005). The four kinds of graphical symbols can be used alone and in combination to form notational elements, which in turn, are mapped to construct various diagrams. Figure 1 provides illustration of UML graphical symbols in a Use Case Diagram.
A focus statement was developed and operationalized as: Generate statements (short phrases or sentences) that describe specific problems, difficulties and/or concerns in the drawing and interpretation of UML notational elements. The focus statement was then shown to subjects to elicit statements. Subjects worked individually in generating statements. A total of 112 statements were generated. We then examined these statements to eliminate redundancies. For example, statements “For the generalization, the direct style and the tree style are almost the same", "Direct style and tree style depicted for super – and sub- classes could cause drawing difficulty" were both concerned with two graphic styles in generalization and collapsed into one statement - “In generalization, the two styles (i.e., the direct and tree style) should not be allowed. Having only one style would make it easier.” The accuracy and validity of each statement were checked as well. For example, statements such as “Distinction between squares
and rectangles -- all seem to be rectangles” were removed because these statements are incorrect - squares are not used in UML diagrams at all. After cleaning up the statements, 39 out of the 112 statements remained.
An UML expert, who was an instructor of the UML course and not associated with this research, screened the 112 original statements separately, and came up with 35 statements. After discussion, he agreed that the 39 statements in the statement list compiled by the researchers were a more comprehensive set. This set of 39 statements formed the final statements for further analyses. Due to the space constraints, the 39 statements are not shown here but are available upon request.
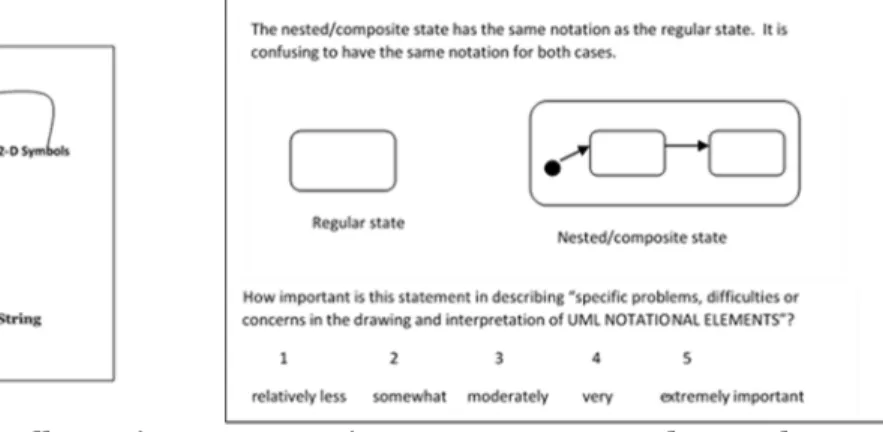
Figure 1. UML Graphical Symbols Illustration Figure 2. Statement Card Example
Structuring statements
After the statements were finalized, subjects sorted and rated the 39 statements individually. We carried out the structuring process in the following three steps:
(1) Showed subjects the 39 statements. To facilitate structuring statements, each statement and its notational illustration were laid out in card format, along with the rating instruction (See Figure 2 for an example). To avoid biases, we removed the statement number from the card and gave the 39 statement cards to subjects in a randomized order.
(2) Asked subjects to sort the statements cards into piles in any ways that made sense to them. We used an unstructured card-sorting procedure (Rosenberg and Kim, 1975) to obtain information about interrelationships among the 39 statements. We instructed subjects to group the statement cards into piles “in a way that make sense to you”. The only restriction in this sorting task was that there cannot be: (a) 39 piles (39 = total number of statements), (b) one pile consisting of all the statements, and (c) one statement is put into more than one pile (i.e., one statement cannot belong to two or more piles).
(3) Asked subjects to rate each statement. After subjects sorted cards into piles, we asked them to rate each statement on a 5-point Likert-type response scale (see Fig. 2 for details for the operational form for rating). Such rating indicated the relative importance of each statement in describing problems, difficulties or concerns in drawing and interpreting UML notational elements.
Representing statements
We conducted several analyses to represent the statements in 4 different concept maps, as described below:
(1) Calculated NxN binary, systematic similarity matrices (N=39 in this case). Two types of similarity matrices were constructed: one was an individual 39x39 similarity matrix for each subject, and the other a total 39x39 similarity matrix for all subjects. In constructing the individual similarity matrix, for any two statements i and j, a “1” was placed in the individual similarity matrix if the two statements were placed in the same pile by the sorter, otherwise a “0” was entered. We had 32 individual similarity matrices. The total 39x39 similarity matrix was then constructed by summing across the 32 individual similarity matrices. Any cell in the total similarity matrix could assume an integer value between 0 and 32 (32 is the total number of sorters), and the value indicates the number of sorters who placed the i,j pair in the same pile.
(2) Conducted a multi-dimensional scaling analysis (MDS) to draw the point map. We analyzed the total similarity matrix using the 2D non-metric multi-dimensional scaling technique in SPSS. The non-metric technique was chosen because the similarity measure in the similarity matrix is of ranking order in nature (Kruskal and Wish, 1978). A 2D solution was chosen for the consideration of the ease of use (Kruskal and Wish, 1978). The MDS analysis yielded the point map, i.e., the 2D configuration of the 39 statements (see Figure 3), where a point represented a statement and statements piled together most often were located more proximately while those plied together less frequently were further apart.
Figure 3. SPSS 2D Configuration (Point Map)
(3) Conducted a hierarchical cluster analysis in SPSS to make the cluster map. The key operative rule for cluster analysis is to maintain the integrity of the multidimensional scaling and partition the MDS configuration into non-overlapping clusters in a 2D space (Trochim, 1989). Ward’s algorithm (Everitt, 1980) is used because it generally gives more sensible and interpretable solutions than other approaches (e.g., single linkage, centroid) (Trochim, 1989). The analysis begins by considering each statement to be its own cluster. The algorithm then combines two clusters until, at the end, all of the statements are in a single cluster. Based on the SPSS hierarchical cluster analysis, the point map as well as on the criterion of sense-making, we made the five clusters (See Table 2 for summary) in the cluster map.
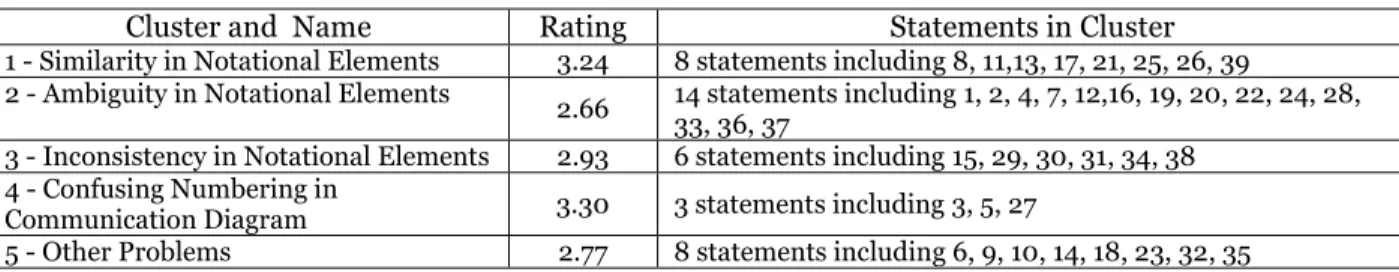
Table 2. Cluster Summary
(4) Calculated the average rating for each statement and the rating for each cluster to construct the point rating map and the cluster rating map. The average rating of each statement was obtained by summing up each rater’s score and then dividing the sum by the total number of raters. The rating for each cluster was calculated by averaging the sum of the average ratings of the statements in the cluster. Table 2 shows the cluster ratings. The average rating for individual statement and for each cluster were then added to the point map and the cluster map respectively to generate the point rating map and the cluster rating map. Naming clusters
Finally, we asked 13 of the 32 subjects to validate and name the clusters. They read the statements in each cluster and agreed that the 5 clusters made sense. They also came up with a phrase to describe each cluster. Based on the names given by subjects, we finalized the name for each cluster (see Table 2 for the cluster names). The UML expert, who independently validated the statement list, went through the cluster list and analyzed cluster names given by the research participants. He agreed that the cluster names were valid.
Cluster and Name Rating Statements in Cluster 1 - Similarity in Notational Elements 3.24 8 statements including 8, 11,13, 17, 21, 25, 26, 39
2 - Ambiguity in Notational Elements 2.66 14 statements including 1, 2, 4, 7, 12,16, 19, 20, 22, 24, 28, 33, 36, 37
3 - Inconsistency in Notational Elements 2.93 6 statements including 15, 29, 30, 31, 34, 38 4 - Confusing Numbering in
Communication Diagram 3.30 3 statements including 3, 5, 27
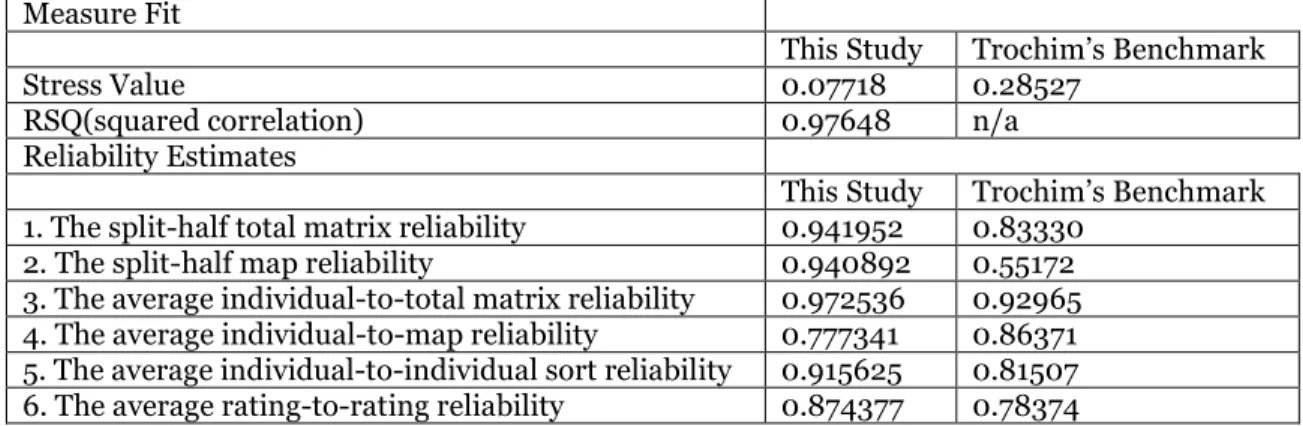
Reliability
The usual statistic, reported in MDS analysis to reflect the goodness of fit of the configuration to the original similarity matrix, is the stress value (Kruskal and Wish, 1978). A lower stress value indicates a better fit. Trochim (1993) also proposes six reliability estimates for concept mapping: Split-Half Total matrix reliability, Split-Half map reliability, Average Individual-to-Total matrix reliability, Average Individual-to-Total map reliability, Average Individual-to-Individual sort reliability, and Average Rating-to-Rating reliability. As shown in Table 3, the stress value and five of the six reliability estimates fall in the benchmark values recommended by Trochim (1993) and the one that does not (that is, the average individual-to-map reliability) is close to the benchmark value, indicating that our concept mapping process is reliable.
Table 3. Concept Mapping Reliability Estimates
Concept Maps and Learning Challenges
The results of the concept mapping process were four concept maps – the point map (see Figure 3), the cluster map, the point rating map, and the cluster rating map. Due to the space constraint, the cluster map and the point rating map are not shown here. Figure 4 is the cluster point map, which include the information from the cluster map and the point rating map.
Figure 4. Cluster Rating Map Figure 5. Ambiguity in Notational Elements
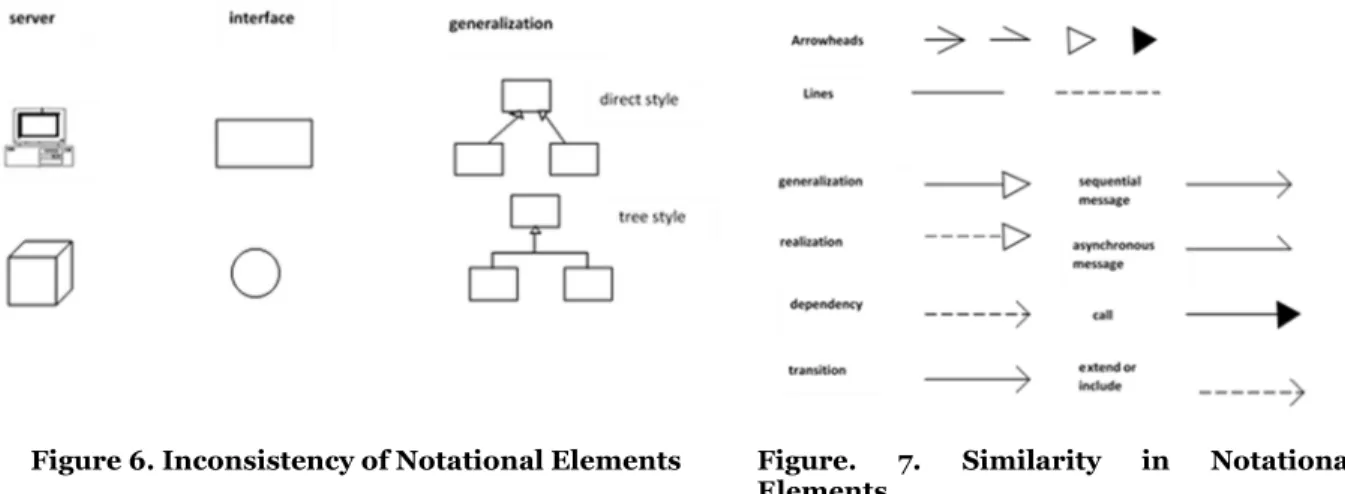
The four concept maps from our concept mapping of students’ mental models reveal the challenges in learning UML notational elements. First of all, students found that lack of one-to-one correspondence between graphical symbol and semantic construct create learning hurdles. Cluster 2 Ambiguity in Notational Elements (see Figure 5) shows construct overload where one 2D graphical symbol is used to represent two or more sematic constructs. Cluster 3 Inconsistency in Notational Elements (see Figure 6) indicates construct redundancy where more than one graphical symbol are used to represent one sematic
Measure Fit
This Study Trochim’s Benchmark
Stress Value 0.07718 0.28527
RSQ(squared correlation) 0.97648 n/a
Reliability Estimates
This Study Trochim’s Benchmark 1. The split-half total matrix reliability 0.941952 0.83330
2. The split-half map reliability 0.940892 0.55172 3. The average individual-to-total matrix reliability 0.972536 0.92965 4. The average individual-to-map reliability 0.777341 0.86371 5. The average individual-to-individual sort reliability 0.915625 0.81507 6. The average rating-to-rating reliability 0.874377 0.78374
construct. Symbol overload increases ambiguity and symbol redundancy adds complexity (Wand and Weber, 1993).
Students also found that the visually similar notational elements burden the learning. As shown in Cluster 1 Similarity in Notational Elements (see Figure 7), different forms of lines and arrowheads, though visually distinct, are confusingly similar at glance. The various combinations of different forms of lines and arrowheads to represent different types of relationships and messages impose even more challenges in distinguishing between graphical symbols.
Similar challenges surface in Cluster 4 Confusing Numbering in Communication Diagram. The three statements in this cluster all show that numbering message passing in Communication Diagram is hard to comprehend. Discrimination relies only on textual characteristics, sometimes in combination with contexts, makes it extremely difficult to detect automatically and in parallel the differences between notational elements. The dependence on unique combinations of visual shapes and textual strings to represent semantic constructs in UML requires more attention, focus, deliberation in the learning process.
Figure 6. Inconsistency of Notational Elements Figure. 7. Similarity in Notational Elements
Cluster 5 Other Problems is an aggregation of the problems, difficulties or concerns not covered in previous clusters. These other problems range from multiplicity, to object lifeline and circle. One very interesting issue raised is the lack of linkage between the various diagrams.
The concept maps also show that Clusters 2, 3, and 5 are very close to each other at the center of the map, while Clusters 1 and 4 are spread out, one on the far right side and the other on the far left corner of the maps. A close examination discloses that Clusters 2, 3, and 5 deal mainly with concepts such as classes, objects, actions, activities, use cases, and generalizations, and Clusters 1 and 4 are more concerned with relationships and interactions between things. That is, learning challenges can be separated into two categories – one related to static aspects (i.e., structures) and the other to dynamic aspects (i.e., behaviors). In addition, the ratings for Clusters 1 and 4 are higher than those for Clusters 2, 3 and 5. That is, the challenges related to relationships and messages are of greater importance than those related to things, despite the fact that the number of statements in Clusters 2, 3 and 5 is greater than that in Clusters 1 and 4.
Discussions and Recommendations
These findings from the concept maps suggest two instructional priorities for the Design Object-Oriented Systems class. First, the top teaching priorities should go to modeling dynamic aspects, specifically in relationships and interactions between different classes, objects, action, activities, use cases, etc. The minute differences in UML notational elements increase cognitive load and result in more time and effort to search, recognize and recall visual information. That is, UML notational elements used to model relationships and messages are low in perceptual discriminability. Low perceptual discriminability slows down the perceptual processes (seeing), where human beings sense the surrounding things, attempt to understand their meanings and gradually recognize relevant information.
Secondly, more class time and lecture should be placed on ambiguous and inconsistent notational elements in teaching how to model static aspects. Symbol redundancy places a burden on choosing which symbol to use and to remember multiple representations of the same semantic construct. Symbol overload leads to ambiguity and the potential for misinterpretation. This lack of construct clarity (i.e., one-to-one correspondence between graphical construct and semantic construct) increases cognitive load, and hinders the speed, ease and accuracy in the conceptual processes (understanding), where human beings infer and derive new information from the information from obtained in perceptual processes, critical to the inductive inference of visual information.
Relevant pedagogical strategies can be used to overcome the obstructions to the perceptual and conceptual processes in learning UML notational elements. For example, organization, an instructional strategy used to direct students to the key concepts (Jonassen, 1988), can facilitate the cognitive processes in learning. Of different organization techniques such as grouping or modularization of materials, topic heading or page heading, summaries, topic introduction and learning objectives (Clark, 2003), the presentation of learning objectives and the provision of summaries are of particular interest to addressing the learning challenges in this course. Providing students with documents that includes both the descriptions and graphical displays of the minute and subtle differences among UML notational elements can help reinforce students’ visual sensory memories. Students can also be required to write out flash cards that compare and outline the differentiating features of similar notational elements. Such activity encourages students to chunk challenging aspects of UML notational elements into logical units for easier recall. In addition, highlighting challenging topics in learning objectives can provide cues for students on what is difficult and needs more attention and effort in learning. These cues help students adjust expectations and effort.
More importantly, more practices on topics that are considered by students challenging should be incorporated into the class. Inexperience with unfamiliar graphical symbols leads to more challenges in discriminating them (Britton and Jones, 1999). While some in-class exercises were built into the class, more practices that focus on the learning challenges are needed to familiarized students with confusing and complex graphical symbols. Practices can take the form of both in-class exercise and homework assignments. Following the work by Schwier and Misanchuk (1993), we recommend to start with practices early and often, first with hints, cues and tips, and then gradually increase time in-between practice with increasing complex and difficult level of practices. For instance, homework can be assigned as soon as two diagrams are introduced in the class to drill students in linking and integrating information from different diagrams. As students progress through the course, the frequency of homework assignments can be decreased while the difficulty levels increase as it is harder and harder to navigate through multiple diagrams. Such use of time and repetition to space learning can help students develop long-term memories that automates information processing.
In addition, we suggest practices with real-life scenarios relevant to what students will do once they complete the course (Reigeluth, 1999). While the class already had a semester-long project in which students modeled a real-world system with multiple UML diagrams outside the classroom, more smaller-scale exercises, which focus on learning challenges, can be integrated into the classroom. This can be approached through a series of mini-cases (Sirias, 2005) used as part of a regular class session. Analysis of mini-cases in class with the instructor at students’ side provides relevance to the material being studied and engage active learning, which, in turn, promote comprehension and retention of material.
In conducting mini-cases, the instructor should have students work in small groups. Students enrolled in this class had different majors and different levels of knowledge and experiences. The instructor can assign three to four students from different major areas into one group, have them work on mini-cases during class and present their findings to the class, and conduct class discussions on the mini-cases. This instructor-controlled groups are different from the student-self-formed project groups in which group members were usually from the same academic areas. As such, they can be more effective in enabling group learning and providing a synergistic learning experience, as students bring their more diverse individual perspectives and prior knowledge and experiences into mini-cases analysis and in-class discussions.
Last but not the least, we propose to provide more frequent and detailed feedbacks to students, as feedback from instructors can reinforce or remediate the new concepts student have just learned (Orrell, 2006). Solutions to the in-class exercise (e.g., drills and mini-cases) should be shared with students.
Feedback for homework assignments should be provided whether the correct or incorrect answers are supplied. The group project, which had a major deliverable due towards the end of the semester, should be revised to include multiple deliverables that each covers a smaller number of modeling techniques. The instructor should provide timely feedback to and allow revision for each group project deliverable. Frequent knowledge checks in the form of feedback provide students guidance as well as force them to monitor their own knowledge acquisition.
Conclusions
In this paper, we have proposed the use of cognitive maps from mental models for evaluating challenges in learning course contents. We have illustrated how to use cognitive maps and mental models to gauge the students’ perceptions of difficult course materials in a real classroom situation and adjust instructions accordingly. The addition of this participatory concept mapping approach to the array of other approaches for understanding and analyzing students learning challenges provides college educators with a more meaningful and efficient evaluation and representation of learning challenges from the students’ perspective. This would be a major aid toward an understanding students learning challenges and a framework of designing strategies for teaching.
Mental models can be both static and dynamic (Gussarsky and Gorodetsky, 1988). The static aspects of mental models describe what are in the mental models, whereas the dynamic aspects reveal how mental models are involved in, for instance, problem solving. The cognitive maps constructed in our study are static representations of mental models. Future research can tap into the dynamic aspects of mental models in learning UML notational elements and diagrams. To capture the dynamic aspects of mental models may require cognitive mapping techniques different from the one we have used in this study. Mental models are fluid evolving over time due to learning (Naveh-Benjamin et al., 1986). The cognitive maps that we constructed in this study provide snapshots at one point of time, that is, at the end of the semester. Future research can generate cognitive maps at multiple points of time during the semester to assess learning challenges at different learning phases. Such information can help the instructor to set and re-set teaching priorities, adjust and re-adjust instructional strategies throughout the semester, to enhance learning experiences and maximize teaching effectiveness.
We have discussed several instructional strategies (e.g., in-class exercise, in-class mini-case, and homework drills) to facilitate the cognitive processes critical in learning UML notational elements, but we have not implemented any of them. Designing assignments and executing them can be another avenue for future research. Future research is also needed to evaluate the effectiveness of proposed teaching strategies by comparing students’ cognitive maps before and after their implementation.
In conclusion, our empirical study has demonstrated that cognitive mapping of mental models is a useful tool in revealing difficulties in comprehending course materials and providing insights into coping instructional strategies. Given the wide of use of mental models and cognitive maps in college education, it is critical to further understand the roles that they play in learning and teaching. It is our hope that the novel use of mental models and cognitive maps, as proposed and illustrated in this study, will stimulate interests and provoke further research in the creative use of mental models and the developing instructional innovations in management and business education.
REFERENCES
Booch, G., Rumbaugh, J., and Jacobson, I. 2005. The Unified Modeling Language User Guide (2nd Ed.), Addison-Wesley Professional.
Britton, C. and Jones, S. 1999. “The Untrained Eye: How Languages for Software Specification Support Understanding by Untrained Users,” Human Computer Interaction, (14:1), pp. 191-244.
Buzen, T. 1993. The Mind Map Book. London: BBC Books.
Clark, R. 2003. Building Expertise: Cognitive Methods for Training and Performance Improvements (2nd Ed.). Silver Spring, MD: International Society for Performance Improvement.
Eden, C. 1992. “On the Nature of Cognitive Maps,” Journal of Management Studies, (29:3), pp.261-265. Eden, C., Ackermann, F. and Cropper, S. 1992. “The Analysis of Cause Maps,” Journal of Management
Eriksson. L. T. and Hauer A. M. 2004. “Mind Mapping Marketing: A Creative Approach in Developing Marketing Skills,” Journal of Marketing Education, (26:2), pp. 174-187.
Everitt, B. 1980. Cluster Analysis (2nd Ed.), Halsted Press.
Farrand, P., Hussain F. and Hennessy, E. 2002. “The Efficacy of the ‘Mind Map’ Study Technique,” Medicine Education, (36:5), pp.426-431.
Fiol, C. M. and Huff, A. S. 1992. “Maps for Managers: Where Are We? Where Do We Do From Here?,” Journal of Management Studies, (29:3), 267-285.
Galvin, P. E. 1989. “Concept Mapping for Planning and Evaluation of a Big Brother/Big Sister Program,” Evaluation and Program Planning, (12:1), pp. 53-58.
Gussarsky, E. and Gordonetsky, M. 1988. “On the Chemical Equilibrium Concept: Constrained Word Association and Conception,” Journal of Research in Science Education, (25:5), pp.319-333.
Ihlenfeldt, W. A. 1981. “Using Cognitive Mapping to Capitalize on Learning Strengths,” Training and Development Journal, (May 1981), pp.99-104.
Jonassen, D. 1988. “Integrating Learning Strategies into Courseware to Facilitate Deep Processing,” In Instructional Design for Microcomputer Courseware, D. Jonassen (ed.), Hillsdale, NJ: Erlbaum, pp.151- 181.
Jonassen, D. H., Beissner, K., and Yacci, M. A. 1993. Structural Knowledge: Techniques for Conveying, Assessing, and Acquiring Structural Knowledge. Hillsdale, NJ: Lawrence Erlbaum Assoc.
Kinchin I.M. 2000. “Concept Mapping in Biology,” Journal of Biological Education, (34:2), pp.61-68. Kruskal, J. B. and Wish, M. 1978. Multidimensional Scaling. Sage Publications.
Nadkarni, S. 2003. “Instructional Methods and Mental Model of Students: An Empirical Investigation,” Academy of Management Learning and Education, (2:4), pp.335-351.
Naveh-Benjamin, M., McKeachie, W. J., Lin, Y., and Tucker, D. 1986. “Interring Students’ Cognitive Structures and Their Development Using the ‘Ordered Tree Technique’,” Journal of Educational Psychology, (78:2), pp.130-140.
Novak, D. J. 1993. “How Do We Learn Our Lesson? Taking Students Through the Process,” Science Teacher, (60:3), pp.50-55.
Orrell, J. 2006. “Feedback on Learning Achievement: Rhetoric and Reality,” Teaching in Higher Education, (11:4), pp.441-456.
Pinto Zipp, G., Maher, C., and D’Antoni, A. V. 2015. “Mind Mapping: Teaching and Learning Strategy for Physical Therapy Curricula,” Journal of Physical Therapy Education, (29:1), pp.43-48.
Reigeluth, C. M. 1999. Instructional Design Theories and Models: A New Paradigm of Instructional Theory (2nd Ed.). Mahwah, NJ: Erlbaum.
Rosenberg, S. and Kim, M. P. 1975. “The Method of Sorting as a Data-Gathering Procedure in Multivariate Research,” Multivariate Behavioral Research, (10:4), pp. 489-502.
Rouse, W. B. and Morris, N. M. 1986. “On Looking into the Black Box: Prospects and Limits in the Search for Mental Models,” Psychological Bulletin, (100:3), pp.349-363.
Schwier, R. A. and Misanchuk, E. R. 1993. Interactive Multimedia Instruction, Englewood Cliff, N.: Educational Technology.
Siau, K. and Tan, X. 2005. “Technical Communications in Information Systems Development: The Use of Cognitive Mapping,” IEEE Transactions of Professional Communication, (48:3), pp.269-284.
Sirias, D. 2005. “Combining Cooperative Learning and Conflict Resolution Techniques to Teach Information Systems,” Journal of Education for Business, (80:3), pp.153-158.
Swan, J. 1997. “Using Cognitive Mapping in Management Research: Decisions about Technical Innovation,” British Journal of Management, (8:2), pp.1983-198.
Trochim, W. 1989. “An Introduction to Concept Mapping for Planning and Evaluation,” Evaluation and Program Planning, (12:1), pp. 1-16.
Trochim, W. 1993. “The Reliability of Concept Mapping,” Paper presented at the Annual Conference of the American Evaluation Association 1993.
Valentine, K. 1989. “Contributions to the Theory of Care,” Evaluation and Program Planning, (12:1), pp. 17-24.
Wand, Y. and Weber, R. 1993. “On the Ontological Expressiveness of Information Systems Analysis and Design Grammars,” Journal of Information Systems, (3:4), pp. 217-237.
Wilson, J.R. and Rutherford, A. 1989. “Mental Models: Theory and Application in Human Factors,” Human Factors, (31:6), pp. 617-634.