HAL Id: hal-00637583
https://hal.archives-ouvertes.fr/hal-00637583v2
Preprint submitted on 28 Nov 2011
HAL is a multi-disciplinary open access
archive for the deposit and dissemination of sci-entific research documents, whether they are pub-lished or not. The documents may come from teaching and research institutions in France or abroad, or from public or private research centers.
L’archive ouverte pluridisciplinaire HAL, est destinée au dépôt et à la diffusion de documents scientifiques de niveau recherche, publiés ou non, émanant des établissements d’enseignement et de recherche français ou étrangers, des laboratoires publics ou privés.
Assessing the potential cost of a failed Doha round
Antoine Bouet
To cite this version:
LAREFI Working Paper CR10-EFI/01
2010
http://lare-efi.u-bordeaux4.fr
LAREFI
Université Montesquieu-Bordeaux IV Bâtiment Recherche Economie Avenue Léon Duguit – 33 608 Pessac
Assessing the potential cost of a failed Doha
round
ABSTRACT:
This study offers new conclusions on the economic cost of a failed Doha Development Agenda (DDA). We assess potential outcome of the Doha Round as well as four protectionist scenarios using the MIRAGE Computable General Equilibrium (CGE) model. In a scenario where applied tariffs of World Trade Organization (WTO) economies would go up to currently bound tariff rates, world trade would decrease by 7.7 % and world welfare by US$353 billion. The economic cost of a failed DDA is here evaluated by the difference between a cooperative scenario (DDA) and a protectionist one (US$412 billion in terms of welfare). Another point of view is to compare a resort to protectionism when the DDA is implemented with a resort to protectionism when the DDA is not implemented. The findings show that this trade agreement could prevent the potential reduction of US$809 billion of trade and, therefore, acts as an efficient multilateral ‘preventive’ scheme against the adverse consequences of trade “beggar-thy-neighbor” policies.
KEYWORDS: trade negotiations, CGE modeling, bound duties, domestic support
1
INTRODUCTION
After seven years of negotiations, participants at the WTO mini-ministerial meeting in Geneva on July 2008 could not reach a final agreement on the Doha Development Agenda (DDA) modalities. Conflicts still exist on several issues regarding the commitments that both developed and developing countries should make. For instance, the United States (US) is still reluctant to tackle the issue of
domestic support to the cotton sector, and India and other developing countries wish to avoid restrictions, such as the anti-concentration clause, on their ability to use flexibility in Non Agricultural Market Access (NAMA) negotiations.
Beyond these very specific elements of disagreement, it seems that the incentives to conclude the Doha Round are weak. Because large market access gains have already been achieved in the
manufacturing sectors of developed country markets (Martin and Messerlin, 2007), the impetus that existed in previous multilateral negotiations has vanished. In addition, the remaining issues are not only more difficult to negotiate, but the political costs are high and the gains are more difficult to assess. For developed countries, liberalizing agricultural markets remains a very complex issue. At the same time, developing countries want to maintain protection in manufacturing and avoid making new commitments regarding services based on nascent industry considerations. Lastly, regional and bilateral liberalizations have reduced the market access gains expected by key players and have fostered resistance to multilateral liberalization that will erode existing preferences. Thus relative to previous negotiations, the incentives to conclude a successful round are much weaker.
In parallel, impact assessments using a CGE model have provided increasingly accurate
quantitative information concerning the gains and losses associated with the DDA in particular thanks to the improved quality of data.1 Great improvements have been achieved since the Uruguay Round assessment, where a lack of information on tariffs led to an overestimation of potential gains. However, improved information has shown that the gains from the Doha Round are lower than previous estimates (Bouët, 2008), since the models now capture the fact that applied tariffs are in most cases lower than their Most Favored Nation (MFN) bound level, due to both binding overhang (the gap between MFN bound and applied rates) and preferences (the gap between MFN and bilateral applied rates). In addition, the
1
It is more questionable whether the CGE models themselves have improved significantly in terms of incorporation of new theory.
implementation of trade scenarios has become more and more precise, adding details and including numerous flexibilities and exceptions that exist, limiting the scope of liberalization (Jean et al., 2008).
The shrinking gains associated with the DDA (see Anderson et al., 2005; Decreux and Fontagné, 2006; Bouët et al., 2006) have led both economists and policymakers to argue that the real gains go far beyond tariff-reduction effects and can be found outside the standard model. For example, gains in productivity, the liberalization of services, and trade facilitation are still only weakly represented in CGE exercises, but may account for a large share of the positive effects of a successful round. Moreover, even if applied tariffs are not cut, the simple fact that tariff lines are bound and that the existing binding overhang is reduced has a significant value because it provides a more stable trade environment.
The goal of this study is not to uncover additional benefits associated with the DDA, but to re-examine the value of an agreement by considering potential gains and losses in a moving landscape of trade policies. Traditional impact studies have assessed the potential gains of the Doha negotiations by comparing the consequences of the negotiation modalities with the status quo baseline. Therefore, the cost of failed negotiations has been seen as just an opportunity cost representing the unrealized gains. This approach, however, may have underestimated the real costs associated with the failure of the DDA. Such a drastic event would make the business as usual scenario uncertain since the status quo is not a long-term perspective for trade policies. The current trend of multilateral trade liberalization may not survive the failure of the DDA and the global public good provided by the WTO that helps to free trade in a stable and less-distorted environment may vanish. Therefore, this study compares the effects of a DDA scenario with these other less attractive alternatives.
Aside from the DDA scenario we study four protectionist scenarios which are characterized by different orders of magnitude and different approaches to trade restriction. Throughout the study we take into account the commitments enforced through the current trading system which limit WTO members’ capacity to impede international trade, in particular through binding border protection. We develop a new database of historical world protection that prevailed from 1995 to 2006. This allows us to examine by how much tariff barriers have decreased since the creation of the WTO and to determine tariff maxima during this period of time which will be the basis of a protectionist scenario. We also use the
MacMapHS6v2 database (Laborde, 2008) on applied and bound protection in 2004 to define another protectionist scenario characterized by the implementation of the highest protection authorized by the current multilateral system.
We implement these different tariff scenarios in the MIRAGE model of the world economy2 in order to evaluate the economic consequences of these cooperative and protectionist outcomes. The difference between cooperative and protectionist scenarios represents a potential reduction of US$2,261 billion in trade (in constant prices) if we refer to bound tariffs, and US$1,170 billion if we refer to maximum tariffs implemented between 1995 and 2006.3
Another point of view is to consider the WTO agreement as a ‘preventive’ scheme against potential trade wars. This is why a comparison is undertaken between a resort to protectionism when the DDA is implemented and a resort to protectionism when the DDA is not implemented. It is shown that this trade agreement could prevent the potential reduction of trade by US$809 billion. Therefore it acts as an efficient multilateral ‘preventive’ scheme against the adverse consequences of trade “beggar-thy-neighbor” policies. The reference scenario for this figure is a situation in which countries adopt bound duties; alternatively, if we consider a situation where countries adopt the highest tariffs implemented between 1995 and 2006, world trade would be reduced by a supplement of US$581 billion. These new findings clearly reappraise the potential cost of a failed Doha Round. As stated by Pascal Lamy in his speech at the Lowy Institute in Sydney on March 2nd, 2009: “the Doha Round is the most effective way to
further constrain protectionist pressures by reducing the gap between bound commitments and applied policies.”4
The study is structured as follows. Section 2 details the motivation of this study. Section 3 describes the methodology. Section 4 presents the results of all scenarios, both in terms of level of border protection and in terms of economic impact. Section 5 concludes.
2
BACKGROUND
The purpose of this section is to provide a detailed background for this study. We undertake a new assessment of the Doha scenario, based on the most recent modalities and also evaluate several completely different scenarios aimed at estimating the potential cost of a worldwide resort to
2
MIRAGE means Modeling International Relationships in Applied General Equilibrium. It is a country, multi-sector dynamic CGE model, developed initially at the Centre d’Etudes Prospectives et d’Informations Internationales (CEPII) in Paris. A full description of the model is available in Decreux and Valin (2007).
3
Throughout this article, we evaluate scenarios by their deviation from the baseline for the 2020 horizon. We compare two scenarios by comparing these two deviations.
4
protectionism. Are these latter scenarios realistic? First, we consider the recent wave of protectionist and “beggar-thy-neighbor” policies adopted since early 2008 and conclude that there is no straightforward evidence that the threat of trade war has recently increased. Second, we examine historical data on world protectionism and point out that trade policies are constantly evolving. Third, we review the economic literature in order to understand the rationale for these up-and-down variations in applied protection.
2.1 Has protectionism recently increased?
It has often been stated that since September 2008, rising protectionism has occured among WTO members, mixing increases in MFN duties, non – tariff barriers and the proliferation of anti-dumping duties (see Baldwin and Evenett, 2008 and 2009, for example). Border measures have recently been implemented like non-automatic licensing requirements by Argentina or tariffs on steel products by India. Numerous “bail-out” measures, apparently related to the banking and financial crisis, have also been adopted and contain protectionist measures like the “Buy American” provision included in the US stimulus package agreed on February 2009.5
All these measures, which in one way or another subsidize domestic firms, are questionable in terms of their compatibility to the WTO law (Bhagwati and Panagarya, in Baldwin and Evenett, 2008), especially if they survive the crisis. The WTO authorizes domestic subsidies when aimed at restructuring businesses, promoting innovation and/or assisting displaced workers (Hufbauer and Schott, 2009).
However, some of these measures are only weakly linked to the financial crisis, especially those trade policy modifications that have been initiated in early 2008 and fully implemented at the end of the year. With regard to the WTO, all border measures implemented so far are compatible since their tariff increases respect the bound commitments. Some “bail-out” measures may also be WTO-compatible, if temporary. The US “Buy American” provision violates the WTO Government Procurement Agreement under which Canada, the 27 European Union (EU) countries, Hong Kong, Iceland, Israel, Japan, Korea, Liechtenstein, Norway, Singapore, Switzerland, and the US have to open procurement to competition from firms based in the signatory countries (Hufbauer and Schott, 2008). This obligation is not extended to all WTO members; firms from Brazil, China, and India cannot complain about this provision.
5
On September, 16th, 2009, the Global Trade Alert website listed 573 ‘red’ measures adopted throughout the world during the 2008-2009 global downturn, that is to say measures that have been implemented and that are almost
While “bail-out” and restructuring measures may be understood as an attempt to alleviate the disastrous economic impact of the banking and financial crisis, the alleged recent increases in “beggar-thy-neighbor” protectionist policies are not obvious in the data. Most of the figures pointing out a multiplication of increased import tariffs or anti-dumping procedures do not make temporal comparisons (like a report to the Trade Policy Review Body – TPRB – by the WTO staff; WTO, 2009) or compare 2009 with 2007 as a year of reference. The “Recession and protectionism ‘within the rules’: Risks to the Multilateral trade system” – a monthly newsletter of the Institute for the Integration of Latin America and the Caribbean (INTAL) – states that “according to the information from the International Trade Centre (ITC) and the WTO, during the first half of 2008 the number of antidumping cases raised by 40 %”. The newsletter, however, does not specify if the reference is the first half of 2007, and neither does it provide medium term references. Gamberoni and Newfarmer (2009) affirm that “after a period of slowdown, the number of antidumping cases (both investigations initiated and imposition of duties) surged in 2008, especially in the second half of 2008. Compared to 2007, antidumping initiations grew by 15 % and findings with imposition of duties grew by 22 %.” Again, we do not know if 2007 is the right comparison. In addition, during a period of economic crisis, exporting firms are prone to reduce their prices to support demand. This leads mechanically to an increase of antidumping investigations without requiring a more protectionist attitude of trade authorities.
<FIGURE 1 INCLUDED HERE>
Figure 1 indicates trade disputes handled by WTO from 1995 to 2009 (second quarter). As seasonal variations are large, they are cumulated on four consecutive quarters. Of course, there is a lag between the time when a protectionist measure is implemented and the time when a complaint is filed. Therefore, the observed increase in the number of trade disputes during the last quarter of 2008 might reflect the increase of anti-dumping procedures noted in early 2008. In that case, this is not unique since the same phenomenon occurred in 2000 and 2002. Moreover the cumulated number of trade disputes in four consecutive quarters has decreased in the first quarter of 2009 and is under the level attained in the same quarter in 2007 and 2005. There is no indication of a recent surge in protectionism.
It should be noted, however, that reliable information is difficult to gather. For example, the WTO Staff makes references to protectionist measures but concedes that “the information on changes in
trade policies and trade-related policies contained in this report has been collected by the Secretariat from a variety of public and official sources. In some cases it has been possible to verify the information through formal channels, but in most cases it has not.” (WTO, 2009)
2.2 The moving landscape of trade policies
It is often stated that pressure for protectionism is cyclical. Although this statement is rather difficult to support with concrete evidence, it can be easily demonstrated that protectionism has been cyclical in rich countries from the end of the eighteenth to mid-twentieth century. Figure 2 points outs this “cyclicity” in the US from 1891 to 1940, after which the US tariff has followed a liberalizing path. This pattern can also be found in France (see Messerlin, 1985) and other European countries (Bairoch, 1995, or Irwin, 1992 amongst others).
<FIGURE 2 INCLUDED HERE>
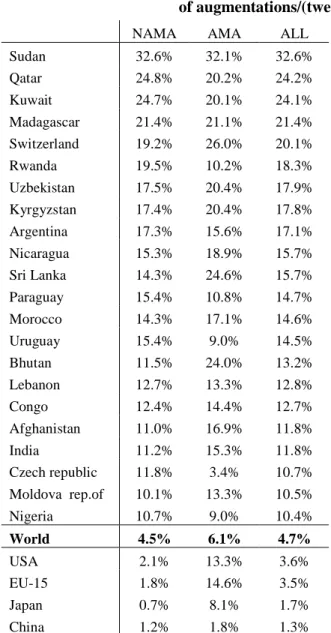
Does this conclusion apply to all countries throughout the world? It is difficult to say since no historical database on applied protection exists at the world level. In addition, a decreasing national average can hide increases in tariffs at the product level. This is why we examine the frequency of tariff increases at the HS6 (Harmonized System – 6 digit) level from one year to the other in 164 countries between 1995 and 2006 using the TRAINS (TRade Analysis and INformation System) database (see Table 1).6 We calculate the Ad Valorem Equivalent (AVE) of MFN applied protection (ad valorem duties and specific duties) for each reporting country HS6 line every year, and the frequency of tariff
augmentation defined as the number of MFN tariff augmentations divided by the product of twelve years and the number of HS6 lines.
<TABLE 1 INCLUDED HERE>
As the AVE of specific tariffs may vary due to changes in unit values and as we wish to focus on discretionary variations of import duties, and not on variations of import duties induced by price inflation (or deflation), we neutralize the effect of unit value variations by assessing AVE of specific duties based on the 2004 unit value for every year from 1995 to 2006. Table 1 identifies 22 out of 164 countries in the database for which the frequency of tariff increase has been greater than 10 %. It also shows the
frequency calculated for agricultural and non-agricultural products by displaying figures at the world level as well as at the national level for the US, the EU-15, Japan, and China.
At the world level, the frequency of tariff augmentation is significant, even if not very large: close to 4.5 %. While this frequency was higher than 20 % in the case of five countries (Sudan, Qatar, Kuwait,
6
TRAINS is an information system developed by UNCTAD at the HS-based tariff line level covering tariff, para-tariff
and non-tariff measures as well as import flows by origin for more than 160 countries (see http://r0.unctad.org/trains_new/index.shtm).
Madagascar, and Switzerland), it was zero during this period for eleven countries: Cyprus, Eritrea, Gambia, Guinea, Haiti, Hong Kong, Macau, Mayotte, Palau, Slovakia, and Syria. In general, tariff augmentations are more frequent in the agricultural sector,7 but this is particularly true in rich countries like the EU-15, the US, Japan, but also Norway, and in middle-income countries, like Poland and Ukraine. In Norway for example, from 1995 to 2006, while annual tariff augmentations occurred in only 0.2 % of all non agricultural cases, they were noted in 22 % of agricultural cases.
Table 2 displays the frequency of MFN tariff augmentation from 1995 to 2006 for countries based on whether they are WTO members (WTO) or not (non WTO), whether they are classified as Least Developed Countries (LDC) or not (non LDC), Middle Income Countries (MIC) or not (non MIC), or OECD (OECD) or not (non OECD). Finally, these ratios are calculated for all sectors (ALL), and for agricultural sectors (AMA) or non agricultural sectors (NAMA).
<TABLE 2 INCLUDED HERE>
The propensity to augment MFN tariffs is lower among WTO members than among non-WTO countries, and lower in industry than in agriculture. It appears that LDCs have raised their MFN tariffs less
frequently than the world average 8, while MICs have done so more often. The propensity of OECD countries to augment their MFN tariffs is low in industry, but relatively high in agriculture – higher than in MICs and LDCs.
2.3 Economic crisis, trade wars, and retaliations
The current financial crisis ostensibly fosters demand for protectionism, and could lead to new trade barriers as occurred after the October 1929 crisis. A parallel can easily be drawn between the current situation and the one that existed then. In the early 1930, unemployment was rising, fear of deflation was prevailing, and a lack of public resources (which was more pronounced in countries that paid war
reparations) prevented governments from remedying the economic crisis. Moreover, today as in 1930, the context of decreasing prices can mechanically reinforce protection, as specific duties (defined as
monetary amounts by physical units), which are numerous in agriculture, become more and more
7 Due to the volatility in agricultural prices, governments adjust trade policies more frequently. This fact is consistent with the
political economy model used when we design trade policy scenarios (Jean et al. 2008).
8
These findings are consistent with previous works (Laborde, 2008) that emphasize the fact that LDCs have less sophisticated trade policies than more developed economies, in particular due to the lack of administrative capacity.
restrictive as world prices decline. In this type of economic context, protectionism is a tempting policy instrument for policymakers—it short-sightedly increases domestic prices and supports domestic activity, and it provides new public revenue. In the Republican platform of the 1928 presidential election, the tariff was presented as the “household remedy” (Isaacs, 1948)..
But the role of the Smoot-Hawley Tariff Act and the subsequent tariff retaliations in the decline of trade after 1930 should not be overestimated: recent evaluations (Irwin, 1998; Madsen, 2001) show that discretionary increases in tariff rates explain only a minor part of the post-1929 contraction of trade. For example, Madsen (2001) estimates that real world trade declined from 1929 to 1932 by approximately 14 % because of decreasing national incomes, 8 % because of discretionary augmentations of tariffs, 5 % because of deflation-induced tariff increases and 6 % as a result of non-tariff barriers.
It is theoretically and empirically proven that trade openness is employment-creating and income-supporting in sectors in which an economy has a comparative advantage, but has a negative impact on employment and incomes in sectors where the economy has a comparative disadvantage. This implies that trade openness leads to a restructuring of an economy which can be costly, and trade openness is less unpopular in times of economic growth. During economic recession, the job market provides fewer opportunities and any threat to existing jobs is badly perceived, in particular in countries with a limited social protection net and where adjustment costs are large. In time of stagnation, lobbying for protection will increase above usual levels in sectors without comparative advantage, especially when sectors are small and geographically/socially homogenous (Olson, 1965). This explains why demand for protection is so strong in the US sectors of automobile and textile and apparel, in the European sectors of agriculture and automobile, in the Japanese agricultural sector, and so on.
The interdependence of trading partners may increase the probability of a trade war as affected governments adopt retaliatory measures: governments typically do not correctly anticipate world
retaliation and counter-retaliation, as was the case with the US in 1930 and also in 2007/2008 when in the middle of the food crisis, governments implemented export bans and export restrictions in successive rounds of retaliation and counter-retaliation. The theory of retaliation has two conclusions that are relevant for our purposes:
(i) Big countries can benefit from a trade war while small countries always lose (Johnson, 1953). This point has been recently re-iterated by Soesastro (in Baldwin and Evenett, 2009) who argues that small countries, which are more dependent on international trade, could be severely damaged by a trade
war, while large countries like the EU or the US, which are much more independent, can benefit from the adoption of import tariffs which could substantially decrease the world prices of their imports.
(ii) Trade wars may be long and damaging when countries do not identify who is at the origin of the process and conversely, countries have to be “nice” in order to reestablish cooperation as quickly as possible (Axelrod, 1981.)
Finally, there is another reason that may contribute to rising protectionism. The deadlock of the DDA comes mainly from disagreements between rich and emerging countries: between India and the US on Safeguard Special Mechanism in agriculture, between the US and West Africa on cotton, between the EU and Brazil on tariff reduction in agriculture. This clearly defines a line of demarcation that could become the basis of future trade disputes.
In this section, we have seen that if there is no strong evidence of rising protectionism today, at least until September 2009, trade policies are changed by policymakers in reaction to economic
circumstances. Current economic conditions could contribute to a complete change of mood in terms of trade policies. In fact, even the post Second World War period, which is a remarkable period of history in terms of trade policies becoming freer and freer, trading partners, including WTO members, frequently augmented tariff protection when needed. This is particularly true for Middle Income Countries in all the sectors and for OECD countries in agriculture.
3
ALTERNATIVE SCENARIOS AND METHODOLOGY
Based on this background, we aim to compare the gains of trade cooperation with protectionist alternatives, but also how a negotiated DDA can protect the world trading system from a rise in protectionism.
With this objective, we implement different scenarios and compare the following:
i) the implementation of the December 2008 package with different protectionist scenarios (elimination of binding overhang; implementation of the highest MFN tariff applied during the 1995-2006 period for each importing country at the product level); ii) the implementation of these protectionist scenarios in a situation where the DDA is not
implemented with a situation where it is implemented. This element will show us how a new trade negotiation will prevent the world trading system from trade wars.
These assessments are carried out using the MIRAGE CGE model of the world economy with protection data coming from the MAcMapHS6 database and a new historical database on MFN applied protection. The remaining of this section offers a methodological overview followed by a detailed description of each scenario.
3.1 Methodology
3.1.1. Data treatment
Tariff reform is implemented at the HS6 product level of the MacMapHS6v2.1 database with bound and applied tariff data for 2004 (including 5,113 products, 170 importing countries, and 208 exporting countries) .9 We add several updates to take into account all major changes that occurred up to 2008, including major regional trade agreements (RTA), new WTO members (such as Ukraine), and the trade policy consequences of ongoing domestic reforms (as the EU Sugar trade reform). The TRAINS databasewas used to investigate tariff changes since 1995, and a special procedure was adopted to ensure comparability of MFN tariff rates between MacMapHS6 and TRAINS. For ensuring inter-temporal comparison of nominal protection, all specific tariffs are converted using the reference group unit values for 2004 from MAcMapHS6v2.10 However WTO published detailed guidelines in order to know which reduction coefficient has to be applied on specific duties.11 Therefore in our design of the policy scenario and for the purpose of tariff reduction formula classification, the official guidelines to compute unit values are used.
The Doha scenario and the free trade agreements that are included in the baseline give countries the freedom to select products eligible to certain clauses: these are either the Sensitive Products or the
9
Slight modifications have been made on the MAcMapHS6v2.1 dataset: Malaysia’s tariffs on tobacco products are updated (lowered), marginal protection on Chinese cereal TRQs are reduced and protection faced on sugar and banana by ACP countries in the EU market is modified to better capture preference erosion mechanisms.
10
This method (exporter’s reference group unit value) implies that the unit value taken for the AVE calculation of specific tariffs is the median unit value of world exports by a group of countries similar –from the point of view of trade- to the exporting country; it is aimed at: (i) reflecting the different restrictive impact of specific tariff on exporting countries according to their vertical specialization (the specific duty imposed by the EU on pork sausages, for example, has a different protectionist impact whether the partner exports low price or high price pork sausage); (ii) exhibiting not excessive volatility (see Bouët et al., 2008).
11
In agriculture WTO members negotiate on reduction coefficient to be applied on ad valorem tariffs defined by intervals: tariffs from x% to y% will be reduced by z%. This does not specify by which extent specific duties (US$ per ton for example) will be reduced. These official guidelines describe in particular how AVEs of specific duties have to be calculated to select the right reduction coefficient. Our approach follows these guidelines published by WTO as well as the timetable of implementation when specified.
Special Products clauses that allow rich and developing countries to choose a list of products that will be less liberalized, or the exception clause included in the Duty Free – Quota Free regime that will be given by OECD countries to LDCs –this clause implies that OECD countries will have the right to exclude 3% of tariff lines from this regime-, or the binding rules under which countries have to define a list of unbound tariff lines that have to be bound at the end of the Round. As the rule is ‘no rule’, we have to define a criterion of selection of these products in our modeling. We use the idea of the model developed by Jean et al. (2008). It is based on a political economy approach where the government (common agent) gives protection to economic sectors (multi-principals) against financial transfers and maximizes a function which includes national welfare and these financial transfers. Concerning exemption clauses, as a result of this model, the government is supposed to select lines which maximize a political economy indicator depending positively on the height of the tariff and the magnitude of imports. An extension of this model is used to define the choice of tariff lines to be bound by developing countries in the DDA scenario. Indeed, for a particular scenario when we combine tariff increases with the DDA
implementation, it is very important to have a theoretically based approach to define the new bound tariffs, in particular for countries (SVE –Small and Vulnerable Economies-, LDCs, and initially low binding countries) that benefit from wide flexibilities to achieve their new binding coverage goal.12 The DDA modalities (WTO, 2008 TN/MA/W/103/Rev.3) define in this case the overall constraints faced by each country. Finally, when WTO members liberalize under the DDA, we suppose that the market access remains unchanged for non-WTO members.
Tariffs are aggregated from the HS6 level to the model aggregation (see below) using the
reference group weighting scheme methodology13 (see Boumellassa et al., 2009) and then implemented in the MIRAGE multi-country, multi-sector dynamic model. We assume perfect competition across all sectors.14 Based on standard and robust assumptions, it should be noted that the model may underestimate the positive effects of trade reform, particularly when such reform drives new investments, technology improvements, or important trade or production diversification.
12
The only difference with the approach defined in Jean et al., (2008) is that in order to compute the political cost of any new commitments, we do not take into account the applied tariff in 2004 (the base year), but the highest tariff during the 1995-2006period.
13
This weighing scheme (reference group) implies that we weight a tariff imposed by country r on a product i coming from s by the imports of a group of countries similar to r –from the point of view of trade- of product i coming from country s; it is aimed at: (i) reflecting the structure of country r’s trade; (ii) avoiding the endogeneity bias arising from a bilateral trade weighing scheme (see Bouët et al., 2008).
14
The MIRAGE model makes possible an imperfect competition assumption and it has been used in previous quantitative assessments. However this hypothesis requires information about sector mark-ups, number of firms and magnitude of fixed costs which is difficult to gather for developing countries.
Macroeconomic data (such as world trade flows, production, consumption, and intermediate use of commodities and services) come from the Global Trade Analysis Project (GTAP) 7 database (see Narayanan and Walmsley, 2008 for a full documentation). Twenty-seven regions are identified in the model, which map the main trade blocks. The sectoral decomposition is highly detailed in terms of agriculture and agrifood business (twelve sectors), since most of the protection is concentrated in this sector. All other sectors are non-agricultural, including thirteen industrial sectors and two service sectors.15
3.1.2. A snapshot of MIRAGE
In each country a representative consumer maximizes a CES-LES (Constant Elasticity of Substitution – Linear Expenditure System) utility function under a budget constraint to allocate his income across goods. The origin of goods is determined by a CES (Constant Elasticity of Substitution) nested structure following the Armington assumption.16 In addition, Northern countries are supposed to produce high-quality industrial goods, as compared to those supplied by Southern countries. On the production side, value added and intermediate goods are complements under a Leontief hypothesis. The value added is a CES function of unskilled labor and a composite of skilled labor and capital: this allows for including less substitutability between the last two production factors. In agriculture and mining, production also depends on land and natural resources. New capital is perfectly mobile across sectors while installed capital is immobile. Skilled labour is perfectly mobile across sectors while unskilled labor is imperfectly mobile between agricultural sectors and non-agricultural sectors. Total employment is constant. Investment is savings-driven and the real exchange rate is adjusted (through price adjustments) such that the current account is constant in terms of world Gross Domestic Product (GDP). This last assumption is important in this study since tariff reductions (Doha scenario) and tariff increases (protectionist scenarios) will have positively correlated impacts on both imports and exports for every country.
3.1.3. Baseline
15
Geographic decomposition is presented in Appendix 1. Sector decomposition is not given here as we do not make any comment on sector variables. This sector decomposition can be requested to the authors.
16
The MIRAGE model is based on GTAP Armington elasticities which are low as compared to those used in other models (the World Bank’s LINKAGE model for example).
A baseline is implemented from 2008 to 2025, which depicts the world without a new multilateral agreement. Concerning trade reform, new agreements adopted since 2004 have been included in the baseline: they are listed in Appendix 2.17
This baseline serves as a point of comparison with all the scenarios. The results are reported for the year 2025. Results are presented as the difference for a macroeconomic variable in 2025 between the baseline and the scenario. Therefore this variation represents the unique impact of the policy shock described in the scenario. The analysis does not account for the surge in world prices of energy and food products between 2004 and 2008. However, exogenous increases in active populations are included in the model and each country’s global factor productivity is affected such that GDP evolution, as described by the model, corresponds to the World Bank’s GDP predictions.
3.2 Describing alternative scenarios
The five scenarios analyzed here include the Doha compromise, as described by the December 2008 modalities, and four protectionist alternatives.These are:
(i) DDA: December 2008 modalities
(ii) Up to Bound: Non FTA applied tariffs increased to existing bound levels.
(iii) Bound&DDA: Implementation of December 2008 modalities plus non FTA applied tariffs
increased to new, post DDA, bound level.
(iv) Up to Max: Non FTA applied tariffs increased to their maximum over the last 10 years,
capped by existing bound tariffs.
(v) Max&DDA: Implementation of December 2008 modalities plus non FTA applied tariffs
increased to their 10 year maximum, capped by new, post DDA, bound tariffs.
3.2.1 The DDA scenario
The first scenario represents a successful Doha outcome based on December 2008 modalities. After seven years of trade talks, market access modalities have reached a high level of sophistication. Even if the general philosophy is simple, with progressive tariff-cut formulas for both agricultural and nonagricultural goods, many flexibilities have been introduced with different degrees of special and differential treatment for different groups of developing countries. Following previous research (Laborde
17
et al,. 2008, and Berisha et al., 2008), this scenario implements all the details of these modalities18 in terms of market access including tariff cutting formulas, country and product flexibilities (sensitive and special products) as well as special provisions for tariff escalation, tropical products and long standing preferences. The scenario does not account for any changes on the sectoral initiative due to the lack of agreement on this issue.
For the duty-free-quota-free market access initiative for least developed countries (LDCs) and OECD countries (excluding South Korea but including Mexico and Turkey), we assume a 3-% exemption clause in terms of products.19 Export subsidies are phased out by 2013 for developed countries.
Concerning domestic support, this scenario includes the constraint on Overall Trade Distorting Support (OTDS) for the US and the EU. In contrast to most traditional exercises where domestic support commitments are translated into ad valorem or specific subsidy caps for current applied policies, we explicitly introduce the OTDS as an overall limit for domestic support spending for each year. In the dynamic context and due to the growth of production in the baseline, the initial agricultural subsidy rates, based on 2004 prices, may lead to a violation of the new commitments. In our simulation, it appears that only the US will face a real constraint forcing it to modify its production distortive programs20. With the reduction scheme of the OTDS on one hand, and the increasing production on the other, we estimate that subsidy rates of production and on some primary factors should start to decrease by 2011 and will have to be halved by 2025 down to the final US$16.4 billion limit. Any domestic support reduction is assumed to impact all sectors in a uniform way. Since this paper focuses on tariffs and tariff changes across scenarios, we have introduced neither a program-specific modeling of domestic support policies, nor a political economy model aimed to explain how domestic support reduction across commodities will be handled. Our goal here is just to show that the new OTDS commitments, even if they do not drive domestic support reduction today, have a real value on the medium run. The consequences of this treatment are discussed in Appendix 3.
Due to the complexity of integrating other elements of the DDA agenda into the simulations, other sources of potential gains are omitted, such as liberalization in services, WTO rules, trade facilitation and intellectual property rights.
18 A full description of the modalities implemented in this study is provided in Laborde et al. (2008). This scenario is based on the
December 2008 Modalities (WTO documents TN/AG/W/4/Rev.2, TN/MA/W/103/Rev.1).
19
This scenario mimics Scenario F in Berisha et al. (2008).
20
3.2.2 Up to Bound Scenario
Two protectionist scenarios are analyzed in order to offer a contrasting picture with the DDA. The first option, the Up to Bound scenario, examines the possibility that WTO countries increase their tariffs up to their Uruguay Round (UR) bound level in a five-year period (2009-2014). It assumes that the entire binding overhang will be eliminated. For unbound lines, the existing average binding overhang is applied to compute new tariff targets.21 In this scenario, only MFN applied rates and non-reciprocal, preferential rates are modified. The only non-reciprocal program that is maintained is the EU’s
“Everything but Arms” initiative due to the way this program has been implemented and renewed in the EU legislation. Other non-reciprocal preferences given by rich countries to poor countries are removed.22
This scenario represents a strong increase in protection by eliminating all unilateral liberalization, but does not represent an open trade war between WTO members. Existing commitments are still
respected.23
On one hand, this scenario may appear extreme since many developing countries used ceiling binding to bind their tariffs during the Uruguay Round to levels that they have never and may never apply. Countries also apply zero tariffs on a large selection of raw materials and imported inputs even if the existing bound tariffs are strictly positive.
On the other hand, Up to Bound is not the worst scenario that can be anticipated. Many countries have not bound their import tariffs yet and are not constrained today by any upward limitation. In our scenario, applying bound duties can underestimate in some cases the desire for high protection on some specific products. Moreover, anti-dumping duties and safeguard mechanisms can be activated and can restrict trade even in rich countries where binding overhang low or zero.
21 We estimate a linear relation for each country relating bound duties to MFN applied duties (Bound _Rate = a MFN_rate + b),
where Bound_Rate is a MFN bound duty and MFN_rate a MFN applied duty. Then we apply estimated parameters a and b on applied MFN rate to build a theoretical bound tariffs for the unbound lines.
22
Examples of preferences removed are the US African Growth Opportunity Act, the US Caribbean Basin Initiative, the European GSP (given to non LDCs), other GSPs from Japan, Norway… EPAs are supposed to be reciprocal agreements: therefore they are not removed.
23
Even while adhering to their commitments, we may imagine that countries will use additional tools to increase their protection above bound level by using contingent protection, and by initiating litigation cases that would allow them to retaliate.
3.2.3 Bound&DDA scenario
Two scenarios intend to measure the extent by which the implementation of the December 2008 package could reduce the potential cost associated with a new trade war by lowering bound duties. Scenario Bound&DDA combines the DDA scenario and the Up to Bound scenario, but the bound duties that are used are those derived from the December 2008 package. Therefore, the difference between this scenario and the Up to Bound one represents the extent by which the DDA could reduce the capacity of WTO members to augment MFN tariffs. The treatment of unbound tariffs is very different in this scenario from the treatment in the Up to Bound case. Contrarily to the previous case where an average binding margin was applied in an uniform way based on existing binding overhang, in this scenario we apply the new DDA constraints in terms of binding rules based on the Jean et al. (2008) political economy approach combined to past trade policy behavior (see discussion in section 3.1). As previously, only MFN applied rates and non-reciprocal preferential rates are modified.
3.2.4 Up to Max Scenario
To adopt a more realistic protectionist scenario, historical data were used to determine the highest MFN applied protection rate implemented by every country during 1995–2006. In order to take into account bound tariffs implemented during the Uruguay Round (UR), the minimum between the historical maximum level and the existing bound tariffs was applied to all regions of origin for which no preference exists or for which we decided to remove a preference. This Up to Max scenario corresponds to a case whereby governments apply the most adverse trade policies of the past 10 years, but still respect their UR commitments. On an historical basis, tariffs evolve as a response to changes in world prices, domestic production structure, and political pressures. In that sense this scenario is politically realistic. It is important to note that in all scenarios with increasing tariffs, the preferential tariffs protected by bilateral or regional agreements are unchanged.
3.2.5 Max&DDA Scenario
In this scenario, the same combination (DDA plus a protectionist option) is adopted but the DDA scenario is combined with the Up to Max scenario. As new bound duties have been defined in the
December 2008 package and as the tariff applied is the minimum between the highest duty applied during the 1995-2006 period and the newly defined bound duty, this scenario differs from the Up to Max
scenario. The difference between them represents the benefit from the DDA as a ‘preventive’ scheme against trade wars. As previously, only MFN applied rates and non-reciprocal preferential rates are modified.
4
RESULTS
4.1 Impact on protection and market access
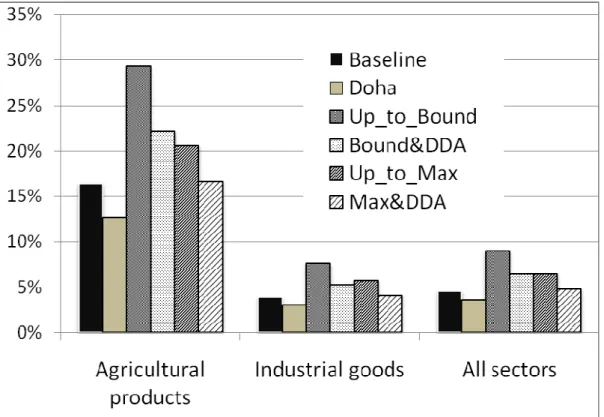
Figure 3 displays the consequences of these five scenarios on average world tariffs (the baseline is also represented.)
<FIGURE 3 INCLUDED HERE>
The Doha scenario will reduce world protection by 22 %, from 4.6 % to 3.6 %. Moving to bound tariffs (Up to Bound scenario) will nearly double the level of protection on average. The elimination of unilateral tariff reductions enacted during the past 10 years (Up to Max scenario) has a more limited impact but still represents an increase of 41 % in world tariffs compared to the baseline (from 4.6 % to 6.4 %).
The implementation of the December 2008 package has a significant impact on potential future trade wars. If the DDA is not implemented, current protection can be doubled when countries resort to bound levels, while it increases by only 41 % in case the DDA is implemented (Bound&DDA). Under the Max&DDA scenario world protection increases by only 5 % compared with 41 % under the Up to
Max scenario. These comparisons show the extent to which the implementation of the December 2008
package could avoid costly protectionism.
In agriculture, the differences between scenarios are more extreme. World agricultural protection decreases by 23 % if the December 2008 package is implemented while it decreased by 180% if bound duties are applied. Comparison of world agricultural protection under a DDA (12.6 %) and under a global resort to pre-DDA bound duties (29.4 %) provides a ratio of 1 to 2.33. When the reference is maximum duties applied in the 1995-2006 period it is 1 to 1.63.
<TABLE 3 INCLUDED HERE>
Table 3 displays the results in terms of protection applied on imports by group of countries. The
DDA scenario will cut applied protection by one-third for HICs (from 3.0 % to 1.9 % in all sectors, but
from 15.6 % to 10.3 % in agriculture) and one-tenth for MICs (from 8.5 % down to 7.8 % in all sectors), a significant achievement when compared to previous GATT rounds. It will also lock-in existing market access due to unilateral liberalization on a MFN or nonreciprocal preferences basis. Indeed, under the Up
compared to the current levels. Under the Up to the Max scenario, protection in the same three groups of countries increases by 23 %, 56 %, and 67 %, respectively.
At the same time, the December 2008 package gives world exporters a ‘preventive’ scheme against potential rise in applied protection by MICs and LDCs: in the case of MICs while protection can be augmented from 8.6 % up to 14.0 % (bound level) in case of implemented DDA, it can be augmented up to 19.8 % today. As far as LDCs are concerned if we compare the case Up to the Bound and
Bound&DDA scenarios, we can see that tariffs will increase more in the latter case. Indeed, the
flexibilities granted by the DDA modalities to bind tariffs will provide more freedom to increase tariffs than the homogenous binding overhang rate applied to build the Up to the Bound scenario. By using the political economy model in binding tariffs combined with the new rules, governments can achieve higher level of protection than using a homogenous rate of binding overhang computed on existing bound tariff lines. This is consistent with the idea that the most sensitive products are the unbound ones.
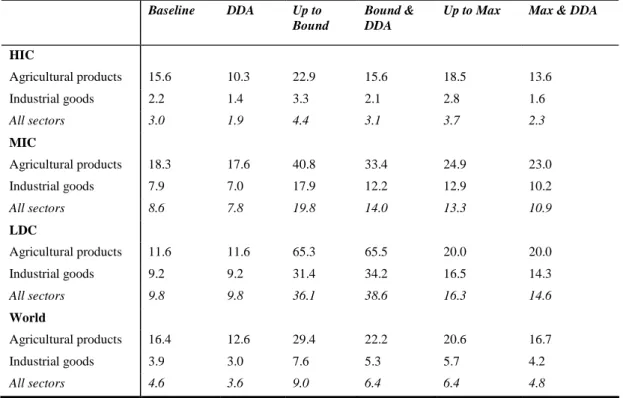
Table 4 displays how access to foreign markets is modified under the baseline and the various scenarios. It calculates the average duty faced when a group of countries (or the world) exports to the rest of the world, either in all sectors, or only in agriculture or in industry.
<TABLE 4 INCLUDED HERE>
In relative terms, the Doha scenario manages to deliver homogeneous market access gains with an average decrease of about 20 % in the tariffs faced by three groups of countries: from 4.6 % to 3.6 % for both HIC and MIC countries, and from 4.0 to 3.2 % for LDCs. The other scenarios, however, have significantly different results. Though the two protectionist scenarios have similar effects for HICs and MICs (97% and 93 % increases in protection respectively under the Up to Bound scenario, and 42% and 37 %, respectively under the Up to Max scenario), the LDCs are more severely affected due to losses of nonreciprocal preferences,24 in particular, in the US and Japan: protection faced by LDCs is nearly tripled. Consequently, the implementation of a DDA is of great interest for LDCs not only because it improves access to foreign markets even if it is at the price of an erosion of preferences, but also because it locks-in unilateral schemes and in particular the most recent initiatives. It will forbid the potential rise of
protection faced by their exports: based on the maximum protection faced during the 1995-2006 period,
24
protection faced by LDCs’ exports can raise from 4.0 % to 7.3 % if DDA is not implemented while it can increase up to only 4.7 % if DDA is applied.
4.2 Economic impacts
The MIRAGE CGE model is used to assess the economic impacts of these different tariff and domestic support scenarios up to 2025.
4.2.1 Economic impacts at the global level
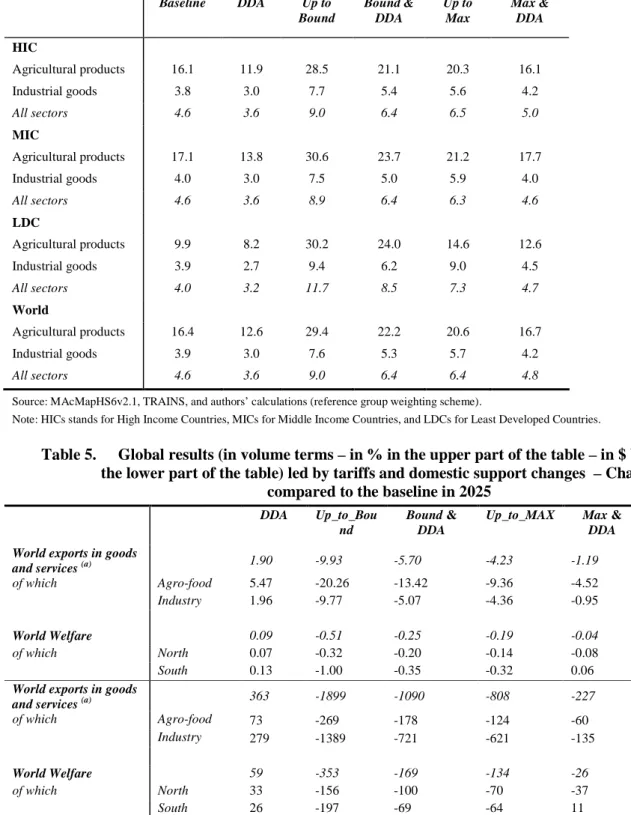
Table 5 indicates the global results of all scenarios for the world economy in 2025. Under the
Doha scenario considered here, world trade is augmented by a mere 1.9 % (US$363 billion) and world
real income by US$59 billion in 2025. This confirms the findings of other studies (see Decreux and Fontagné 2006, or Bouët et al., 2006), except that here the gains are slightly lower because the baseline includes numerous RTA that already reduce applied tariffs before the DDA implementation. However, these numbers are driven by the assumption that no major political shock will take place if the DDA is not signed. Such an assumption should be considered carefully.
<TABLE 5 INCLUDED HERE>
In case of the Up to Bound scenario, world trade would contract by 9.9 % (US$1,899 billion) and world real income by US$ 353bn. In the case of the less damaging Up to Max scenario, world trade would decline less, by 4.2 % (US$808 billion). While the latter increase in duties would especially impact agricultural exports (-9.4 %), particularly harming developing countries’ agricultural exports (-11.5 %), the exports of industrial goods could also face a substantial reduction of 4.4 %.
In case of an implementation of the December 2008 package and a subsequent augmentation of protection up to bound levels, the decrease of world exports would be only US$1,090 billion while it would be US$1,899 billion if the DDA is not applied. In other words, according to this assessment, the DDA implementation can prevent a potential reduction of US$809 billion of trade. If the rise in
protectionism is to the maximum protection applied during the 1996-2006 period, the DDA can prevent a potential reduction of US$581 billion of trade.
4.2.2 Economic impact at the country level
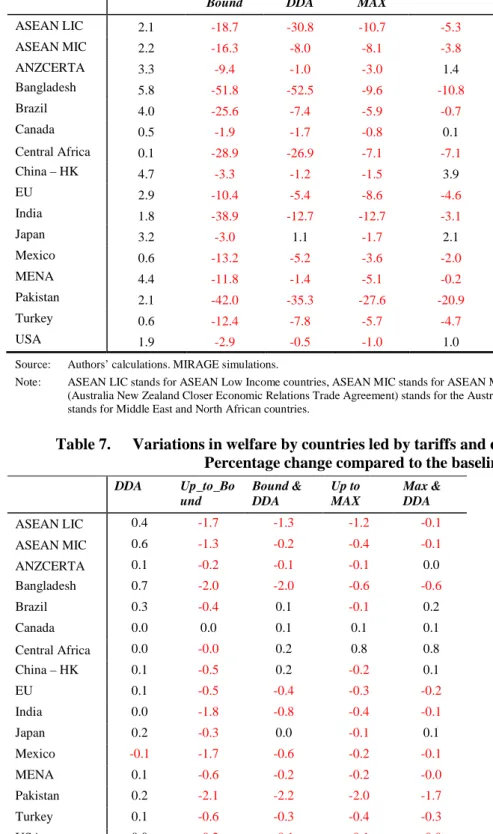
In this subsection we focus on the impact of various scenarios on countries’ macroeconomic variables. In order to simplify the presentation, we focus on seventeen countries/zones instead of twenty-seven.
Table 6 illustrates how various scenarios affect countries’ exports in value. The impact of the Doha agreement does not provide any surprising effect as compared to previous assessments. A look at the protectionist scenarios, without the DDA implemented, reveals how some countries could be greatly affected by a global resort to protectionism. Brazil, for example, is particularly affected by an
augmentation of protection: let us recall that the Up to Bound scenario implies an increase in world agricultural protection by 13 percentage points, while only 3.7 percentage points in industry (see Table 3). Brazil’s exports are especially reduced (-25.6 %) under the Up to Bound scenario. If the DDA is agreed on, Brazil would be hurt less by a potential rise of protectionism. Her exports would be reduced by only 7.4 % if bound duties were adopted after this agreement. The same mechanism is in play under the Up to
Max and Max&DDA scenarios, but the magnitude is smaller.
<TABLE 6 INCLUDED HERE>
Traditionally, assessments of the Doha agreement have found only small effects for the EU and the US. Our study leads to the same conclusion (for example the increase in EU exports in 2025 is only 2.9 %) but here we can also assess the benefit of the DDA by comparing the cooperative scenario (DDA) with the protectionist one (the Up to Bound scenario, for example, results in a 10.4 % decline of EU exports and 2.9 % decline of US exports), or by comparing how the trade agreement ameliorates the reduction in exports due to increased protection: the differences in export growth between Up to Bound and the Bound&DDA scenarios are 5 % for the EU, 2.4 % for the US. Table 6 illustrates that from this new vantage point, the DDA is far more important for these large economies.
While the DDA increases Bangladesh’s overall exports by 3.7% (in value terms), they decrease towards the European Union (erosion of preferences), but increase substantially towards the US (+10%), Japan (+514%) and Brazil (+33%). Concerning the protectionist scenarios, reductions in Bangladesh’s exports is mainly explained by the a substantial increase in protection applied on imports and the macroeconomic closure.
Table 7 records the welfare impacts of various scenarios. The Doha scenario implies gains for all regions except Mexico.25 This loss can be explained by an erosion of preferences towards the US and Canada in case of an agreed multilateral liberalization. In general under the DDA scenario welfare gains are small; they are least small for Brazil, Bangladesh and the ASEAN zones.
<TABLE 7 INCLUDED HERE>
A rise of protectionism would mainly hurt MICs and LDCs. As already pointed out, in case of the
Up to Bound scenario the relative loss of welfare is three times larger for developing countries than for
developed countries (see Table 5). Asian developing countries are particularly affected (see the case of Bangladesh, India and Pakistan on Table 7). The implementation of the DDA is important for these countries as a ‘preventive’ action against the risk of trade wars, in particular as far as India is concerned. We can also note a few cases where increasing protectionism is beneficial. For instance, Canada takes advantage of increased preferential margins into the NAFTA markets while limited increases of its own tariff improve its terms of trade (optimal tariff argument), and imply small domestic distortions.
As illustrated by the Canadian case, tariff changes implied by one’s own policy reform may have different even opposite effects on welfare from those implied by other countries’ policies. Decomposing the mechanisms that affect welfare is crucial to understand the results. In particular, assessing the strength of the “what I do is what I get” argument is important. Indeed, in a context of global trade policy changes, a country will be affected by both changes in its own tariffs (domestic policy effect) and in its partners’ tariffs (foreign policy effect). Due to intra-country reallocation of resources, imported inputs and model closure (fixed current account), it is difficult to distinguish “import-led effects” from “export-led effects”. Both domestic and foreign policy effects have negative and positive outcomes. As previously stated, the main effects are:26
a. for domestic tariff increase:
i. a positive effect on welfare related to the “optimal tariff” argumentation; ii. a negative effect on welfare led by increasing distortions in domestic economy; b. for a foreign tariff increase:
25 Nigeria and the Rest of Eastern Africa are also affected by a slight decrease in welfare.
26
Countries can also be affected by the tariffs of countries they do not trade with because these changes may affect world prices. This effect is taken into account in the ‘foreign tariff’ increase and is less important than other effects.
i. a positive effect for exporters benefiting from preferences on increasingly protected markets;
ii. a negative effect for exporters facing increased barriers. <FIGURE 4 INCLUDED HERE>
We use a new methodology to decompose consistently these welfare effects (Laborde, 2009) and we compute normalized relative effects of “domestic” and “foreign” reform. As is clear from Figure 4, in the case of Up to Max scenario, different countries are affected differently by these conflicting forces.
Several large countries (Canada, ASEAN, Brazil, India, EU27, etc.) can benefit from their own tariff increases as opposed to small countries for which a resort to high tariffs will be negative.
For most exporters, tariff increases in destination markets will have drastic negative effects and will dominate the welfare changes. This is particularly true for Asian countries (China and Japan for instance) that have no preferential access. But for a few countries benefiting from large preferential access (Canada and Mexico), the overall rise in protection at the global level still delivers positive effects: the increased value of existing preferences outweighs the loss of market access in third countries.
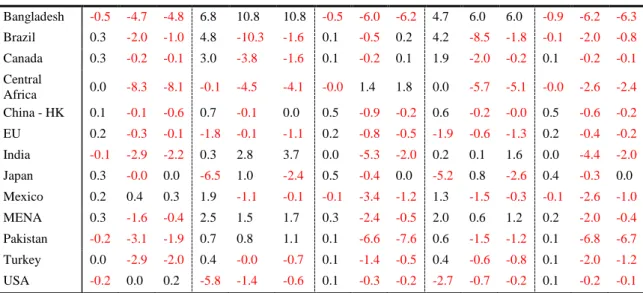
Finally, we examine how factors’ real remuneration is modified under three scenarios: Doha, Up
to Bound and the Bound&DDA scenario (see Table 8). The objective is only to illustrate how productive
factors are affected differently by a further liberalization of a country’s economy or a global resort to protectionism.
<TABLE 8 INCLUDED HERE>
In agricultural countries like Australia/New Zealand or Brazil productive factors related to agriculture (land, agricultural unskilled labor) should be clearly supportive of a Doha agreement and opposed to a global augmentation of protection up to bound levels. In Brazil for example, the real
remuneration of land and agricultural unskilled labor increases by 4.8 % and 4.2 % respectively if a Doha agreement is signed while they decline by 10.3 % and 8.5 % if the Up to Bound scenario is implemented. The DDA agreement also plays a valuable role for land and unskilled agricultural labor in these countries, since under the Bound&DDA scenario their remuneration declines but to a lesser extent (1.6 % and 1.8 %
in the case of Brazil). The same mechanism works in the Asian MICs and Central Africa. In these poor countries, the WTO Doha agreement is also a beneficial scheme for poor people.
On the other side, in rich countries like Japan, Korea, and the European Free Trade Area (EFTA) countries, land and agricultural unskilled labor should be supportive of increased protectionism and opposed to further liberalization27. In the case of the EU and the US, any reform leads to a decline of the real remuneration of these factors. Indeed, for the agricultural sector in both regions, the Doha round will have adverse effects (reduction in subsidies or protective tariffs), but a global resort to protectionism will also hurt their agricultural interests. In case of the Up to Bound and the Bound&DDA, the negative effects are smaller.
It is noteworthy that in rich countries (Australia/New Zealand, Canada, EU, Japan, and US), skilled labor and capital should generally support increased multilateral trade openness as it increases their real remuneration and oppose increased protectionism as it reduces their real remuneration. The variations of real remuneration implied by these trade policies are less than those concerning land and agricultural unskilled labor: this is explained by differences in the degree of inter-sectoral mobility. These results are consistent with the traditional Heckscher-Ohlin-Samuelson framework.
4.2.3 What is really at stake?
The results of these simulations allow a clear reassessment of what is really at stake. A
disagreement among WTO countries over the DDA would signal a failure of international cooperation. If countries subsequently implement protectionist policies, the reduction could be much greater. This exercise clearly gives an insight of what could be lost as a result of the failure of the DDA. A simple comparison reveals a potential reduction of US$1,171 billion in world trade. The failure of the DDA would not only prevent an increase of US$363 billion in world trade coming from new commitments on tariffs and domestic support, but a worldwide move toward protectionism would contract world trade by US$808 billion if we consider that the implementation of the highest duties applied during the 1995-2006 is the realistic scenario to which countries would resort. If an implementation of bound duties is the relevant reference point, a failed Doha Development Agenda could mean that the ‘potential cost’ of a trade war would be US$2,262 billion higher, in terms of the volume of international trade by 2025.
27
Moreover, the DDA will not only increase trade, but it will also reinforce binding commitments and reduce existing bound duties. In so doing, it will play its international public good role by making the trade environment more secure and decreasing the costs associated with potential trade wars. We
concretized this idea by comparing the application of bound duties based on their current levels to the same policy based on the level of bound duties implied by the DDA: in that case this difference is up to US$809 billion in terms of trade volume and US$184 billion in terms of real income.28
Strikingly, these conclusions are especially true for poor countries: in terms of real income, if we consider that the real value of the DDA is measured by the ‘preventive’ role that it plays, from a global value of US$ 184bn, $ 128billion (about two thirds) represent the benefits to developing countries (see Table 5). This explains why the DDA should be finally considered as a Development Round.
5
CONCLUSION
Recent studies assessing the potential impact of the DDA have concluded that there would be modest augmentation in world trade and world real income. This study, which is limited to tariffs and domestic support, does not invalidate such conclusions, but it examines the situation from a different perspective. The failure of a WTO agreement would be a clear sign of international noncooperation; it would launch trade conflicts and litigations (especially between high income and emerging Countries), and would be the first unsuccessful Round despite the fact that it is the first Round to focus on
development and the first Round launched by the WTO.
In a period of economic stagnation, the risk is high that this failure would give WTO members the incentive to pursue protectionist policies. In that case, international trade will face a dreadful iceberg: the visible opportunity cost of not concluding the DDA, US$ 363 billion of trade, will be outweighed by the immersed part, namely a potential reduction of at least US$ 1,171billion in world trade if countries fail to reach an agreement and were to implement protectionist policies. Therefore, the stakes in Geneva are very high and the December 2008 package and a WTO agreement is the best ‘preventive’ measure to avoid world trade colliding with the iceberg. Finally, the DDA appears to be the closest and most promising step toward a global development agenda for a world in turmoil.
28
REFERENCES
Anderson, K., Martin, W., and D., Van der Mensbrugghe, 2005, Market and Welfare Implications of Doha Reform Scenarios. In K. Anderson and W. Martin, eds., Trade Reform and the Doha
Agenda, Washington D.C.: World Bank.
Axelrod, R., 1981, The Evolution of Cooperation, Science, Vol 211, Issue 4489, 1390-1396.
Bairoch, P., 1995, Economics and World History: Myths and Paradoxes, University of Chicago Press Baldwin R.E., and S. Evenett, eds., 2008, What world leaders must do to halt the spread of
protectionism?, London, Center for Economic Policy Research, VoxEU.org.
Baldwin R.E., and S. Evenett, eds., 2009, Murky protectionism and the Crisis, London, Center for Economic Policy Research, VoxEU.org. ,
http://www.voxeu.org/reports/Murky_Protectionism.pdf
Berisha V., Bouët A., Laborde D. and S. Mevel, 2008 The Development Promise: Can the Doha
Development Agenda Deliver for Least Developed Countries?, IFPRI Briefing Note, July, IFPRI. Bouët A., Decreux, Y., Fontagné, L., Jean, S., and D. Laborde, 2008, Assessing Applied Protection across
the World, Review of International Economics, 16(5), 850-863.
Bouët A., 2008, The Expected Benefits from Trade Liberalization - Opening the Black box of Global
Trade Modeling, Washington DC, IFPRI Food Policy Review 8.
Bouët A., S. Mevel and D. Orden, 2006 More or less Ambition in the Doha Round: Winners and Losers from Trade Liberalization with a Development Perspective, The World Economy 30(8): 1253-1280.
Boumellassa H., D. Laborde, and C. Mitaritonna, 2009, “A consistent picture of the protection across the world in 2004: MAcMapHS6 version 2”. AgFoodTrade Working paper and IFPRI Discussion paper.
Decreux Y. and H. Valin, 2007, MIRAGE, Updated Version of the Model for Trade Policy Analysis: Focus on Agriculture and Dynamics, CEPII Working Paper, 15, October.
Decreux Y., and L. Fontagné, 2006, A Quantitative assessment of the Outcome of the Doha Development Agenda, CEPII Working Paper, 10, May.
Gamberoni, E and Newfarmer R., 2009, Trade protection: Incipient but worrisome trends. http://www.voxeu.org/index.php?q=node/3183
Hufbauer G.C., and J.J. Schott, 2009, Buy American: Bad for Jobs, Worse for Reputation, PIIE Policy Brief N. PB09-2, February, Washington DC, Peterson Institute for International Economics. INTAL, 2009, Recession and protectionism ‘within the rules’: Risks to the Multilateral trade system,
Irwin D.A., 1992, Multilateral and Bilateral Trade Policies in the World Trading System: an Historical Perspective in de J. de Melo and A. Panagarya, eds, New Dimension of Regional Integration, Center for Economic Policy Research.
Irwin D.A., 1998, The Smoot-Hawley Tariff: A Quantitative Assessment, Review of Economic and
Statistics, 80: 326-34.
Isaacs A., 1948, International trade -Tariffs and Commercial Policy, Richard Irwin, Chicago.
Jean S., Laborde D. and Martin W. , 2006. Consequences of Alternative Formulas for Agricultural Tariff Cuts, in K. Anderson and W. Martin, eds. Agricultural Trade Reform and the Doha Development
Agenda, The World Bank and Palgrave McMillan, 81-116.
Jean S., Laborde D. and Martin W., 2008, Choosing Sensitive Agricultural Products in Trade Negotiations, IFPRI Discussion Paper No. 788.
Johnson H.G., 1953, Optimum Tariff and Retaliation, The Review of Economic Studies, vol. 21: 142-153. Laborde, D., 2008, Mesures et détermination endogène des droits de douane, PhD thesis, Université de
Pau et des Pays de l'Adour.
Laborde, D., 2009, Decomposition of Multilateral Trade Policy shocks in a CGE, Mimeo.
Laborde, D., Martin, W. and D. van der Mensbrugghe, 2008, Implications of the 2008 Doha Draft Modalities for Developing Countries, GTAP conference paper.
Madsen, J.B., 2001, Trade Barriers and the Collapse of World Trade During the Great Depression,
Southern Economic Journal, 67(4), 848-868.
Martin W., and P. Messerlin, 2007, Why is it so difficult? Trade liberalization under the Doha Agenda,
Oxford Review of Economic Policy, 23(3):347-366.
Messerlin P., 1985, Les Politiques Commerciales et leurs Effets en Longue Periode, in B. Lassuderie-Duchene and J.-L. Reiffers, eds, Le Protectionnisme, Paris, Economica.
Narayanan, B.G., and T.L. Walmsley, eds., 2008, Global Trade, Assistance, and Production: The GTAP 7
Data Base, Center for Global Trade Analysis, Purdue University.
Olson, M., 1965. The Logic of Collective Action, Cambridge: Harvard University Press. WTO, 2008a, Fourth REVISION OF DRAFT Modalities for Non-Agricultural Market Access,
TN/MA/W/103/Rev.2, WTO Secretariat, Geneva.
WTO, 2008b, Revised Draft Modalities for Agriculture, TN/AG/W/4/Rev.3, WTO Secretariat, Geneva. WTO, 2009, Report to the TPRB from the Director-General on the Financial and Economic Crisis and
Appendix 1 – Geographic decomposition
<TABLE 9 INCLUDED HERE>
Appendix 2 – List of recent trade agreements included in the baseline
(i) Full free trade agreements (FTA) for ASEAN (Association of South East Asian Nations), CEMAC (Communauté Economique et Monétaire de l’Afrique Centrale for Monetary and Economic Community of Central Africa), COMESA (Common Market for Eastern and Southern Africa), and SADC (Southern Africa Development Community).
(ii) Economic Partnership Agreements (EPA) between ACP (Africa Caribbean Pacific) countries and the EU;
(iii) Implementation of the EU-India, EU-ASEAN, Colombia, Oman, Bahrain, US-Morocco, US-Australia, Mercosur-Colombia, and China-Chile FTAs.
(iv) All ongoing WTO accession commitments, including those of most recent members (Ukraine, Cape Verde, Viet Nam);
(v) Updated GSP (Generalized System of Preference) scheme of Japan in favor of LDC countries; (vi) Modified bound tariffs on EU poultry;
(vii) EU enlargement to Romania and Bulgaria in 2007;
(viii) The end of the EU EBA (Everything But Arms) transitory regime is implemented for protocol products (sugar, banana, and rice).
Appendix 3 – Modeling the OTDS constraint in a dynamic setting
As discussed in section 3.2.1, we introduce the OTDS capping in the dynamic model. Under the standard approach, domestic support is computed from base year level and converted in an ad valorem
equivalent.29 This approach is unrealistic as the WTO constraint plays in terms of overall support (in US$) and as taking into account the growth of production value in the agricultural sector will lead to a reduction in subsidy rate to respect the new WTO commitments.
29