Eight Years of Doha Trade Talks:
Where Do We Stand?
Antoine Bouët
Senior Research Fellow, International Food Policy Research Institute and Professor, Centre d’Analyse Théorique et de Traitement des Données Économiques/Université de Pau
David Laborde
Research Fellow, International Food Policy Research Institute
In 2001 the World Trade Organization launched a highly ambitious program of multilateral liberalization. Eight years later, concluding the negotiations is uncertain, though an opportunity still exists. Since 2001, many proposals on market access have been brought to the negotiating table by the European Union, the United States, and the G20. Because it is politically and economically acceptable to many parties, the final December 2008 package could be the basis of an agreement. An evaluation of these various proposals shows how trade negotiations have been following countries’ strategic interests. In eight years, the ambition of the formula in agricultural market access tariff reduction has increased, but additional flexibilities designed to accommodate domestic political constraints have offset delivered market access. The various scenarios imply losses for least-developed countries, reflecting eroded preferences and rising terms of trade for imported commodities, including food products. We study how this trade reform can be more development-friendly.
Keywords: computable general equilibrium modeling, least developed countries, trade negotiations
T h e E s t e y C e n t r e J o u r n a l o f
International Law
1. Introduction
We commit ourselves to comprehensive negotiations aimed at: substantial improvements in market access; reductions of, with a view to phasing out, all forms of export subsidies; and substantial reductions in trade-distorting domestic support. We agree that special and differential treatment for developing countries shall be an integral part of all elements of the negotiations ….
Declaration from the World Trade Organization Ministerial Conference in Doha, Qatar, November 14, 2001
hen this declaration was adopted eight years ago, there seemed to be a great deal of enthusiasm about this highly ambitious program. Today, the mood has changed, and while concluding the negotiations may still be an achievable goal, it is clouded with uncertainty.
The Doha Round of World Trade Organization negotiations was launched under a special political context: after the events of September 11, 2001, the international community felt a need for multilateral cooperation. Policymakers saw a world of free trade as the right answer to poverty, which feeds terrorism. At the time, U.S. President George W. Bush said, “By expanding trade, we spread hope and opportunity to the corners of the world, and we strike a blow against the terrorists who feed on anger and resentment.”
The establishment of a Development Round in Doha seemed to be the right political response following the failure of international cooperation during the 1999 Seattle WTO Ministerial Conference, where developing countries felt their priorities were not being taken into account by multilateral trade negotiations. However, the eight years of negotiations that have followed the establishment of the Doha Round have alternated between failures and successes. Although the Cancun Ministerial Conference in September 2003 was characterized by North–South disagreements that split the negotiators and resulted in developing countries rejecting a proposal co-drafted by the European Union and the United States, the Hong Kong Ministerial Conference in December 2005 brought some progress, such as the phasing out of export subsidies and the duty-free, quota-free market access regime provided by Organization for Economic Cooperation and Development (OECD) countries to least-developed countries (LDCs). But during a “mini-ministerial meeting" organized in Geneva in July 2008, the negotiations failed, in part due to a dispute between the United States and India on safeguard mechanisms in agriculture. Despite this failure,
WTO Director General Pascal Lamy said, “Looking at what is on the table now, members believe that the Doha Round is still worth fighting for.”
From the outset, the negotiations have been complicated. Cutting a deal among 143 countries (153 today) is a rather difficult task, since the world trading system is based on the combination of the multilateral WTO regime with numerous regional agreements and preferential schemes, the latter being eroded by any WTO deal. In addition, trade distortions are concentrated in the agricultural sector, and for a long time a handful of rich countries have resisted international pressure to liberalize this sector, a liberalization that would benefit net food-exporting countries.
But beyond this, world trade and the world economy have changed profoundly since 2001. WTO members such as Brazil, India, and the recently integrated China have emerged as major trading and economic powers. Their share in world merchandise exports jumped from 4.1 percent in 1993 to 7.7 percent in 2003 and to 11.5 percent in 2008, according to the WTO website. They are members of the G20 coalition, together with South Africa, which has become a major player in the WTO negotiations. Thus, the negotiations are no longer the reserved domain of the European Union and the United States. In addition, the recent financial and economic crisis has affected economic growth worldwide and especially in developing countries, which have been facing declining demand for their exports, decreasing financial flows, and reduced remittances. The crisis has also raised the fear of renewed protectionism and has highlighted the need to have a secure and stable trading environment. As well, the long-term volatility of world agricultural prices has increased since 2001, so that the international community is now much more concerned with potential imbalances of world agricultural markets. And finally, environmental issues are receiving higher priority. In particular, food supply and demand issues resulting from climate change can make international trade a necessity.
All these issues have raised expectations for international cooperation. However, the WTO is an international institution concerned with international trade; it does not have a mandate regarding development or the environment. It operates on several key principles, which have remained unchanged despite the changing trade and economic environment:
• Global agreement: WTO negotiations are based on a “take it or leave it” principle.
• Unanimity: the agreement must be accepted by all WTO members.
• Harmonization of trade distortions: the bigger the trade distortions, the more they have to be cut – especially tariffs and domestic subsidies; this
principle is applied via a tiered formula for agricultural tariffs and a Swiss formula in industry.1
• Special and differential treatment: the WTO fully recognizes the economic heterogeneity of its members. This means poor countries have smaller cut rates for tariffs and subsidies and longer implementation periods.
Since 2001, many proposals have been brought to the negotiating table. In 2003, two proposals – the Harbinson and Girard proposals – were submitted to the WTO members. The Harbinson proposal focused on agriculture and included a tiered formula that was supposed to reflect a potential consensus. The Girard proposal, on the other hand, focused on industry and included a “modified Swiss formula” under which tariffs were harmonized with a corrective parameter depending on the initial average (this formula was particularly favored by India, which had particularly high tariffs at that time).
Just before the Hong Kong Ministerial Conference in December 2005, the main negotiating parties submitted their own proposals, which had different versions of tiered formulae in agriculture concerning import tariffs and domestic subsidies and of the Swiss formula in industry with special and differential treatment. The United States made the most aggressive proposal. The G202 proposal included an ambitious
liberalization program for developed countries, with a more limited one for developing countries. The European Union proposal included a more protectionist aspect for developed countries while preserving the main objectives of the Harbinson proposal.
In eight years of negotiation, the various positions have evolved and converged, as represented by the December 2008 chairs’ proposals. Market access modalities have reached a high level of sophistication. The general philosophy is simple, with progressive tariff-cut formulas for both agricultural and nonagricultural goods. Much flexibility has been introduced, however, with different degrees of special and differential treatment and special provisions for tariff escalation, tropical products, and long-standing preferences. A duty-free, quota-free market access initiative for least-developed countries is to be provided by OECD countries, with a 3 percent exemption clause in terms of products. Export subsidies are to be phased out by 2013 for developed countries. Regarding domestic support, this package includes a harmonizing cut on overall trade-distorting support as well as sectoral disciplines.
2. A Methodology for Evaluating the Scenarios
These assessments are based on the use of the computable general equilibrium (CGE) model MIRAGE of the world economy and the MAcMAp-HS6 database on market access. This section provides a quick overview of these analytical instruments together with the design of the scenarios that will be studied in the following sections.
2.1 Modeling Tools: The MIRAGE Model and the
MAcMap-HS6 Database
The MIRAGE model is a multinational, multisector CGE model (see Bchir et al., 2002; Decreux and Valin, 2007). In this article, the MIRAGE model is used in its dynamic version, with a perfect competition hypothesis and without modeling foreign direct investment. Based on standard and robust assumptions, it should be noted that the model may underestimate the positive effects of trade reform, particularly when such reform drives new investments, technology improvements, or important trade or production diversification. Baseline and simulations are run until 2025. Compared to the standard version of MIRAGE, two differences are implemented:
i. Specific tariffs are modeled explicitly.
ii. The overall distorting support is explicitly modeled as a value constraint and not as an ad valorem equivalent, in order to take into account the dynamic role of the constraint. However, no monetary inflation is included. All values are expressed in 2004 dollars.
The first source of data is GTAP7 (see Narayanan and Walmsley, 2008 for a full documentation), which provides world macroeconomic accounts and trade flows for the year 2004. The market access data come from the MacMap-HS6 version 2.1 database (Boumelassa, Laborde and Mitaritonna, 2009), which measures protection in 2004 and covers nearly all regional agreements and trade preferences existing to this date. This base includes information on multilateral and bilateral applied tariffs and bound tariffs at the 6-digit level. If these tools have been widely used in numerous global or regional trade agreement assessments, specific modifications have been done for this study. The tariff data set has been updated so that the baseline reflects important trade policy changes, including expanded duty-free access for LDCs in Japan; phasing out of the implementation period for protocol products in the EU27 for the EBA (rice, sugar, bananas); EU enlargement to Romania and Bulgaria; WTO accession of recent members, e.g., Vietnam and Ukraine.
Second, the GTAP trade matrix has been adjusted to discriminate between “real” trade and “virtual” trade. The problem is particularly important for LDCs, since their limited economic size makes the results for these countries very sensitive to potential mistakes, in particular in the case of potential exports that are blocked by prohibitive tariffs in importing countries. As a consequence, the trade matrix of the GTAP database allows for the possibility of trade creation by using constructed trade values instead of zeroes. For example, the trade matrix of the GTAP database includes “virtual” merchandise trade flows related to travel expenditures: rather than being treated as an export of services, the expenses of, for example, a Japanese tourist in Cambodia are translated in the database as a dutiable export of the consumed goods from Cambodia to Japan. But these “virtual” trade flows can be problematic in our assessment when non-negligible exports from an LDC to an OECD country are created after removal of a high tariff on a specific commodity. For instance, the GTAP database displays an export of processed rice of about $100,000 by Senegal to Japan facing a 340 percent tariff. Based on the model parameters (Armington elasticities for imperfect substitutes), the elimination of the duty can lead to a 15-fold increase in Senegalese exports of rice to Japan. Unfortunately, this flow is purely artificial.
To address this problem, we split the GTAP trade matrix into two categories: real trade flows, based on the trade data inputs to the GTAP database by Mark Gehlhar,3 and virtual ones. Tariffs, and their elimination, will affect only the former category. In addition, we have checked the quality of the input-output tables for key products in the LDC countries we focus on in order to avoid significant mistakes due to data quality problems. For instance, the GTAP7 database shows that 15 percent of the production cost of processed rice in Senegal is due to imported wheat and 0 percent to the local paddy rice. This mistake in the construction of the input-output table may also lead to serious limitations in the CGE assessment, since it implies that Senegal can export rice without producing it and simply by importing wheat. We fix such issues by reallocating the intermediate consumption to the appropriate sector in the input-output table.
The geographic decomposition is a key element of the methodological design of the study. On the basis of the GTAP7 database, we selected 29 countries or regions with specific trade objectives or holding specific positions in the negotiations. The sector decomposition focuses on agriculture and identifies 34 sectors, 15 of which are agricultural.4
2.2 Scenarios
In order to develop a better understanding of how the negotiations have evolved and to assess if they have converged toward a particular position, it is important to
evaluate five negotiating proposals: (1) a combination of the Harbinson proposal in agriculture and the Girard proposal in industry (called the Harbinson & Girard scenario), both submitted in 2003; (2) the G20 proposal (called the G20 scenario) submitted in 2005 at the Hong Kong Ministerial; (3) the proposal submitted by the European Union in 2005 at the Hong Kong Ministerial (called the EU scenario); (4) the U.S. proposal at the time of the Hong Kong Ministerial, 2005, (called the U.S. scenario); and finally (5) the December 2008 package (called the 2008 scenario).
Tariff reductions are applied at the 6-digit level of the harmonized system on a country-by-country basis using the MAcMap-HS6 version 2 database. We explicitly take into account differences between bound, applied Most-Favoured Nation (MFN), and preferential tariffs. Ad valorem equivalents of specific tariffs are computed based on the WTO guidelines for the implementation of tariff-cut formulas. All sensitive and special products are selected using the Jean, Laborde, and Martin political economy criterion.5
The first scenario (Harbinson & Girard) is based on 2003 proposals from the WTO chairs: the Harbinson proposal for agricultural market access (TN/AG/W/1, WTO 2003) and the Girard proposal (TN/MA/W/35, WTO 2003) for nonagricultural market access. The agricultural market access tariff reduction includes a tiered formula with three bands for developed countries and four for developing countries. Inside each band, flexibility is allowed: for each tariff line, negotiators can choose the cut rate under two constraints – a minimal cut rate specific to each band, and the simple average cut over all products for each band. We use the Jean, Laborde, and Martin (2008) criterion to define the optimal behaviour of each country inside each band. We also assume 10 percent of “special” products for developing countries for which the cut rate is limited to 5 percent. The nonagricultural market access proposal (which supposedly reflects the Girard proposal) is based on a Swiss-like formula where the “Swiss coefficient” is equal to the simple average base rate times a scale coefficient (equal to 1 for developed economies and 1.5 for developing countries). For unbound lines, the base rate is equal to the Most-Favoured Nation rate times 2, with a minimum of 5 percent. Countries that have a binding coverage below 35 percent do not reduce their tariffs.
The second scenario is the G20 proposal. For agricultural market access, we rely on the G20 proposal on market access of October 2005. This includes a tiered formula (four bands for both developed and developing countries) with differentiated thresholds and coefficients and a capping for highest tariffs (100 percent for developed economies, 150 percent for developing economies). We allow for 4 percent of sensitive products for developed countries (6 percent for developing countries) with
a 30 percent deviation from the formula cut (45 percent deviation for developing countries). We also include 5 percent of special products for developing countries with no cut. The nonagricultural market access component is based on the Argentina, Brazil, and India communication (TN/MA/W/54, WTO 2005). It is similar to the Girard formula but includes a differentiated formula for bound and unbound lines. We assume the same scale coefficients as in the Harbinson & Girard scenario as well as the binding mark-up to compute the base rate on unbound lines. In addition, we consider 5 percent of tariff lines (max. 5 percent of imports) with no cut.
The third scenario represents the European Union’s contribution of October 2005. Agricultural market access is described by a tiered formula (four bands) similar to the G20 proposal, but with lower reduction targets for developed countries. In addition, the lower band (0-30 percent) allows flexibility by defining a simple average cut target and lower and upper bound tariff reductions. Here also we use the Jean, Laborde, and Martin (2008) criterion to define each country’s optimal behaviour inside the first band. Eight percent of sensitive products (50 percent deviation from the formula) are authorized for developed countries (one-third additional sensitive products are allowed for developing countries). For nonagricultural market access, we use a Swiss formula with coefficient 10 for developed economies and 15 for developing countries. The base rate of unbound tariff lines is equal to the applied Most-Favoured Nation rate plus 10 percent. A clause of 5 percent of sensitive products (maximum 5 percent of imports) with no cut is implemented. A 100 percent duty-free, quota-free initiative is granted by developed countries to least-developed countries.
The fourth scenario is the U.S. proposal. It includes stronger tariff reductions in agriculture with the same formula approach as the G20 (scenario 2) and smaller tariff caps (for example, 75 percent for developed countries). Only 1 percent of sensitive products are authorized for developed countries (1.33 percent for developing countries). We apply the same discipline in nonagricultural market access as in the EU proposal (scenario 3).
The three abovementioned scenarios are based on pre–Hong Kong 2005 Ministerial Meeting proposals, and they are completed by elements coming from the 2004 July Package when needed.
The fifth scenario is based on the December 2008 modalities (scenario 2008). An extensive discussion of this scenario is available in Laborde, Martin, and van der Mensbrugghe (2009). The agricultural market access pillar (WTO TN/AG/W/4/Rev.4) includes a tiered formula with four bands and differentiated coefficients for developed and developing countries. We take into account provisions for sensitive and special products as well as the additional cuts delivering special access for tropical products
and reducing tariff escalation. For the nonagricultural market access pillar (WTO TN/MA/W/103/Rev.3), we apply a Swiss formula, with coefficient 8 for developed countries and a menu of options including sensitive products combined, to a Swiss formula with coefficients ranging from 20 to 25. We consider the special cases of the recently acceded members, the small and vulnerable economies, and the low–binding coverage countries. A 97 percent duty-free, quota-free initiative is included for OECD countries, as well as for Brazil and India to some extent.
In all cases, least-developed countries are free from any tariff reduction, as well as low–binding coverage countries in nonagricultural market access. We also always implement the consequences of the EU-Turkey Customs Union for nonagricultural market access for the latter countries. All export subsidies are removed in all scenarios.
We use a tiered formula to reduce overall trade-distorting support (OTDS) (in scenario 5) or the total aggregate measurement of support (AMS) (in scenarios 1 to 4). To sum up: in scenario 1, all countries belong to the same band and the reduction rate is 50 percent. For other scenarios, the EU is in the last band and the reduction rate applied to its support is 80 percent under the G20 proposal and 2008 modalities, 70 percent under the EU proposal, and 83 percent under the U.S. proposal. For the United States (second band), the cut rate is 70 percent under the G20 proposal and 2008 modalities, and 60 percent under the EU and U.S. proposals.
Domestic support reductions are applied in a dynamic way as already described in Bouët and Laborde (2009b) with an additional assumption of a 2 percent annual inflation rate. We introduce the OTDS-capping in the dynamic model. Under the standard approach, domestic support is computed from base-year level and converted to an ad valorem equivalent.6 This approach is unrealistic: the WTO package defines a limitation that is constraining in terms of overall support (in US$). Taking into account the growth of production value in the agricultural sector will lead to a reduction in subsidy rates to respect the new WTO commitments. Focusing on agricultural production and exports, we see the following:
i. U.S. agricultural production is directly affected by domestic support reduction (-1.5 percent in agricultural and agri-business production instead of +0.1 percent).
ii. EU agricultural production is nearly unaffected by subsidy reduction thanks to the recent CAP reform and the large share of green-box payments in overall EU domestic support.
iii. By contrast, the OTDS limits applied to U.S. farmers will benefit EU producers and exporters. Overall, EU production is reduced less with the DDA tariff reduction combined with the OTDS treatment than when it is not combined with the OTDS treatment (-1.17 percent versus -1.27 percent).
iv. The situation of Brazil is magnified compared to the EU situation. In this case, Brazilian production increases more with the OTDS treatment (+4.03 percent versus +3.78 percent).
3. A Quan titative Assessment of the Evolution of the
Negotiations Modalities on Protectio n, Trade, and Welfare This section discusses the evaluations of these scenarios, first in terms of impact on protection applied and faced by each group of countries, and second in terms of trade and real income. The next section will focus on the potential impact of these trade reforms on LDCs.
3.1 The Impact on Applied Protection
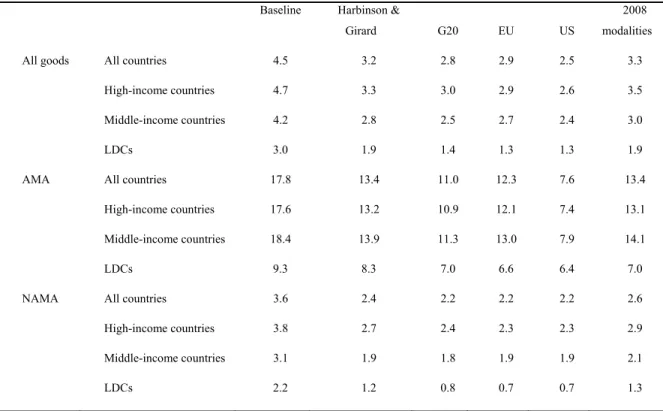
Table 1 shows the impact of these different proposals on protection according to the categories “all goods”, agricultural market access (“AMA”), and nonagricultural market access (“NAMA”). The latest modalities scenario (2008 modalities) would reduce world protection by 26 percent, from 4.5 percent to 3.3 percent. By comparison, the U.S. proposal would have cut this world average by 50 percent, while the European proposal would have implied a reduction of only 37 percent.
Table 1 Impact of Five Liberalization Proposals on Applied Protection
Baseline Harbinson
& Girard G20 EU US
2008 modalities
All goods All countries 4.5 3.2 2.8 2.9 2.3 3.3
High-income countries 3.3 1.8 1.5 2.0 1.5 2.1 Middle-income countries 8.6 7.5 7.2 5.7 4.8 7.5 LDCs 12.2 12.2 12.2 12.2 12.2 12.2
AMA All countries 17.8 13.4 11.0 12.3 7.6 13.4
High-income countries 17.6 11.9 8.7 10.9 5.2 11.6 Middle-income countries 18.7 17.7 17.5 16.5 14.0 18.2 LDCs 13.6 13.6 13.6 13.6 13.6 13.6
NAMA All countries 3.6 2.4 2.2 2.2 2.2 2.6
High-income countries 2.3 1.1 1.0 1.4 1.4 1.4 Middle-income countries 7.7 6.6 6.3 4.8 4.8 6.6 LDCs 12.0 12.0 12.0 12.0 12.0 12.0
Given numerous flexibilities, world agricultural protection would decrease by 25 percent (that is to say, by less than protection in industry) if the December 2008 package were to be implemented, while it would decrease by 73 percent under the U.S. proposal. Concerning agricultural market access, the latest modalities scenario would cut applied protection by a little more than one-third for high-income countries (from 17.6 percent to 11.6 percent) and by less than 3 percent for middle-income countries (from 18.7 percent to 18.2 percent). This should boost developing-country exports to developed countries.
Table 2 illustrates to what extent foreign market access would improve under each scenario. The latest modalities scenario would improve market access for high-income countries by 25 percent, for middle-income countries by 29 percent, and for least-developed countries by 37 percent. In agriculture, the gains would be equivalent for the three groups of countries: around 25 percent.
Table 2 Impact of Five Liberalization Proposals on Protection Faced by Exports Baseline Harbinson &
Girard G20 EU US
2008 modalities
All goods All countries 4.5 3.2 2.8 2.9 2.5 3.3
High-income countries 4.7 3.3 3.0 2.9 2.6 3.5
Middle-income countries 4.2 2.8 2.5 2.7 2.4 3.0
LDCs 3.0 1.9 1.4 1.3 1.3 1.9
AMA All countries 17.8 13.4 11.0 12.3 7.6 13.4
High-income countries 17.6 13.2 10.9 12.1 7.4 13.1
Middle-income countries 18.4 13.9 11.3 13.0 7.9 14.1
LDCs 9.3 8.3 7.0 6.6 6.4 7.0
NAMA All countries 3.6 2.4 2.2 2.2 2.2 2.6
High-income countries 3.8 2.7 2.4 2.3 2.3 2.9
Middle-income countries 3.1 1.9 1.8 1.9 1.9 2.1
LDCs 2.2 1.2 0.8 0.7 0.7 1.3
Source: Authors’ calculations based on MAcMap-HS6 v2.1.
Therefore, under the Doha Development Agenda, least-developed countries would improve their access to foreign markets but would also suffer an erosion of preferences, especially in agriculture; the protection faced by their agricultural exports would decline by 2.3 percentage points, while it would fall by 4.5 percentage points for high-income countries and 4.3 percentage points for middle-income countries.
Table 3 indicates the potential impact of various scenarios on the volume of exports and real income by groups of countries. We also evaluate the potential impact of a full liberalization, with complete removal of all import duties, export subsidies, and domestic support, as a point of reference.
Table 3 Impact of Six Liberalization Proposals on Trade and Real Welfare by 2025
liberalization Full Harbinson & Girard G20 EU US 2008 World exports of goods
and services US$ Billions 1,934 400 502 527 621 326
Variation
(%) 11.6 2.4 3 3.2 3.7 2
World exports of agriculture and
agri-food products US$ Billions 409 47 92 60 152 45
Variation
(%) 49 5.6 11 7.2 18.1 5.4
World exports of
manufactured goods US$ Billions 1,517 350 405 465 466 276
Variation (%) 11.6 2.7 3.1 3.6 3.6 2.1
Real income US$ Billions 384 66 134 126 190 69
Variation (%) 0.49 0.08 0.17 0.16 0.24 0.09 High-income countries (%) 0.51 0.08 0.17 0.19 0.25 0.09 Middle-income countries (%) 0.43 0.1 0.17 0.09 0.22 0.09 Least-developed countries (%) -0.67 -0.32 0.29 - 0.01 -0.27 - -0.1 Standard Deviation of the real income gains 0.98 0.29 0.45 0.35 0.51 0.22
Source: Authors’ calculations – MIRAGE model simulations.
World real income would improve by a mere 0.09 percent – about US$70 billion as annual gain in 2025 – under the latest modalities scenario (2008 column) and by 0.24 percent under the U.S. scenario. Overall, global exports would increase by 2 percent. This reflects the modest but positive ambition of the current market access modalities. Interestingly, the welfare outcome is close to the 2003 starting point. Although the
current tiered formula in agriculture is more aggressive than the Harbinson proposal, the additional flexibilities granted more than compensate for the stringent coefficients (agricultural exports increase by 5.4 percent compared to 5.6 percent in the Harbinson & Girard case). This illustrates the dilemma of the negotiations: trying to reach a high degree of ambition with a challenging formula, but still undermining it with flexibilities to make it politically acceptable.
Taking into account that our modeling assumptions are conservative and do not take into account some non-tariff barriers, liberalization in services, and some dynamic aspects of trade liberalization, these gains are at least positive for a majority of countries and equal about 20 percent of the gains from total trade liberalization, plus they lay the groundwork for future liberalization by reducing the existing binding overhang. A much more politically challenging approach based on the U.S. proposal would lead to gains equaling half of what would result from full trade liberalization.
These results illustrate how far trade negotiations have evolved, constrained by defensive interests. For example, in terms of applied protection, the implementation of the December 2008 package would decrease agricultural protection in rich countries by about as much as the Harbinson & Girard scenario would, and even less than the 2005 European proposal would. The application of the U.S. proposal in this domain would result in a much more ambitious liberalization of world agriculture. Regarding nonagricultural market access, a Doha agreement defined by these modalities would result in the liberalization of the economies of middle-income countries by about as much as was expected under the Harbinson & Girard and the G20 scenarios, while the application of the 2005 European proposal would have liberalized these sectors much more. Again, defensive interests are respected. This selection of the smaller common denominator is translated into the trade changes: the highest increases in nonagricultural exports (EU and U.S. proposals, about 3.6 percent) and in agricultural trade (U.S. and G20 proposals, between 11 and 19 percent) are avoided, and smaller increases are achieved (2.1 percent for manufactured goods and 5.4 percent for agriculture and the agri-food sector).
More importantly, different scenarios imply losses for least-developed countries, reflecting eroded preferences as a result of a multilateral agreement and rising terms of trade for imported commodities, including food products. While these losses are significant in the case of the Harbinson & Girard, G20, and U.S. proposals, they are almost non-existent as far as the EU proposal is concerned while being quite small under the December 2008 proposal. It is important to remember that the last two scenarios include a duty-free, quota-free initiative given by OECD countries to least-developed countries, while the other scenarios do not.
Finally, by reducing the losses of the weakest economies but also limiting the gains of the main winners, the long negotiation process has reduced the unevenness of the gains (see the simple standard deviation in the last row of table 3).
4. Least-developed Countries: What is on the Plate?
A successful “development” round will not be achieved if the interests of the most vulnerable members of the multilateral trading system (the LDCs) are neglected. Since they have the round for free – they will not deliver new liberalization on their markets – WTO-driven domestic reform will not lead to economic gains as it will in other countries. Therefore, such gains should come from other sources. This section is devoted to discussing what is on the table for the LDCs and how the final negotiations may lead to a more LDC-friendly outcome.4.1 Meagre Gains for Least-developed Countries
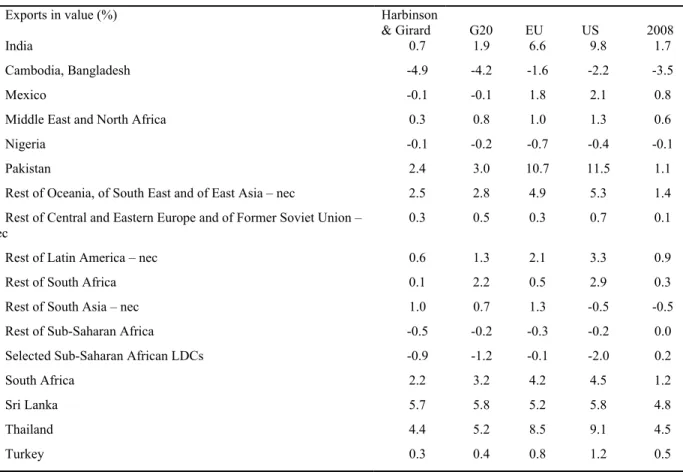
Obviously, gains for LDCs are potentially zero and could even be negative under our conservative modeling assumptions. Table 4 presents the potential impact of these five trade reform scenarios on developing countries’ exports in 2025.
In terms of potential impact of these trade reforms on exports, unlike some middle-income countries that can substantially benefit from new access to foreign markets, like Sri Lanka and Thailand, LDCs do not increase their exports substantially (African LDCs). In fact, their exports may even be negatively affected: in 2025 the exports of Cambodia and Bangladesh would be 3.5 percent lower if the 2008 modalities were to be implemented. And it could be worse, as all other scenarios imply exports decrease for LDCs in 2025. Obviously, the inclusion of a duty-free, quota-free clause for LDCs in their exports to OECD countries (also implemented in the EU scenario) can be a compensation for their eroded preferences.
In light of these results, more is needed to address the concerns of LDCs.Even if we consider that this modeling exercise underestimates the impact of a Doha agreement on least-developed countries, potential gains are small.
Duty-free, quota-free market access given by OECD countries to least-developed countries could boost the benefits from trade liberalization for the poorest WTO members. But this access has to be redesigned with no product exemption and must include a larger number of granting countries, in particular dynamic, emerging economies: Brazil, China, and India. It is also worthwhile to consider that small and vulnerable countries may receive this new preference as a compensation for traditional preferences eroded by the potential agreement.
Table 4 Impact of Five Liberalization Proposals on Developing Countries’ Exports by 2025
Exports in value (%) Harbinson
& Girard G20 EU US 2008
India 0.7 1.9 6.6 9.8 1.7
Cambodia, Bangladesh -4.9 -4.2 -1.6 -2.2 -3.5
Mexico -0.1 -0.1 1.8 2.1 0.8
Middle East and North Africa 0.3 0.8 1.0 1.3 0.6
Nigeria -0.1 -0.2 -0.7 -0.4 -0.1
Pakistan 2.4 3.0 10.7 11.5 1.1
Rest of Oceania, of South East and of East Asia – nec 2.5 2.8 4.9 5.3 1.4
Rest of Central and Eastern Europe and of Former Soviet Union – nec
0.3 0.5 0.3 0.7 0.1
Rest of Latin America – nec 0.6 1.3 2.1 3.3 0.9
Rest of South Africa 0.1 2.2 0.5 2.9 0.3
Rest of South Asia – nec 1.0 0.7 1.3 -0.5 -0.5
Rest of Sub-Saharan Africa -0.5 -0.2 -0.3 -0.2 0.0
Selected Sub-Saharan African LDCs -0.9 -1.2 -0.1 -2.0 0.2
South Africa 2.2 3.2 4.2 4.5 1.2
Sri Lanka 5.7 5.8 5.2 5.8 4.8
Thailand 4.4 5.2 8.5 9.1 4.5
Turkey 0.3 0.4 0.8 1.2 0.5
Note: nec denotes not elsewhere classified.
Source: Authors’ calculations – MIRAGE model simulations.
In a recent paper, Bouët et al. (2010) examine the potential benefits and costs of providing duty-free, quota-free (DFQF) market access to the least-developed countries and the effects of extending eligibility to other small and poor countries. Their analysis confirms the result from previous research (Berisha et al., 2008) that 97 percent market access provides very few benefits for LDCs. But the evidence does not support two of the chief concerns about expanded preferential access for those countries. First, sub-Saharan Africa overall stands to gain, not lose, if OECD countries, including the United States, provide 100 percent DFQF market access for all LDCs; and other developing countries, such as Pakistan, do not suffer from preference erosion. Second, preference-giving countries do not suffer market disruption from removing exclusions for sensitive products, such as sugar or dairy. Consequently the reform seems politically acceptable. The adjustments are greater, however, if DFQF market access is extended to a broader group of small and poor countries.
“Aid for trade” is also a major component of the agreement. While some observers describe this initiative as financial compensation for countries that are expected to suffer losses under the agreement (see Bouët and Laborde, 2010a) – how negative outcomes for LDCs could be addressed a bit further by aid for trade is a key topic and could be the purpose of a specific evaluation7 – it represents further assistance for developing countries “to increase their capacity to take advantage of more open markets”8 by investing in trade-related infrastructure such as transportation and telecommunication, the impact of which has been proven positive on export performance.
In other words, a Doha agreement based on the most recent modalities package would have an ambivalent impact on developing countries and would not offer enough to the poorest countries. It has to offer more in terms of market access and reduced trade costs. International cooperation also needs to be extended further, to other challenging areas, for least-developed countries.
4.2 Food Crisis Could Threaten the Gains from Trade
Liberalization for Least-developed Countries
Since the end of the food crisis, the role that international trade can play in food security has generated a great deal of debate. Food security implies availability of food products on domestic markets at an affordable price for local consumers. This concept strongly differs from the notion of self-sufficiency. Trade has always been used to compensate for a mismatch between supply and demand among countries. It helps to increase local supply in food-exporting countries, reduce the domestic price for importing countries, and reduce volatility, especially in the case of asymmetric supply shocks.
Multilateral agricultural trade liberalization leads to an increase in world agricultural prices due to increased demand, driven by tariff reductions, and supply reductions in some countries (due to constraints on subsidies). It has mixed effects on LDCs. Agricultural exporters benefit directly from this trend. For net food importers, the terms-of-trade cost may be significant, and if no unilateral tariff reduction is implemented, domestic prices go up, increasing the cost of food products for households. At the same time, due to less distorted markets, increased disciplines, and the long-term nature of this upward trend, farmers in LDCs may have more opportunities to invest and productivity gains can be expected. Agricultural production may expand, and in this case local consumers would benefit from a larger, more affordable source of food.
However, greater international cooperation is needed to eliminate national policies that can substantially increase world agricultural prices. For example, the role of
biofuel policies in the food crisis has been discussed; biofuel production obviously implies more demand for agricultural commodities and has been driven by questionable subsidies and tax rebate policies.
Export taxes and export restrictions that are not regulated by the WTO provide another example. They are attractive policy instruments for policymakers, especially in the case of rising international agricultural prices; they imply a reduction in domestic agricultural prices – which benefits local consumers – and an increase in the international prices of goods that the country exports, as well as new public revenues. But they are typically “beggar-thy-neighbor” policies that contribute to further increases in world agricultural prices (Bouet and Laborde, 2010b).
The WTO has to tackle these issues by bringing under its regulatory umbrella policies that deeply hurt international trade and small net–food importing countries. Otherwise, importing countries will resort to protectionist tools (such as special products and special safeguard mechanisms) to avoid depending on foreign, and sometimes unreliable, suppliers for achieving food security targets.
4.3 Economic Crisis Could Threaten the Gains from Trade
Liberalization for Least-developed Countries
The recent economic crisis has clearly illustrated how much developing countries are dependent on the economic growth of rich countries. With falling economic activity, rich countries’ imports have dropped drastically, translating into lower exports and economic activity for developing countries. This result is highly dependent on the current shape of trade flows and the fact that developing economies still face high barriers on developing markets, and these barriers impede South-South trade.
The Doha Development Agenda will partially address this issue. Using our CGE model, we simulate a 7 percent reduction in the gross domestic product of OECD countries during the period 2023-2025, with and without an agreement on the Doha Development Agenda. Without the WTO deal, middle-income countries will suffer a reduction in their real income of 0.2 percent, whereas with the agreement, this loss is cut in half. On the other hand, the loss increases slightly, from 0.4 to 0.5 percent, for least-developed countries. This is due to the fact that the duty-free, quota-free initiative granted by OECD countries only to least-developed countries will reinforce their dependence on these markets. Therefore, it is very important that the initiative include as many emerging economies as possible to help diversify the exports of least-developed countries.
However, South-South trade improvements will be limited in a Doha agreement due to generous flexibilities for developing countries and will not lead to a significant reorientation of developing countries’ exports. The right complement could be to
reduce flexibilities that affect South-South trade, expand regional agreements among developing countries, and increase investment in trade-related infrastructure adapted to this type of trade.
4.4 Renewed Protectionism Could Threaten the Gains from
Trade Liberalization for Least-developed Countries
The economic crisis has multiplied fears of renewed protectionism. A very positive impact of the Doha Development Agenda would be that it would reinforce binding commitments and reduce existing bound duties and would also consolidate the unilateral preferences granted to least-developed countries into the multilateral framework. By so doing, it would play its international public-good role by making the trade environment more secure and decreasing the costs associated with potential trade wars.
In a recent study, Bouët and Laborde (2009) examined this idea by comparing the application of bound duties based on their current levels, as they have been negotiated by the Uruguay Round, to the same policy based on the level of bound duties implied by the most recent Doha Development Agenda modalities. If the Doha Development Agenda were not implemented, current protection would double when countries resort to bound levels, whereas protection would increase by only 41 percent if the Doha Development Agenda were to be implemented. This difference is worth up to US$809 billion in terms of trade volume and US$184 billion in terms of real income (in 2025).
Strikingly, these conclusions are especially true for poor countries. In terms of real income, if one considers that the real value of the Doha Development Agenda is measured by the “preventive” role that it plays, from a global value of US$184 billion, US$128 billion (about two-thirds) represents the benefits to developing countries.
5. Conclusion
In conclusion, although the Doha Development Agenda may be considered an agreement that would be constrained too much by defensive protectionist interests, it still would achieve significant liberalization. Indeed, by cutting applied tariffs by more than one-fourth on average among the 153 WTO members, it may deliver more effective market access relative gains than previous negotiation rounds. This is particularly true for liberalization of agricultural trade, where the binding process and simultaneous dirty tariffication have limited the applied tariff reductions during implementation of the terms of the previous round: Ingco (1996) demonstrated that while there was significant and important reform during the Uruguay Round, in particular the conversion of non-tariff barriers into tariffs and the binding of tariffs, liberalization of trade has probably been limited. In addition, some of the gains the
Doha Development Agenda could provide would be indirect, through the reduction in binding overhang.
Therefore, concluding the round quickly will help to grasp the gains within reach. As noted by Hoekman, Martin, and Mattoo (2009), there are other gains at stake, such as environmental benefits driven by disciplines on the use of subsidies that encourage over-fishing and by decreasing import duties on environment-friendly technologies; examples of other potential gains at stake would be benefits from trade facilitation or from aid for trade.
We have shown that eight years of negotiations have managed to achieve a more even outcome, respecting countries’ strategic interests, but have not managed to advance further than the ambition of the 2003 proposals. At the same time, the gains that would be provided to least-developed countries from an agreement based on the latest modalities would be insubstantial, if not nil or negative. These benefits could be improved with a new effort on the part of rich and emerging countries in terms of improved market access and/or other transaction costs. It would make the Doha Round a real development round.
References
Bchir, H., Y. Decreux, J.-L. Guerin, and S. Jean. 2002. MIRAGE, a Computable General Equilibrium Model for Trade Policy Analysis. CEPII Working Paper 2002-17.
Berisha V., A. Bouët., D. Laborde, and S. Mevel. 2008. The development promise: Can the Doha Development Agenda deliver for least-developed countries? IFPRI Note 14. Washington D.C.: International Food Policy Research Institute.
Bouët, A., and D. Laborde. 2009. Assessing the Potential Cost of a Failed Doha. World Trade Review, 9, 319-351.
Bouët, A., and D. Laborde. 2010a. Why is the Doha Development Agenda Failing? And What Can be Done?: A Computable General Equilibrium-Game Theoretical Approach. The World Economy, forthcoming.
Bouët A., and D. Laborde. 2010b. The Economics of Export Taxation: A Theoretical and CGE contribution. IFPRI Discussion Paper. Washington DC: International Food Policy Research Institute, forthcoming.
Bouët A., E. Dienesch, K. Elliott, and D. Laborde. 2010. The Costs and Benefits of Duty-free, Quota-free Market Access for Poor Countries: Who and What Matters? Center for Global Development Working Paper. Washington D.C.: Center for Global Development, forthcoming.
Boumellassa, H., D. Laborde, and C. Mitaritonna. 2009. A Consistent Picture of the Protection across the World in 2004: MAcMapHS6 version 2. IFPRI Discussion Paper No. 903. Washington D.C.: International Food Policy Research Institute. Decreux, Y. and H. Valin. 2007. MIRAGE, Updated Version of the Model for Trade
Policy Analysis: Focus on Agriculture and Dynamics. CEPII Working Paper 15, October.
Hoekman, B., W. Martin, and A. Mattoo. 2009. Conclude Doha. It Matters! Inter-American Development Bank Policy Research Working Paper 5135.
Ingco, M. 1996. Tariffication in the Uruguay Round: How much liberalisation? The World Economy 19(4): 387–483.
Jean, S., D. Laborde, and W. Martin. 2008. Choosing Sensitive Agricultural Products in Trade Negotiations. IFPRI Discussion Paper No. 788.
Laborde, D., W. Martin, and D. van der Mensbrugghe. 2009. Implications of the 2008 Doha Draft Agricultural and Nonagricultural Market Access Modalities for Developing Countries. World Bank Working Paper, forthcoming.
Narayanan, B. G., and T. L. Walmsley, eds. 2008. Global Trade, Assistance, and Production: The GTAP 7 Data Base. Center for Global Trade Analysis, Purdue University.
Stiglitz, J., and A. Charlton. 2006. Aid for Trade. Report for the Commonwealth Secretariat, presented at the conference, An Assessment of the Doha Round after
Hong Kong, 2-3 February, 2006, organized by the Initiative for Policy Dialogue, Columbia University.
Endnotes
1. The tiered formula means that tariffs are cut through a certain reduction coefficient depending on their level in an interval: tariffs from x percent to y percent will be reduced by z percent. The Swiss formula means that tariff t0 will be reduced to
t1=a.t0/(a+ t0), with a > 0. For instance, let us suppose that the initial tariff is
t0=40% and that a=10%. Therefore, t1=40.10/(40+10)=400/50=8%. This formula implies that the higher the tariff, the bigger the cut. The reduction is more
pronounced when a is small, since the formula ensures thatt1 < a.
2. The G20 gathers twenty emerging countries and least-developed countries (LDCs), is led by Brazil and India, and also comprises China and South Africa. It generally plays an active role in favour of agricultural liberalization.
3. See the description of the database at
https://www.gtap.agecon.purdue.edu/databases/trade_data.asp.
4. Geographical and sectoral decomposition may be requested from the authors. 5. Jean, Laborde, and Martin, 2008.
6. Since the current U.S. domestic support is below new OTDS limits, it does not lead to reduction of current policies.
7. Stiglitz and Charlton, 2006.