INVESTIGATING FORWARD FLIGHT MULTIROTOR WIND TUNNEL TESTING IN A 3-BY 4-FOOT WIND TUNNEL
A Thesis presented to
the Faculty of California Polytechnic State University, San Luis Obispo
In Partial Fulfillment of the Requirements for the Degree Master of Science in Aerospace Engineering
by Reed Danis
© 2018 Reed Anthony Danis ALL RIGHTS RESERVED
COMMITTEE MEMBERSHIP
TITLE: Investigating Forward Flight Multirotor Wind Tunnel Testing in a 3-by 4-foot Wind Tunnel
AUTHOR: Reed Anthony Danis
DATE SUBMITTED: June 2018
COMMITTEE CHAIR: Graham Doig, Ph.D.
Professor of Aerospace Engineering
COMMITTEE MEMBER: Robert McDonald, Ph.D.
Head of Vehicle Engineering (Elevate), Uber
COMMITTEE MEMBER: Aaron Drake, Ph.D.
Professor of Aerospace Engineering
COMMITTEE MEMBER: Russell Westphal, Ph.D.
ABSTRACT
Investigating Forward Flight Multirotor Wind Tunnel Testing in a 3-by 4-foot Wind Tunnel Reed Anthony Danis
Investigation of complex multirotor aerodynamic phenomena via wind tunnel experimentation is becoming extremely important with the rapid progress in advanced distributed propulsion VTOL concepts. Much of this experimentation is being performed in large, highly advanced tunnels. However, the proliferation of this class of vehicles extends to small aircraft used by small businesses, universities, and hobbyists without ready access to this level of test facility. Therefore, there is a need to investigate whether multirotor vehicles can be adequately tested in smaller wind tunnel facilities. A test rig for a 2.82-pound quadcopter was developed to perform powered testing in the Cal Poly Aerospace Department’s Low Speed Wind Tunnel, equipped with a 3-foot tall by 4-foot wide test section. The results were compared to data from similar tests performed in the U.S. Army 7-by 10-ft Wind Tunnel at NASA Ames. The two data sets did not show close agreement in absolute terms but demonstrated similar trends. Due to measurement uncertainties, the contribution of wind tunnel interference effects to this discrepancy in measurements was not able to be properly quantified, but is likely a major contributor. Flow visualization results demonstrated that tunnel interference effects can likely be minimized by testing at high tunnel speeds with the vehicle pitched 10-degrees or more downward. Suggestions towards avoiding the pitfalls inherent to multirotor wind tunnel testing are provided. Additionally, a modified form of the conventional lift-to-drag ratio is presented as a metric of electric multirotor aerodynamic efficiency.
TABLE OF CONTENTS
Page
LIST OF TABLES ...viii
LIST OF FIGURES ... ix
NOMENCLATURE ... xii
CHAPTER 1.INTRODUCTION ... 1
1.1 UAS Multirotor Aerodynamics ... 2
1.2 Multirotor Wind Tunnel Testing Considerations ... 3
2. LITERATURE REVIEW ... 7
2.1 Notable Multirotor Wind Tunnel Tests ... 7
2.1.1 Addressing High-Lift Device Wake Impingement in Wind Tunnel Tests ... 7
2.1.2 Modern Multirotor Wind Tunnel Testing ... 8
2.2 An Equivalent Lift-to-Drag Ratio Metric for Electric Multirotors ... 9
3.TEST SETUP ... 12 3.1 Test Hardware ... 12 3.1.1 Wind Tunnel ... 12 3.1.2 Test Vehicle ... 13 3.1.3 Hardware Interface ... 17 3.1.4 Instrumentation ... 20 3.1.5 Computer Hardware ... 23 3.2 Test Software ... 23
3.2.1 Wind Tunnel Aerodynamic Control ... 23
3.2.2 Wind Tunnel Actuation ... 24
3.2.3 Force Transducer Data Recording Program ... 24
3.2.4 Test Vehicle Master Control and Data Recording Program ... 25
3.3 Signal Processing ... 29
4.1 Development of Test Plan ... 31
4.2 Test Categories ... 31
4.2.1 Unpowered Tests ... 31
4.2.2 Powered Tests ... 32
4.2.3 Wake Visualization Tests ... 33
4.2.4 Z-Height Tests ... 33
4.3 Data Processing ... 33
4.3.1 Calculating Test Run Means and Standard Deviations... 33
4.3.2 Accounting for Fuselage Weight and Aerodynamics ... 33
5.RESULTS ... 35
5.1 Comparison to NASA Ames Wind Tunnel Data ... 35
5.2 Vehicle Aerodynamics ... 39
5.2.1 Collective RPM Tests ... 39
5.2.2 Cyclic RPM Tests ... 41
5.3 Power Usage ... 43
5.3.1 Total Power Usage ... 43
5.3.2 Power Usage per Motor ... 45
5.4 Estimating the Equivalent Lift-to-Drag ... 46
5.5 Wind Tunnel Interference Tests ... 52
5.5.1 Z-Height Tests ... 52
5.6 Airflow Visualization ... 55
5.6.1 Tuft Visualization of Rotor Wake ... 55
5.6.2 Smoke Visualization of Rotor Wake ... 59
5.6.3 Rotor Inflow Visualization ... 61
6.UNCERTAINTY ANALYSIS ... 62
6.1 Motor Speed ... 62
6.2 Power Usage ... 62
7.CONCLUSIONS ... 66
7.1 Quadcopter Performance ... 66
7.2 Performing Powered Testing of Multirotor Vehicles in Limited Cross-Sectional Area Wind Tunnels ... 67
7.2.1 Minimum Instrumentation Requirements ... 67
7.2.2 Avoiding Wind Tunnel Interference ... 69
7.2.3 Developing a Test Methodology ... 69
BIBLIOGRAPHY ... 71
APPENDICES A. Additional Plots ... 73
A.1. Forces and Torques (Configuration A and B Powered Tests) ... 73
A.2. Power Usage (Configuration A and B Powered Tests) ... 76
A.3. Z-Height Tests ... 80
A.4. Additional Notes on Motor Speed Mismatch with Ames Tests... 83
B. Load Cell Drift Behavior ... 84
C. Test Procedures ... 86
C.1. Hardware Setup ... 86
C.2. Pre-Test Procedures ... 87
C.3. Post-Test Procedures ... 89
LIST OF TABLES
Table Page
1. DJI Phantom 3 Quadcopter Performance and Dimensional Specifications [20]. ... 14
2. A Comparison of RPM data collected via LabVIEW and Handheld Tachometer. ... 21
3. Mini58 Sensing Range and Resolution. ... 22
4. Methods of Software Data Filtering by Data Type. ... 30
LIST OF FIGURES
Figure Page
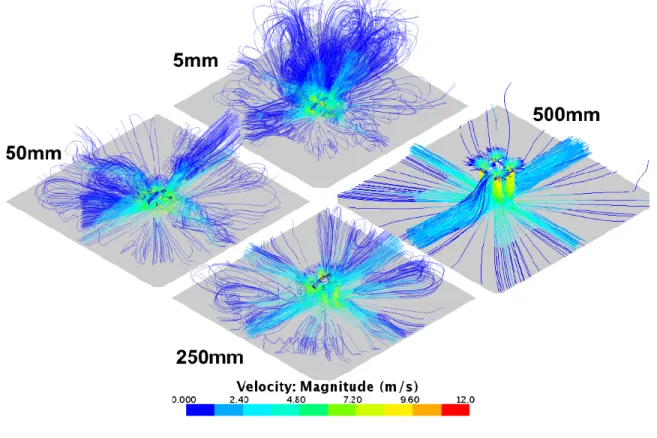
1. An Example of CFD Methods Applied to Distributed Propulsion Research - Simulated Rotor
Wake Streamlines for a Quadcopter in Ground Effect (Author’s Own Work). ... 3
2. Sketch of Looking Down Wind Tunnel at Rotor Wake Recirculating Within the Test Section (Based on an Illustration by Heyson) [13]. ... 7
3. Wind Tunnel Test Section with View of Variable Pitch Sting Mount and Boom. ... 12
4. Principal Longitudinal Plane Forces acting on Test Rig Vehicle. ... 13
5. Exterior of the Test Rig Vehicle. ... 15
6. Position of Numbered Motor-Rotor Pairs in Default and Swapped Vehicle Configurations. ... 15
7. Internal Hardware Setup of Test Rig Vehicle. ... 16
8. Test Rig Internal Hardware Wiring Diagram. ... 17
9. Data Acquisition Board. ... 18
10. Test Vehicle Mounting Setup. ... 19
11. ATI Mini58 Load Cell. ... 22
12. Screenshot of Wind Tunnel Speed Controller User Interface. ... 24
13. ATI Force Transducer LabVIEW Control Front Panel. ... 25
14. Screenshot of Master Control Program during Operation. ... 26
15. Detail of Automatic Motor RPM Control Feature. ... 27
16. Detail of Sensor Readings Panel During Operation. ... 28
17. Aerodynamic Test Data taken at NASA Ames and in the Cal Poly Wind Tunnel [5]. ... 36
18. Pitching Moment about the CG Test Data taken at NASA Ames and Cal Poly [22]. ... 37
19. Total Electrical Input Power from NASA Ames and Cal Poly Wind Tunnel Tests [22]. ... 38
20. Airframe Lift and Drag Data, Normalized by Dynamic Pressure, taken at NASA Ames and in the Cal Poly Wind Tunnel. ... 39
21. Aerodynamic Forces – Collective RPM Tests... 40
22. Pitching Moment- Collective RPM Tests. ... 41
23. Aerodynamic Forces – Cyclic RPM Tests. ... 42
25. Total Vehicle Input Power – Collective RPM Tests... 44
26. Total Vehicle Input Power – Cyclic RPM Tests. ... 44
27. Motor Power as a Fraction of Total Input Power – Collective RPM Tests. ... 45
28. Motor Power as a Fraction of Total Input Power – Cyclic RPM Tests. ... 46
29. Contours of Net FZ and FX Forces Across Test Space (NASA Ames Tests) [5]. ... 47
30. Net Force Contours across Test Space (NASA Ames Tests) [5]. ... 48
31. Input Power Contours across Test Space (NASA Ames Tests) [22]. ... 49
32. Net Force and Pitching Moment Contours across Test Space (Collective Tests)... 50
33. Net Force Contours across Test Space (Collective Tests). ... 51
34. Net Force and Pitching Moment Contours across Test Space (Cyclic Tests). ... 52
35. Effect of Rotor Plane Z-Height on Lifting Force. ... 53
36. Effect of Rotor Plane Z-Height on Pitching Moment. ... 54
37. Effect of Rotor Plane Z-Height on Total Input Power... 54
38. Position of Floor Tufts with Motors Off. ... 55
39. Effect of Motor Speed on Wake Impingement Location at 0° Vehicle Pitch Angle. ... 57
40. Effect of Vehicle Pitch Angle on Wake Impingement Location at 6400 RPM. ... 58
41. Effect of Tunnel Speed on Wake Impingement Location at 0° pitch and 6400 RPM. ... 59
42. Effect of Motor Speed on Wall Streamline Deflection at 0° Vehicle Pitch Angle. ... 60
43. Effect of Vehicle Pitch Angle on Wall Streamline Deflection at 6400 RPM. ... 60
44. Effect of Tunnel Speed on Wall Streamline Deflection at 6400 RPM. ... 61
45. Laser Illuminated Smoke Vortices Generated by Rotor Interactions at the Vehicle Centerline. ... 61
46. Measured RPM across Test Run (Pitch Angle = 0°, Front/Rear Commanded RPM = 4200 / 6400). ... 62
47. Measured Power Consumption across Test Run (Pitch Angle = 0°, Front/Rear Commanded RPM = 4200 / 6400). ... 63
48. Total Vehicle Input Power Measurement Uncertainty – Collective RPM Tests (Configuration A). ... 63
49. Measured Aerodynamic Loads across Test Run (Pitch Angle = 0°, Front/Rear Commanded RPM = 4200 / 6400). ... 64 50. Force Measurement Uncertainty due Solely to Load Cell Resolution ... 65
NOMENCLATURE
BEMF = back electromotive force BLDC = brushless DC motor
CFD = computational fluid dynamics CG = center of gravity
COTS = commercial off-the-shelf CSR = current sense resistor
D = drag, lbs
DAQ = data acquisition DC = direct current
ESC = electronic speed controller
f = frequency, Hz
FFT = fast Fourier transform
FX = force along the wind tunnel reference frame X-axis FY = force along the wind tunnel reference frame Y-axis FZ = force along the wind tunnel reference frame Z-axis
I = current, A
L = lift, lbs
L/D = conventional lift-to-drag ratio L/D|Eq = equivalent lift-to-drag ratio NP = number of motor poles
PID = proportional-integral-derivative control PInput = DC bus input power, W
PReq = power required to maintain given flight state PWM = pulse width modulation
q = dynamic pressure, lb/ft2 R = resistance, ohms RPM = revolutions per minute T = rotor thrust, lbs
TX = torque about the wind tunnel reference frame X-axis TY = torque about the wind tunnel reference frame Y-axis TZ = torque about the wind tunnel reference frame Z-axis
V = velocity
V∞ = tunnel freestream velocity, ft/s
VHigh = voltage at current sense resistor input, V VLow = voltage at current sense resistor output, V VTOL = vertical take-off and landing
W = vehicle weight, lbs
η
= efficiency1.
INTRODUCTION
he impact of ongoing improvements in electric propulsion technology over the last decade can be seen in the proliferation of small unmanned aircraft of ever increasing capability. The future potential of electric or hybrid-electric powered aircraft is a subject of intense research and development within the aerospace industry. One such focus within this greater research effort is the potential for electric propulsion to increase the feasibility of distributed propulsion concepts that utilize a large number of propulsors to improve maneuverability or aerodynamic efficiency. Effective use of these design concepts may allow for transformational aircraft designs that combine the VTOL capability of rotorcraft with the aerodynamic efficiency of fixed-wing aircraft [1]. Additionally, distributed propulsion designs may yield aerodynamic benefits when paired with conventional lift devices, such as blown wing concepts [2].
While the synergy of electric propulsion and distributed propulsion hints at a new era of technologically and economically feasible aircraft concepts, the development of these vehicles is hindered by a lack of reference data from which to make informed design decisions. Engineers seeking to design an aircraft utilizing these concepts are thus without the analytical and empirical models – and derived rules of thumb - that guide conceptual aircraft development. One critical field in which research is lacking is knowledge of how the aerodynamic interaction of multiple rotors in close proximity can improve or worsen overall performance. An intensively distributed multirotor concept carries a high degree of design risk due to the novelty of the unique aerodynamic effects it exhibits.
Multirotor helicopters are one configuration of VTOL aircraft that use a relatively high number of propulsors to maintain controlled flight. Existing multirotor designs have between 2-18 rotors and are commonly categorized by the number of rotors they use (quadcopter, octocopter, etc.). Designs with three or more rotors nearly universally utilize electrical power transmission. While the vast majority of electric multirotors are small, unmanned vehicles, there are several vehicles in late development designed for manned flight [3][4]. While there is little published data on the hover and flight performance of electric multirotor vehicles, wind tunnel test data reinforces the common impression that current designs exhibit an overall level of performance much lower than what is achievable with a conventional helicopter design [5]. Improving the performance of multirotor designs will require a better understanding of the complex
aerodynamic phenomena they exhibit. Additionally, within the context of advancing VTOL rotorcraft design in general, small multirotors such as quadcopters can serve as a low-cost platform for investigating distributed propulsion concepts that are applicable to more complex designs.
1.1 UAS Multirotor Aerodynamics
The design space for small, multirotor UAS vehicles exists at the conjunction of several complex aerodynamic phenomena. Rotors in close proximity to one another and to fuselage elements generate mutual wake interaction effects. The mutual wake interference effects for dual-rotor tandem and coaxial rotorcraft designs has been thoroughly explored and analytical models for optimizing spacing or determining correction factors are available in varying degrees of fidelity [6][7][8]. However, these models cannot be extended to cover vehicle designs with an arbitrary number and positioning of propulsors. In addition to their mutual interaction, the operational envelope of each “proprotor” encompasses propeller-like axial flow when in a straight climb, but rotor-propeller-like edgewise flight at low forward speeds, and also intermediate disc plane inclination angles at high speed forward flight. Disc plane inclination impacts the normal thrust force of the propeller and generates a yawing moment (P-factor) perpendicular the propeller axis [9]. These effects, and their impact on vehicle performance, have not been well characterized for the extreme inclination angles that quadcopters operate at during high-speed forward flight. Small multirotor craft also often utilize propellers of 11” diameter or less, with the blade airfoil sections operating under a corresponding Reynolds Number (Re) range of around 50,000-100,000. Conventionally designed small multirotor propellers have been shown to often yield lower-than-expected performance results which seem to correlate with their low Re [10]. These and other aerodynamic phenomena exhibited by small multirotor vehicles tend to degrade vehicle performance - but may also offer opportunities to boost the performance of knowledgeably designed vehicles.
Small multirotor vehicles require creative solutions to surmount the difficult problems the vehicle type faces. The facilitation of distributed propulsion architectures via electrical power transmission has reignited much interest in understanding whether the aforementioned aerodynamic phenomena can be used to improve vehicle performance. A major contributing factor to the recent reexamination of these complex aerodynamic phenomena is the proliferation of Computational Fluid Dynamic (CFD) simulation software
packages that can often provide numerical estimates of aerodynamic performance relatively cheaply and quickly [11][12]. An example use of CFD to analyze a distributed propulsion design is shown in Figure 1; in this image the effects of ground proximity on rotor wake streamlines is being numerically simulated.
However, a CFD simulation of poorly understood aerodynamic phenomenon without independent validation of the computationally derived results does little to reduce design risk. Wind tunnel data can serve as validation of CFD models and results. There is much ongoing experimental research into small-scale electric VTOL propulsion. The data from this research will provide the validation needed to reduce the risk of distributed propulsion design concepts. Increasingly complex powered wind tunnel test models will be needed to fully explore the aerodynamic effects of these distributed propulsion concepts in depth.
Figure 1. An Example of CFD Methods Applied to Distributed Propulsion Research - Simulated Rotor Wake Streamlines for a Quadcopter in Ground Effect (Author’s Own Work). 1.2 Multirotor Wind Tunnel Testing Considerations
The complexity of multirotor aerodynamics, along with their generally small size, encourages the use of full-vehicle or near-full-vehicle tests to determine performance. However, multirotor wind tunnel models
require significantly different test hardware and procedures than traditional aircraft models. Because the rotors and their corresponding wake interactions are a major source of uncertainty, they cannot be readily decoupled from the airframe or from each other, as is common in airplane design wind tunnel tests. The multirotor as a test article is essentially a highly-actuated, powered high-lift device. Providing power to the motors and controlling rotor speed requires a suite of support hardware and software. Additionally, the strong downward wake from the rotors requires special consideration (and where possible mitigation) with regard to wall tunnel interference effects.
Wind tunnel testing of multirotor vehicles requires power and speed management for every single motor. Even small multirotor vehicles can have demanding max power requirements that exceed the limits of many portable bench power supplies; for example, the 3.3 lb 3DR SOLO quadcopter at full power can consume 80W per motor [5]. Additionally, each brushless motor requires either its own 3-phase power supply or an electronic speed controller that requires both DC power and a pulse-width-modulation command signal. The multirotor can be operated wirelessly or modified to allow for power and signal cabling. The former method may require less modification and reduces interference drag from cabling. However, such a test rig would require regular battery replacement and the potential for electromagnetic interference of vehicle command and data telemetry signals would be a concern. The latter method requires modifications to internal hardware, but a DC bench power supply provides a significant advantage in power longevity and stability over a battery. The designer can also use an intermediate method in which some interfaces with the vehicle are wireless while others are wired.
The wind tunnel itself affects the flow of air past the vehicle, resulting in some level of non-equivalence between testing conditions and open-air flight. The level of this non-equivalence, and any correction factors that can be applied, have generally only been well categorized for a small subset of test types and tunnel conditions that assume a lightly loaded model that is of small size relative to the wind tunnel. Powered high-lift devices such as rotors, fan-in-wings, or blown flaps generate a large downward wake that tends to impinge on the tunnel floor, possibly even recirculating within the test section and greatly altering the overall nature of the “wall effects” influencing the test data [13]. Given the relative novelty of vehicles featuring three or more rotors, there is a lack of existing test data with which to develop or evaluate
analytical methods of wind tunnel wall effects. The most pragmatic approach towards mitigating the effect of wake impingement is to limit recirculation through the use of a tunnel with a very large test section relative to the size and thrust capability of the test article. Some other potential methods for reducing wake rollup would be to use a tunnel equipped with a “rolling road” moving floor, or a completely open test section floor. However, a thorough treatment of the wind tunnel effects would still require characterizing the impact of these features themselves.
The flight path of a multirotor is directly coupled to airspeed, pitch angle, and distributed rotor thrust. Thus, steady-level flight at any particular airspeed occurs at a singular vehicle pitch angle and set of rotor speeds. Within a wind tunnel, these factors affect the location of wake impingement on the tunnel floor and therefore influence the severity of wall effects. At low forward speeds, because of the near-horizontal vehicle pitch angle and low tunnel speed, the wake will blow down more vertically. At higher forward speeds, the thrust required for steady-level flight is greater, but the vehicle is inclined forward, which tilts the wake off-vertical. Additionally, the higher tunnel speeds impart more momentum on the rotor wake and thus the location of wake impingement on the tunnel floor will move rearward. Assuming a given wind tunnel test section is not so large as to render the wake recirculation of a given test vehicle insignificant, the vehicle can only be tested within a limited region of its flight envelope, bounded by where the wake floor impingement and rollup results in tunnel flow not approximating free-air conditions [14].
The high degree of actuation that multirotors exhibit greatly increases size of the potential test space. Along with the staple wind tunnel input metrics of dynamic pressure and test rig orientation, the multirotor experiment designer must also contend with a vast combination of rotor speed settings - and if the vehicle is capable of reconfiguration - different operational flight modes. Efficient wind tunnel testing of advanced VTOL designs, such as models of the GL-10 Greased Lightning, compress the vast test space into as few test points as possible through the use computational Design of Experiment tools. Additionally, the test rig and mounting hardware are highly actuated and the test procedure is highly automated, which allows the performance data to be quickly gathered as the vehicle automatically sweeps through different flight states and configurations [15]. This level of command over test procedure requires a tunnel with very centralized and integrated test control hardware. These automation and actuation capabilities may not be commonly
found at smaller wind tunnel test facilities. In such a case, the experimenter must carefully choose the type and fidelity of test parameters necessary to complete their experiment, lest the number of required test cases become infeasible.
2.
LITERATURE REVIEW
2.1 Notable Multirotor Wind Tunnel Tests
2.1.1 Addressing High-Lift Device Wake Impingement in Wind Tunnel Tests
NACA/NASA multirotor wind tunnel research throughout the 1950’s and 1960’s focused heavily on evaluating the accuracy of rotor inflow and lifting device wake theories for different designs and arrangements of rotors. Much of the work from this timeframe was performed at Langley Research Center under the direction of Harry H. Heyson, who published an authoritative volume of work detailing the challenges involved in analytical and wind tunnel modeling of multirotorcraft and other high-lift device aerodynamics. A major early finding of these research efforts was that high-lift devices such as rotors violated the small force coefficient assumption relied upon by methods for estimating the wind tunnel wall interference for more conventional lift devices, such as airfoils. The wake of a high-lift device such as a rotor cannot be assumed to pass directly downstream, as the lifting force significantly skews the resultant wake off-centerline, in the direction opposite of the lifting force. The rotor wake impinges on the tunnel floor, and then flows outward towards and up along the walls, creating a recirculation vortex behind the model. In extreme cases, the recirculation can envelop the model itself, in which case the tunnel flow does not adequately approximate free-air conditions [13]. An illustration of this flow circulation is shown in Figure 2.
Figure 2. Sketch of Looking Down Wind Tunnel at Rotor Wake Recirculating Within the Test Section (Based on an Illustration by Heyson) [13].
Experiments by William Rae at the University of Washington investigated the recirculation phenomenon using a large, single-rotor setup in an attempt to determine the point at which flow through the test section breaks down and wake recirculation envelops the model. Through the use of tuft boards, static pressure taps embedded in the tunnel wall, and force balance measurements, Rae developed a method for estimating the limit of rotor downwash angle beyond which flow breakdown would occur - dependent on tunnel speed, tunnel geometry, and model size (occasionally referred to as Rae’s Limit). The experiments demonstrated several important trends affecting the downwash limit - rectangular tunnel cross-sections with width-to-height ratios of 1.5 and 0.67 allowed for more downwash than a square tunnel, while adding fillets to the corners of the wind tunnel decreased the amount of allowable downwash [14]. Together, Rae and Heyson’s research demonstrated that powered lift experiments could be performed successfully even in tunnels with comparatively cross-sectional test area, provided the scope of the tests included only conditions under which the rotor wake would impinge the tunnel floor well aft of the rotor.
2.1.2 Modern Multirotor Wind Tunnel Testing
Subscale and full-scale wind tunnel testing have played a critical role throughout the last 60 years in the development of transformational VTOL concepts such as the NASA XV-15 and its predecessor prototypes[16]. Wind tunnel tests continue to be a critical tool in evaluating the complex aerodynamic, aeroelastic, and structural loading characteristics of these vehicles [17]. More recently, the rapid proliferation in electric distributed propulsion experimental designs over the last decade has seen a corresponding rise in wind tunnel evaluation of these concepts. Subscale testing of a GL-10 Greased Lightning model in the NASA Langley 12-Foot Low Speed Tunnel is one such example of wind tunnel tests being used to validate model predictions for these aerodynamically complex concepts [15].
Some recent wind tunnel experiments seek to better evaluate the current performance level of commercially available, hobbyist-level electric multirotor vehicles - which are often designed without great consideration given to rotor-rotor and rotor-airframe aerodynamic interactions. A 2016 project at NASA Ames sought to provide a set of reference data for this class of small electric multirotors by performing a series of powered tests with 5 COTS multicopters in the U.S. Army 7-by 10-ft Wind Tunnel. The vehicles, which included a DJI Phantom 3, varied 9.8 to 31.4 inches in rotor-to-rotor length and 2.8 to 12.8 lbs in nominal flight
weight. The vehicles were internally retrofitted to allow for man-in-the-loop control over motor RPM and mounted to a sting stand with integral load cell. Aerodynamic forces and electrical power was measured for a parameter set of different motor speeds, tunnel speeds, and pitch angles for each vehicle. Data from powered and unpowered tests was used to develop a set of lift, drag, and pitching moment vs. pitch angle plots for each vehicle. Static stand tests were performed to develop hover performance data. Additionally, the forward flight and hover figure of merit for an isolated rotor from each vehicle was evaluated [5]. The resulting performance data likely represents the most in-depth and professionally gathered published data for hobbyist-level multirotor vehicles.
The large size and well-characterized nature of the tunnel used in the Ames tests indicates that the force data acquired during these tests likely provides the most flight-like performance data available. The DJI Phantom 3 force data from these tests provides a comparative dataset with which to evaluate the force data obtained from similar tests performed in the Cal Poly Low Speed Wind Tunnel. This comparison will provide understanding on the feasibility of performing powered multirotor testing in smaller wind tunnels.
2.2 An Equivalent Lift-to-Drag Ratio Metric for Electric Multirotors
The lift-to-drag ratio (L/D) is a fundamental metric of an aircraft’s aerodynamic efficiency. The lift-to-drag ratio of a typical heavy utility helicopter such as the UH-60 is 3 to 5 at cruise speed; a typical fixed wing aircraft of similar weight could achieve a lift-to-drag ratio of more than 4 times greater [18]. The aerodynamic efficiency of small multirotor vehicles such as commercial quadcopters has long been understood to be quite poor. There is a lack of published data on metrics equivalent or similar to the lift-to-drag ratio for this class of vehicle. Determining the lift-to-lift-to-drag ratio of a rotorcraft is less straightforward than it is for a conventional airplane because the rotor couples the lift and thrust forces. However, if the entire rotorcraft is conceptualized as a single point, then the forces on the vehicle can be analyzed solely in terms of lift, weight, thrust, and drag forces. The thrust in this case would be the forward flight force component of the overall rotor thrust.
In many cases it may be more advantageous to determine an aerodynamic efficiency metric from the power at some point within the propulsion system. For instance, system power is much more readily measurable than propulsor thrust for many test setups. Secondly, such an approach may be more useful in the
conceptual design of small, distributed propulsion electric vehicles - where propulsor and powertrain losses across the flight envelope are not well characterized. In such a situation, a designer would have difficulty mapping the thrust-derived aerodynamic efficiency metric to system level efficiency. An aerodynamic efficiency metric derived from propulsion system power - for example, required battery power - provides the designer of an electric UAS a more immediate sense of the system efficiency of a particular type of system. Because propulsive system losses are incorporated into this metric, an attempt to generalize this metric to a class of vehicles would have to account for the quality of the propulsion system components (i.e. cheap, relatively low-efficiency motors vs. expensive, high-efficiency motors).
This project uses the metric "equivalent lift-to-drag ratio" (L/D|Eq), which is a function of the vehicle weight, airspeed, and DC bus power. For a free-flying test vehicle the counterpart to the bus power would be the battery terminal power. Under the condition of steady, level flight (zero specific excess power), the power required to maintain the flight state is:
2.1
Where PReq is the vehicle output power required, D is the total drag force acting on the vehicle, and V is the vehicle's airspeed. Dividing both sides of the equation by the vehicle weight gives:
2.2
Where W is the vehicle weight. Under the aforementioned steady, level conditions, lift produced is equal to the weight of the vehicle which can be used to alter the equation such that:
2.3
Where L is the lift force. Inverting either side of the equation and multiplying by airspeed yields:
2.4
Which indicates that the lift-to-drag ratio for a rotorcraft conceptualized as a point origin can be determined from the vehicle's weight, airspeed, and the output power. Because PReq is simply the product of thrust and airspeed this is still a statement of the conventional lift-to-drag ratio. Given a well-characterized propulsor
inclined perpendicular to the flow, PReq could be related to the power at the propulsor shaft, Pprop with a propeller efficiency map. However, no efficiency maps are available for a set of mutually interfering rotors operating across a broad range of rotor plane inclinations.
Power at the DC bus, PInput is related to required output power by the vehicle’s net input-to-output system level efficiency:
2.5
Where ηSystem is the total efficiency of the vehicle. The total system efficiency is the product of all the power losses between the input power and power output into the atmosphere:
2.6 Where ηSystem, ηControllers, ηMotors, and ηPropellers are the power loss in the power cables, motor controllers, motors, and propulsors, respectively. ηn represents potential other power loss terms a designer may deem significant, such as the impact of subsystem power draw. This system efficiency term is used to establish the lift-to-drag equivalent metric:
2.7
This equation is only valid under the following conditions and assumptions:
The side force, yaw moment, and roll moment are negligible.
The measured lift force (FZ) is equivalent to the assumed vehicle weight. The net drag force (FX) is zero.
3.
TEST SETUP
3.1 Test Hardware
The required test hardware includes the wind tunnel and its actuation and instrumentation suite, as well as the custom, powered quadcopter test rig. Additionally, a large amount of additional support equipment is needed to interface the tunnel hardware, the test rig, and the computer command and data logging interface.
3.1.1 Wind Tunnel
The Cal Poly Low Speed Wind Tunnel has provided Cal Poly students and faculty with an on-site wind tunnel facility for more than 30 years. It has been continually retrofitted and refurbished to support countless student and industry projects. The tunnel features a 4 ft. wide x 3 ft. high x 14 ft. long test section with a top airspeed of 130 MPH. Its instrumentation and test hardware includes electrically actuated position control, 6-DOF force-torque measurement capability, a 64-channel pressure transducer, a particle image velocimetry (PIV) laser scanning system, and a moving belt floor with a top speed of 100 MPH [19].
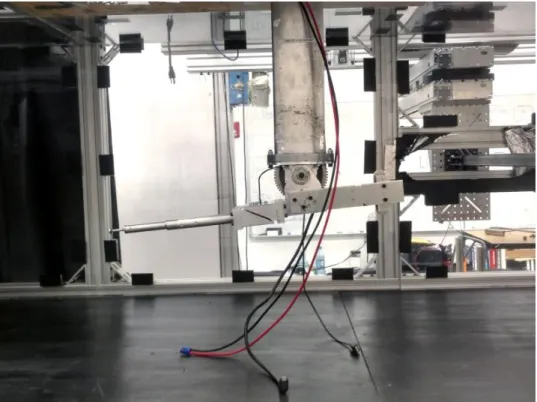
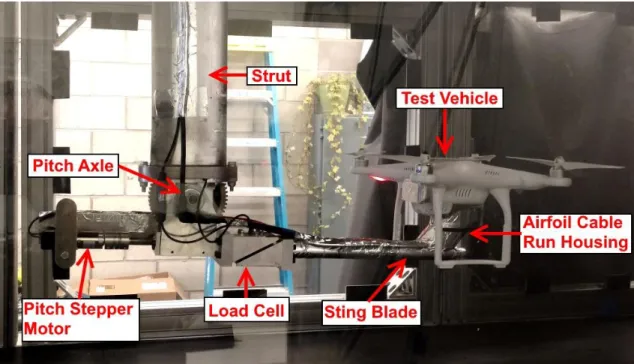
Figure 3. Wind Tunnel Test Section with View of Variable Pitch Sting Mount and Boom.
The test data frame of reference is shown in Figure 4. All force and moment data is provided in the wind axes reference frame - positive FZ points upwards, positive FX points downstream, and positive FY points
out the starboard side of the test vehicle. Correspondingly, lift is a positive FZ force, drag is a positive FX force, and a positive TY moment indicates an upwards pitching moment.
Figure 4. Principal Longitudinal Plane Forces acting on Test Rig Vehicle.
3.1.2 Test Vehicle
The test rig is based upon a DJI Phantom 3 quadcopter with the Vision Positioning System (VPS) module and landing gear mounted. The DJI Phantom 3 is a 2.82 lb “X-configuration” quadcopter widely used to capture HD aerial photography. The camera and camera mount were removed to maintain the same outer mold line as previous wind tunnel tests at NASA Ames featuring this vehicle. Most of the external hardware is identical to a stock DJI Phantom 3; however, internally the test rig is fabricated from entirely custom hardware. Several critical aircraft specifications are listed Table 1 [20].
Table 1. DJI Phantom 3 Quadcopter Performance and Dimensional Specifications [20].
The center of gravity (CG) of the DJI Phantom 3 was determined using a stock vehicle. The CG was measured to be equidistant from all four rotor axles in X-Y plane and approximately 0.55 inches below the seam line between the upper and lower plastic casings that make up the fuselage. The modified test rig used the stock vehicle CG location to set the origin for torque measurements.
External Vehicle
The test rig’s outer fuselage shell, landing gear, propellers, motors, VPS module, and various fasteners were all constructed from standard DJI OEM parts. The OEM battery module was not used due to the need to reserve internal volume for the command handling hardware and sensors. A 3D printed plastic cap approximates the external housing of the battery that protrudes from the rear of the vehicle. A view of the external features of the vehicle can be seen in Figure 5. Additional pictures of the test vehicle can be found in the appendix.
Value Units Gross Weight 2.82 lbs Max Speed 31.1 kts Service Ceiling 20000 ft Flight Endurance 23 minutes Airframe Weight 2.31 lbs Width 11.5 in Length 11.5 in Height 7.6 in Props (Each) Weight 0.03 lbs Diameter 9.5 in Camera and Mount
Figure 5. Exterior of the Test Rig Vehicle.
A critical aspect of these tests was the ability to swap the position of motor pairs that share the same direction of rotation. Thus, it was critical to be able to quickly reference the position of each motor when in their default and swapped positions, referred to as Configuration A and Configuration B, respectively. Figure 6 shows the numbering of each ESC-motor-rotor set in each position.
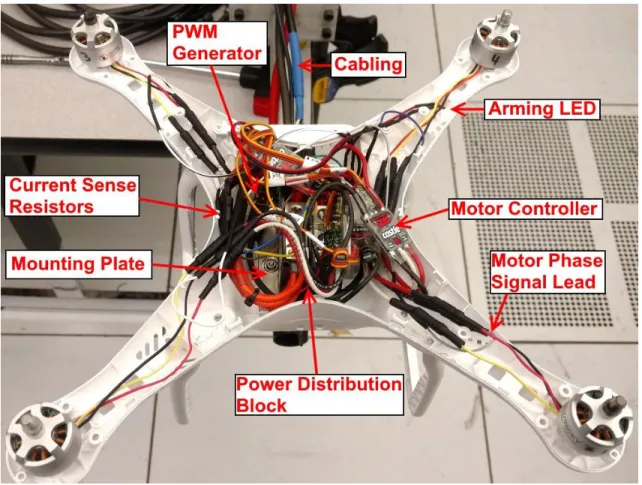
Internal Hardware
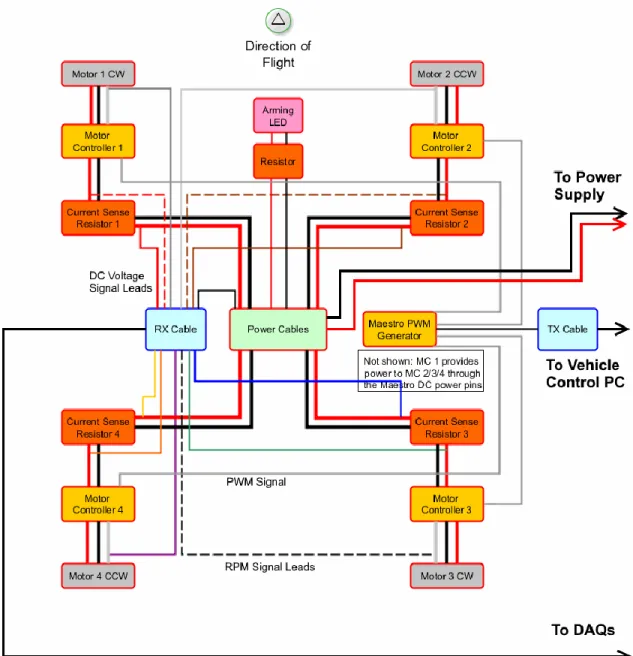
The original internal hardware of the DJI Phantom 3 was not installed into the test rig due to the difficulty of interfacing the necessary test control hardware and instrumentation with the OEM integrated controller boards. An aluminum plate bolted to the floor of the battery tray provides the mounting surface for the custom internal hardware setup. A 2-pole terminal block splits the main DC power cables to each of the four motor controllers. Motor control is managed with a set of Castle Creation Talon 25 ESC boards and a servo controller board with USB interface. A Pololu Micro Maestro servo controller board generates the pulse-width signals that the ESCs reference to set the motor speed. The specific ESC model used was selected to maintain similarity with the Phantom 3 wind tunnel reference data previously collected at NASA Ames [5]. A red LED mounted in one of the motor arms serves as an arming light to warn personnel when the motors are receiving power. An annotated image of the internal test vehicle hardware can be seen in Figure 7. A wiring diagram of the internal test rig hardware can be seen in Figure 8.
Figure 8. Test Rig Internal Hardware Wiring Diagram.
3.1.3 Hardware Interface
Power Interface
DC power is supplied to the test vehicle via 8-gauge wire; a high gauge cable was selected to minimize power loss in the cabling between the power supply and the test rig. The last 3 feet of the cable is extremely high flex to avoid wire strain from impacting the load cell readings. Power is distributed internally to the controller boards via a Schneider Electric 9080LB series power distribution block. DC power is supplied via an HP 6012B bench power supply providing a nominal 14.8V and up to 50A of current.
Command and Data Interface
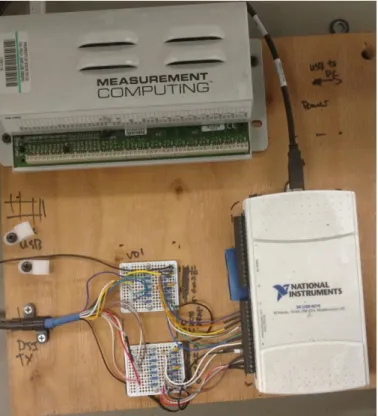
Motor commands to the test rig are handled via a USB interface that connects to the servo controller board. Test rig sensor data is transferred via a 13 position, 26 AWG shielded cable assembly to the data acquisition board mounted on top of the tunnel. Both the data and the command cable assemblies have a disconnect assembly near the test rig that allows for easier installation and removal. Similarly, the force torque transducer’s signal line is routed to the DAQ board.
The DAQ board itself is a plywood mounting surface for the two data acquisition modules and their support hardware. The Measurement Computing USB-1608HS is a 16-bit simultaneous DAQ configured for reading the differential output signals of the force transducer sensor. The National Instruments NI-USB-6210 is a 16-bit sequential DAQ configured to read the single-ended voltage outputs from the test rig sensors. Because the test rig is powered at 14.8V, the sensor lead voltage needs to be stepped down to the ±10V operating range of the NI DAQ. This step down is managed by a set of voltage divider / RC low-pass filter circuits that reduce the max nominal voltage to 7.4V and filter out signals with a frequency above the sample rate limit, which is discussed further in Section 3.3. A picture of the data acquisition board is shown in Figure 9.
Because determination of motor current draw relies on measurements compared across two DAQ channels, measurement uncertainty introduced by the 0.1% tolerances of the 10 kΩ resistors used in the voltage divider boards was a concern. To minimize this, the actual resistance of each resistor was measured to five significant figures using an Agilent U3402A digital multimeter, which allowed the resistance to be determined down to 100 milliohms. These resistance readings were referenced by the LabVIEW signal processing methods to calculate the original voltage.
Mounting Setup
The test rig is mounted via a bent sting blade bolted to the bottom of the vehicle. The steel blade is covered in a 3D printed symmetrical airfoil which provides a fairing for the cable runs into the test rig. A 3D printed conical nose cone insert covers the sting fastener point. The sting blade is bolted to the model support mechanism which consists of an armature that incorporates the force torque load cell. The armature is connected to an airfoil-shaped strut through a worm screw assembly which provides powered pitch control via a stepper motor. The entire strut moves up and down via a linear actuator above the tunnel to provide control over the vertical positioning of the test rig. An annotated view of the vehicle mounting setup can be seen in Figure 10.
3.1.4 Instrumentation
Electrical Power
Electrical power to the ESC-motor-rotor sets is measured via a current sense resistor (CSR) placed in-line with each ESC positive DC lead. Current sense resistors have a high tolerance and low resistance, and in accordance with Ohm’s law the voltage drop across their leads is proportional to the current passing through the resistor. The resistors installed in the test rig have a nominal resistance of 0.01 Ω and a tolerance of ±1%. DAQ sensor leads attached to either end of each current sense resistor allow the current flowing to each motor to be calculated from the sensor lead voltage using the equation provided in Equation 3.1:
3.1
Where I is the current flowing through the current sense resistor, VHighis the DC voltage between the power distribution block and the current sense resistor, VLow is the voltage between the current sense resistor and the ESC, and R is the nominal resistance of the current sense resistor. As shown in Equation 3.2, these two voltage measurements also allow the power usage of each ESC-motor pair to be calculated:
3.2
Where P is the power going into each ESC and I is the current.
Motor Speed
Motor speed was tracked by monitoring the back electromotive force (BEMF) on a single power lead of each motor. The test rig’s 2312 motors are typical 3-phase brushless DC motors with 14 magnet poles (7 pole pairs) and 12 stator poles. The number of signal cycles a phase completes in one mechanical rotation is equivalent to the number of magnet pole pairs on the rotor. In other words, the frequency of motor rotation can be determined by dividing the phase commutation frequency by the number of pole pairs (or by half the number of magnet poles). BEMF frequency is equivalent to the commutation frequency [21]. Accounting for conversion factors, the motor speed can be calculated from the BEMF frequency via:
3.3
Where fBEMF is the back EMF frequency of the motor lead and Np is the number of poles of the motor. The trapezoidal shape of the back EMF makes it easy to reconstruct from a set of voltage samples. The BEMF voltage on a single phase of each motor was tracked by DAQ sensor leads. Within LabVIEW, a fast Fourier transform (FFT) method was used to reconstruct the BEMF frequency from a streaming set of voltage samples. As the back EMF signal was quite noisy, the motor lead signal was run through a LabVIEW software bandpass filter with 350 Hz and 850 Hz roll-off frequencies, which corresponds via Equation 3.3 to a detectable motor speed range of about 3000-7286 RPM. The accuracy of this speed measurement method was verified through tests using an AGPtek handheld laser tachometer measuring rotor revolutions per second. The test was performed by using the LabVIEW motor command methods described in Section 3.2.4 to set a desired motor RPM, then taking a 10 second average of data gathered with both the LabVIEW FFT method and the laser tachometer. A comparison of these results is provided in Table 2. Note that the tachometer counts are twice the measured RPM due to each of the two propeller blades being counted by the optical tachometer. The method is shown to provide less than 1% error in both measured RPM and matching commanded RPM.
Table 2. A Comparison of RPM data collected via LabVIEW and Handheld Tachometer.
Force and Torque
Force and torque measurements are provided by a six degree-of-freedom ATI Mini58 Force/Torque Sensor System. The system hardware consists of the load cell module shown in Figure 11, an interface/power supply box (IFPS), and interconnecting cable assemblies. The load cell operates through a series of internal
Commanded
RPM
Measured
RPM
Counts
RPM
LabVIEW
% Error
4000
3997
8047
4024
0.652
5000
4998
10005
5003
0.099
6000
5984
11984
5992
0.130
7000
6996
13979
6990
0.088
LabVIEW
Tachometer
strain gauge circuits that change their resistance as load is applied or removed. The corresponding change in voltage through each circuit is monitored by the MC DAQ, which reads the differential voltage between each signal wire pair. A LabVIEW program is used to apply a calibration and transformation matrix to the signals to find the tunnel reference frame forces and torques. The sensing ranges and resolutions along all three sensor frame axes are provided in Table 3.
Figure 11. ATI Mini58 Load Cell.
Table 3. Mini58 Sensing Range and Resolution.
Wake Visualization Tools
A 4 x 4-ft long tuft board was built to facilitate visualization of the wake impingement location on the tunnel floor. The tuft board was constructed out of two 2-foot long plywood sheets with a white gloss surface finish. The tufts consisted of 3” long red wool string taped to the board at 3” intervals.
Measurement Range Resolution FX, FY (lbs) 157 0.037 FZ (lbs) 382 0.066 TX, TY (in-lbs) 265 0.05 TZ (in-lbs) 265 0.03
Visualization of wake rollup along the walls was accomplished with a smoke streamline generated by a commercial smoke machine vented into the front of the tunnel through a flexible hose. A green line laser pointer was also used to illuminate cross-sections of smoke flow.
3.1.5 Computer Hardware
A computer with LabVIEW installed is required to operate the control and data gathering methods. Test runs performed for this project were run on two separate computers, with one computer managing the wind tunnel sting position and the other computer running the load cell, Scanivalve pressure sensor, and test rig controller LabVIEW simulations. Running three simulations at once can be computationally intensive – this setup was managed on a laptop with an i5-2520M processor at 2.5 GHz, but required setting the LabVIEW process to a high priority to avoid occasional software race conditions.
3.2 Test Software
The primary software used for testing consisted of a suite of LabVIEW projects that provided a UI for handling test vehicle control, wind tunnel, control, and sensor data acquisition. LabVIEW is a graphical programming environment that provides a relatively easy platform for generating a user interface for test instrument control and data acquisition.
3.2.1 Wind Tunnel Aerodynamic Control
The Wind Tunnel LabVIEW program was primarily responsible for tracking tunnel speed and dynamic pressure. The program was developed by Cal Poly students working in the Low Speed Wind Tunnel facility. The program acted as a command and control center for the wind tunnel instrumentation; primarily the Scanivalve pressure transducer and the ATI force transducer, although for this project transducer data was collected by a separate LabVIEW program. The functional purpose of the Wind Tunnel Aerodynamic Control program in this project was to track tunnel speed to allow for man-in-the-loop adjustments to tunnel fan RPM. It was run on the tunnel control computer. A screenshot of the relevant parts of the wind tunnel control program while under operation can be seen in Figure 12.
Figure 12. Screenshot of Wind Tunnel Speed Controller User Interface.
3.2.2 Wind Tunnel Actuation
The Wind Tunnel Actuation Program interfaced with the test sting’s linear drive and stepper pitch motor, allowing the test rig a single axis of translation (Z-axis) and a single axis of rotation (vehicle pitch angle). The program allowed the user to manually adjust z-height and pitch independently, or set a desired pitch angle and have the mounting boom automatically raised or lowered to maintain the same relative height within the tunnel.
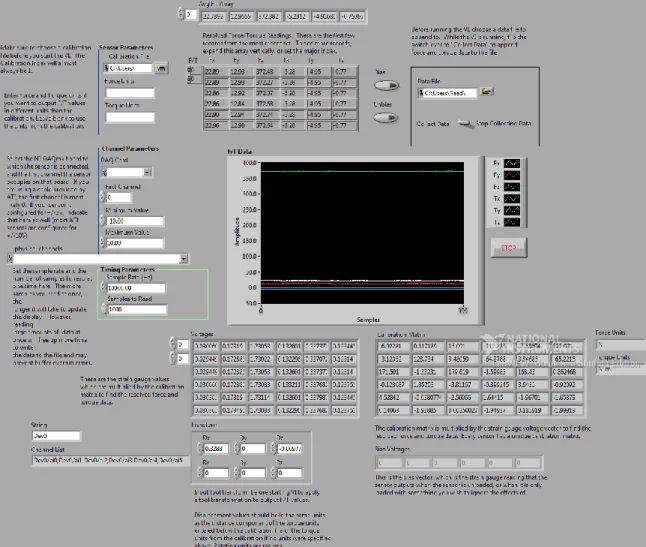
3.2.3 Force Transducer Data Recording Program
A LabVIEW program developed by ATI served as the basis for the program responsible for processing and logging force transducer data. It was slightly modified to pass the force and torque measurements to a global variable that could be read by the master control program. The program was run on the Test Vehicle Control computer. An image of the transducer data recorder front panel in its idle, uncalibrated state is shown in Figure 13. The left side of the front panel provided controls for interfacing with the load cell DAQ and data and calibration files. For test runs data was sampled at 10000 Hz, with samples read in and averaged in blocks of 1000 points. The center of the panel provided a matrix of raw voltages, a subset of the last read-in data set, and of the average values from the last data set. The bias and unbias radio buttons allowed the user to tare the current sensor readings – taring before each test run became critical as the sensor unfortunately experienced a great deal of drift, which is described further in Section 4. A final critical aspect of the force transducer controller is the transform matrix located at the center bottom of the front panel. The transform matrix allowed the user to translate the origin of the force and moment readings
to a point away from the sensor’s physical origin. For the tests runs, the origin was translated to the point in the test vehicle corresponding to an unmodified DJI 3 Phantom’s center of gravity. Because the transducer was mounted on the same arm as the test vehicle, the distance of the transform doesn’t change as the sting pitch was changed. However, since the test procedure called for the principal force axes to always be aligned with the wind axes of the tunnel, the y-axis rotation input had to be adjusted whenever the pitch angle of the sting was changed.
Figure 13. ATI Force Transducer LabVIEW Control Front Panel.
3.2.4 Test Vehicle Master Control and Data Recording Program
The Test Vehicle Master Control and Data Recording Program (referred to as QuadMotorCommand in the LabVIEW project) was the script responsible for communicating with the test vehicle, tracking test vehicle state, and processing and logging test vehicle data. Command packages were sent via USB interface to the
onboard Micro Maestro board controlling ESC PWM signal. Data was received over the USB interface from the Test Vehicle Data DAQ. Figure 14 shows an annotated view of the master control program front panel during operation. Features of the individual panels are described in further detail below.
Figure 14. Screenshot of Master Control Program during Operation.
Test Settings Panel
The test settings panel allowed the user to specify DAQ sample rate and program settings such as data buffer size, the rate at which the buffer is cleared, and the USB communications port that connects to the NI DAQ. Additionally, the user could select the location of the file containing the voltage divider board resistance data measurements and the directory to save test run data to. Data files were automatically created with a date and timestamp filename whenever the Record Data button was pressed. The Tare Power button allowed the user to tare the current voltage readings as zero for each channel – typically this was done to remove a millivolt range bias as the test rig electronics warmed up after being powered on.
System Status Panel
Current system status was provided on the System Status panel. The current number of samples in the data buffer was provided along with a status light of whether the data buffer overflowed, indicating a program fault and the loss of test data. The Error Out subpanel served as a debugger by providing a trace of program fatal errors encountered. The large Record Data toggle switch began a 30 second data gathering test run – while data was being gathered the Data Gathering light is illuminated. A smaller toggle switch directed the program whether to collect force/torque and tunnel flow data from the global workspace and log it in the data file. The remaining space in this panel was utilized for various system state displays useful for debugging program performance.
Motor Control Panel
The Motor Control Panel provided several modes for controlling the speed of the test vehicle’s motors. The Single and Collective tabs provided both a slider and text field for controlling the motor RPM singly or together, respectively. The final method shown in detail in Figure 15 automatically ramped the motors up to a set of user specified speeds and maintained that RPM via PID loop until disengaged. This was the primary control method used for the test runs as it provided highly stable motor speed. The RPM Stabilized indicator turns green once the motors are up to speed. The Reinitialize button reset the control in the event that the program loses tracking of the motor speed. The right-most data fields displayed the current pulse width in microseconds being generated by the Maestro servo controller for each channel.
Sensor Readings Panel
The sensor readings panel, shown in detail in Figure 16, provided time-lapse displays of the filtered motor sensor data. The bar chart at the top of the panel provided the real-time power spectrum of the signals on the motor lead sensors generated by the fast Fourier transform method. Each peak corresponds to the BEMF frequency of a motor; while this value was converted to motor RPM before being logged, the real-time spectrum plot served as a useful tool for monitoring whether motor RPM was stable or if the model was behaving erratically. The three scrolling waveform charts at the bottom of the panel provided the last 10 seconds worth of filtered data for the voltage and motor RPM measurements as well as the corresponding calculated motor power. In the voltage chart, VHigh is a solid line while VLow is dashed. As described in Equation 3.1, a greater distance between these two values indicated higher power consumption.
Emergency Stop Panel
A large emergency stop button provided rapid shutdown of motors by exiting any ongoing process and repeatedly directing the servo controller board to stop all motors. As a secondary safety measure, test operations could be safely ended by turning off the power supply.
3.3 Signal Processing
Running multiple brushless motors and actuators within the wind tunnel test section resulted in an electrically noisy environment; as such, the raw voltage levels from the signal leads were filtered to recover usable test data. The test setup used both a resistor-capacitor lowpass filter setup as well as a series of lowpass and bandpass filters implemented in the LabVIEW simulation software.
Hardware Filters
The NI DAQ monitoring the test vehicle motor and voltage leads utilized a fairly low sample rate of 4000 Hz to mitigate any settling error caused by the high impedance introduced by the voltage divider boards. This low sample rate was acceptable as the test methodology was to reduce all data taken in a 30 second run to a single averaged value. However, because noise on the signal lines may have a frequency beyond the Nyquist limit of the sample rate, there was a concern of the readings being affected by aliasing of high frequency noise signals. To avoid this, the voltage divider board incorporated a set of 10 nF ceramic capacitors, which together with the first resistor in the divider form a RC-lowpass filter with a cutoff frequency of 1600 Hz.
Software Filters
Raw data readings were further processed by LabVIEW signal filter emulation tools. DC voltage readings from either end of the current sense resistor were run through a lowpass filter to remove the noise caused by the motors. A fairly low cutoff frequency of around 10 Hz was found to provide stable DC voltage readings. The motor switching frequency signals used to determine the motor RPM were run through a bandpass filter; the passband was set by using equation 3.3 to determine the likely range of motor frequencies that would be encountered at the motor RPMs dictated by the test suite. Finally, the force and torque sensor readings from the load cell utilized the default ATI filter method of averaging blocks of data pulled from the data buffer. The filter methods used are tabulated by data type in Table 4.
Table 4. Methods of Software Data Filtering by Data Type.
Data Logging
Clicking the Record Data button automatically created a text file in the directory specified by the user, with the filename set to the system date and time at the start of the test. Data collected was automatically streamed to the text file – all data types taken at a specific timestep were concatenated into a single row, delimited by tab characters. Time steps were delimited by a new line character. Thus, the resulting data file represented 30 seconds worth of data, with each row representing a specific timestamp and each column representing a specific data type. The first data column was a timestamp consisting of the system uptime in milliseconds.
Data Signal Filter Type Details
Motor Voltage Lowpass Filter Cutoff: 1 Hz - 10 Hz (Variable) Motor RPM Bandpass Filter Passband: 350-850 Hz Force Transducer Averaged Data Set Set Size: 1000 Samples
4.
TESTING PROCEDURES
4.1 Development of Test Plan
Development of a test plan had to contend with the large number of potential test conditions and vehicle configurations with a limited amount of time available to test. The primary metrics swept across within the test space were motor speed and vehicle pitch angle. The test matrix consisted of a large number of test runs varying across vehicle pitch angle and motor speeds. The testing process was broken down into several sections covering different test rig configurations or data collection methods. All powered tests were repeated with the motors in their swapped configuration. Two sets of data were gathered for the airframe-only and powered motor tests to provide a means of gauging repeatability. Tunnel speed, pitch angle, and motor speed test inputs were selected to provide similarity to tests performed on the same airframe at NASA Ames [5]. The Ames data provided a reference with which to evaluate the force and torque results from this test program. Across the length of the test program, data was collected from 272 test runs. The test matrix is summarized in Table 5.
Table 5. Test Matrix Summary.
4.2 Test Categories
4.2.1 Unpowered Tests
The intention of the unpowered tests was to investigate the aerodynamic properties of the airframe. This test suite was necessitated by unpredictable drift in the load cell measurements. Despite much time-consuming effort, no method of reliably characterizing the nature of this drift was discovered. As such, the
Unpowered Tests
# Data Sets
Tunnel Speed (ft/s)
Vehicle Pitch Angle (Degrees)
Front / Rear Motor Speed (x1000 RPM)
Mounting Hardware Only 1 20 0, -2, -5, -10
-Airframe Only (Unpowered) 2 20, 40 0, -2, -5, -10, -20, -30
-Airframe and Props (Unpowered) 2 20 0, -2, -5, -10, -20, -30
-Powered Tests
Motor Configuration A - Collective 2 20 0, -2, -5, -10, -20, -30 42/42, 48/48, 53/53, 58/58, 64/64
Motor Configuration A - Cyclic 2 20 0, -2, -5, -10, -20, -30 64/42, 58/48, 48/58, 42/64
Motor Configuration B - Collective 2 20 0, -2, -5, -10, -20, -30 42/42, 48/48, 53/53, 58/58, 64/64
Motor Configuration B - Cyclic 2 20 0, -2, -5, -10, -20, -30 64/42, 58/48, 48/58, 42/64
Z-Height Interference Tests
Centerline Mounted 1 20 0, -10, -20 42/42, 53/53, 64/64
Centerline + 4" 1 20 0, -10, -20 42/42, 53/53, 64/64
Centerline + 8" 1 20 0, -10, -20 42/42, 53/53, 64/64
Wake Visualization Tests
force and torque measurements could not be simply tared with the tunnel off; instead, to mitigate the amount of drift encountered in a test run, the load cell measurements were tared prior to each powered test point. Because this method tared out forces generated by airframe aerodynamics, a suite of unpowered, airframe-only tests was needed to correct for these unaccounted aerodynamic forces. Several examples of the load cell drift behavior are provided in the appendices.
The tests were performed by positioning the test rig and setting force and torque tare with the tunnel off. The tunnel was then turned on and the fan RPM calibrated to achieve the target tunnel speed. After allowing at least 2 minutes for tunnel conditions to settle, data was gathered for a 30 second test run. The test was performed with the propellers mounted and dismounted to evaluate whether the unpowered rotors contributed significantly to the aerodynamic performance.
4.2.2 Powered Tests
The powered tests investigated the aerodynamic properties and power usage of the test rig under powered flight-like conditions. Powered testing followed a generally fixed procedure from test case to test case. With the motors unpowered, the test rig was adjusted to the pitch angle for the test. The load cell measurements were tared and 30 seconds of unpowered data was gathered to provide bias reference data for the powered test. The motors were then set to spin at their prescribed speeds and powered on. After allowing at least two minutes for the tunnel conditions to settle, the Record Data button was pressed and 30 seconds of power-on data was gathered by the LabVIEW control system. At the end of the test the motors were powered off and an additional 30 second set of unpowered data was collected to provide a second bias reference.
Powered tests consisted of two modes of motor operation – for “Collective RPM” tests all motors were run at the same target speed while for “Cyclic RPM” tests the front and rear motor pairs were operated at different target speeds. The naming convention references the common helicopter flight controls for adjusting overall rotor thrust and tilting the vehicle for forward flight. For a fixed-pitch, multirotor vehicle, this vehicle control is managed via adjustments to uniform or differential motor speeds.
4.2.3 Wake Visualization Tests
The wake visualization tests provided a set of photographs detailing the rotor wake behavior of the test rig at different pitch angles, motor speeds, and tunnel speeds. A smaller subset of test input parameters than was used for the powered tests was considered adequate for visualizing general trends of wake behavior. Wake impingement along the ground plane of the tunnel was captured using the tuft board described in Section 3.1.4. Rollup of the wake along the walls of the tunnel was visualized via the introduction of smoke. The test procedure for the visualization tests was similar to the procedure performed for the powered tests with the addition of triggering the mounted cameras during each test run.
4.2.4 Z-Height Tests
The Z-height tests investigated the impact of tunnel interference by adjusting the height of the test rig within the tunnel. Whereas all other test sets were performed with the rotor plane at the centerline of the tunnel, the Z-height tests also investigated performance with the rotor plane 4-inches and 8-inches above the centerline. Since this test set was only intended to infer general trends, the RPM and pitch angle test parameters were limited to three points each to reduce testing time.
4.3 Data Processing
4.3.1 Calculating Test Run Means and Standard Deviations
The test runs provided a set of data files containing 30-seconds worth of filtered test data taken at 50ms intervals. Each set of data had to be reduced to a single value for each data type. The primary method for achieving this was to average all of the recorded data. The standard deviation of each data type was calculated as well to provide a means for establishing the drift and scatter of data points within each test run.
4.3.2 Accounting for Fuselage Weight and Aerodynamics
The custom internal hardware of the test vehicle results in a different overall weight and center of gravity location than a stock DJI Phantom 3. The CG and weight of a stock DJI Phantom 3 are used for calculating primary torques and net lift. The default tare method for the ATI load cell sensor was found to be inadequate as it would simply zero the force and torque readings by the most recent measurement, which didn’t account for noise. To rectify this, the force and torque readings from an unpowered bias run
performed before each test run was used to provide a time-averaged tare for the force and torque data of the powered run. As mentioned in Section 4.2.1, the force and torque data of the powered test runs was tared to the tunnel-on, motors-off condition to mitigate the impact of sensor drift. Processed force and torque data from the unpowered tests was added to the powered test data to account for fuselage aerodynamic forces.
![Figure 2. Sketch of Looking Down Wind Tunnel at Rotor Wake Recirculating Within the Test Section (Based on an Illustration by Heyson) [13]](https://thumb-us.123doks.com/thumbv2/123dok_us/1878566.2774225/19.918.242.734.709.990/figure-sketch-looking-tunnel-recirculating-section-illustration-heyson.webp)