An Early Performance Analysis of
Cloud Computing Services for Scientific Computing
Simon Ostermann
1, Alexandru Iosup
2, Nezih Yigitbasi
2,
Radu Prodan
1, Thomas Fahringer
1, and Dick Epema
21
{
Simon,Radu,TF
}
@dps.uibk.ac.at
2{
A.Iosup,M.N.Yigitbasi,D.H.J.Epema
}
@tudelft.nl
Completed December 2008.
To be submitted after revision to the
ACM/IEEE Conf.
on High Performance Networking and Computing (SC09)
report number PDS-2008-006
PDS
Zuidplantsoen 4 2628 BZ Delft The Netherlands
Information about Parallel and Distributed Systems Report Series:
reports@pds.twi.tudelft.nl
Information about Parallel and Distributed Systems Section:
http://pds.twi.tudelft.nl/
c
2008 Parallel and Distributed Systems Section, Faculty of Information Technology and Systems, Department of Technical Mathematics and Informatics, Delft University of Technology. All rights reserved. No part of this series may be reproduced in any form or by any means without prior written permission of the publisher.
Early Cloud Computing EvaluationWp Wp
Abstract
Cloud Computing is emerging today as a commercial infrastructure that eliminates the need for main-taining expensive computing hardware. Through the use of virtualization, clouds promise to address with the same shared set of physical resources a large user base with different needs. Thus, clouds promise to be for scientists an alternative to clusters, grids, and supercomputers. However, virtualization may induce significant performance penalties for the demanding scientific computing workloads. In this work we present an evaluation of the usefulness of the current cloud computing services for scientific computing. We analyze the performance of the Amazon EC2 platform using micro-benchmarks, kernels, and e-Science workloads. We also compare using long-term traces the performance characteristics and cost models of clouds with those of other platforms accessible to scientists. While clouds are still changing, our results indicate that the current cloud services need an order of magnitude in performance improvement to be useful to the scientific community.
Early Cloud Computing EvaluationWp WpContents
Contents
1 Introduction 4
2 Amazon EC2 4
3 Cloud Performance Evaluation 6
3.1 Method . . . 6
3.2 Experimental Setup . . . 6
3.3 Experimental Results . . . 7
3.3.1 Resource Acquisition and Release . . . 7
3.3.2 Performance of Single-Job-Single-Machine Workloads . . . 9
3.3.3 Performance of Single-Job-Multi-Machine Workloads . . . 13
3.3.4 Performance of Multi-Job Workloads . . . 15
4 Clouds vs. Other Scientific Computing Infrastructures 16 4.1 Method . . . 16
4.2 Experimental Setup . . . 16
4.3 Comparison Results . . . 17
5 How to Improve Clouds for Scientific Computing? 18
6 Related work 19
Early Cloud Computing EvaluationWp WpList of Figures
List of Figures
1 Resource acquisition and release overheads for acquiring single instances. . . 8
2 Single-instance resource acquisition and release overheads when acquiring multiple c1.xlarge instances at the same time. . . 8
3 Evolution of the VM Install time in EC2 over long periods of time. (top) Hourly average over a period of three months. (bottom) Two-minutes average over a period of one week . . . 9
4 LMbench results. . . 10
5 Bonnie Rewrite benchmark results. . . 11
6 Bonnie benchmark results. (left) Average sequential block-read. (right) Average sequential block-write. . . 11
7 Bonnie benchmark results: average sequential per-char output. . . 12
8 CacheBench Rd-Mod-Wr benchmark results, one benchmark process per instance. . . 13
9 The HPL (LINPACK) performance of m1.small-based virtual clusters. . . 14
10 The CDF of the job response times for them1.xlargeandc1.xlargeinstance types. . . 15
11 CacheBench Wr hand-tuned benchmark results on the c1.xlarge instance type with 1–8 pro-cesses per instance. . . 18
List of Tables
1 A selection of cloud service providers. . . 52 The Amazon EC2 instance types. . . 5
3 The benchmarks used for cloud performance evaluation. . . 6
4 The EC2 VM images used for cloud computing evaluation. . . 7
5 The I/O performance of the Amazon EC2 instance types vs. other systems. . . 10
6 HPL performance and cost comparison for various EC2 instance types. . . 13
7 HPCC performance. . . 14
8 Clouds vs. grids and PPIs: workload trace characteristics. . . 16
9 Clouds vs. grids and PPIs: results. . . 17
10 How to improve the cloud for scientific computing? Performance of two cloud resource manage-ment policies. . . 19
Early Cloud Computing EvaluationWp Wp1. Introduction
1
Introduction
Scientific computing requires an ever-increasing number of resources to deliver results for growing problem sizes in a reasonable time frame. In the last decade, while the largest research projects were able to afford expensive supercomputers, other projects were forced to opt for cheaper resources such as commodity clusters and grids. Cloud computing proposes an alternative in which resources are no longer hosted by the researcher’s compu-tational facilities, but leased from big data centers only when needed. Despite the existence of several cloud computing vendors, such as Amazon [5] and GoGrid [15], the potential of clouds remains largely unexplored. To address this issue, in this paper we present a performance analysis of cloud computing services for scientific computing.
The cloud computing paradigm holds good promise for the performance-hungry scientific community. Clouds promise to be a cheap alternative to supercomputers and specialized clusters, a much more reliable platform than grids, and a much more scalable platform than the largest of commodity clusters or resource pool. Clouds also promise to “scale by credit card,” that is, scale up immediately and temporarily with the only limits imposed by financial reasons, as opposed to the physical limits of adding nodes to cluster or even supercomputers or to the financial burden of over-provisioning resources. Moreover, clouds promise good support for bags-of-tasks, currently the dominant grid application type [23]. However, clouds also raise important challenges in many areas connected to scientific computing, including performance, which is the focus of this work.
There are two main differences between the scientific computing workloads and the initial target workload of clouds, one in size and the other in performance demand. Top scientific computing facilities are very large systems, with the top ten entries in the Top500 Supercomputers List totaling together about one million cores. In contrast, cloud computing services were designed to replace the small-to-medium size enterprise data centers with 10-20% utilization. Also, scientific computing is traditionally a high-utilization workload, with production grids often running at over 80% utilization [17] and parallel production infrastructures (PPIs) averaging over 60% utilization [26]. Scientific workloads usually require top performance and HPC capabilities. In contrast, most clouds use virtualization to abstract away from actual hardware, increasing the user base but potentially lowering the attainable performance. Thus, an important research question arises: Is the performance of clouds sufficient for scientific computing? Though early attempts to characterize clouds and other virtualized services exist [42,11,34, 38], this question remains largely unexplored. Our main contribution towards answering it is threefold:
1. We evaluate the performance of the Amazon Elastic Compute Cloud (EC2), the largest commercial com-puting cloud in production (Section3);
2. We compare clouds with other scientific computing alternatives using trace-based simulation and the results of our performance evaluation (Section4);
3. We assess avenues for improving the current clouds for scientific computing; this allows us to propose two cloud-related research topics for the high performance distributed computing community (Section 5).
2
Amazon EC2
We identify three categories of cloud computing services: Infrastructure-as-a-Service (IaaS), that is, raw infras-tructure and associated middleware, Platform-as-a-Service (PaaS), that is, APIs for developing applications on an abstract platform, and Software-as-a-Service (SaaS), that is, support for running software services remotely. The scientific community has not yet started to adopt PaaS or SaaS solutions, mainly to avoid porting legacy applications and for lack of the needed scientific computing services, respectively. Thus, in this study we are focusing on IaaS providers.
Unlike traditional data centers, which lease physical resources, most clouds lease virtualized resources which are mapped and run transparently to the user by the cloud’s virtualization middleware on the cloud’s physical
Early Cloud Computing EvaluationWp Wp2. Amazon EC2
Table 1: A selection of cloud service providers. VM stands for virtual machine, S for storage.
Service type Examples
VM,S Amazon (EC2 and S3), Mosso (+CloudFS), ...
VM GoGrid, Joyent, infrastructures based on Condor
Glide-in [37]/Globus VWS [14]/Eucalyptus [33], ...
S Nirvanix, Akamai, Mozy, ...
non-IaaS 3Tera, Google AppEngine, Sun Network, ...
Table 2: The Amazon EC2 instance types. The ECU is the CPU performance unit defined by Amazon.
Name ECUs RAM Archi I/O Disk Cost
(Cores) [GB] [bit] Perf. [GB] [$/h]
m1.small 1 (1) 1.7 32 Med 160 0.1
m1.large 4 (2) 7.5 64 High 850 0.4
m1.xlarge 8 (4) 15.0 64 High 1690 0.8
c1.medium 5 (2) 1.7 32 Med 350 0.2
c1.xlarge 20 (8) 7.0 64 High 1690 0.8
resources. For example, Amazon EC2 runs instances on its physical infrastructure using the open-source vir-tualization middleware Xen [8]. By using virtualized resources a cloud can serve with the same set of physical resources a much broader user base; configuration reuse is another reason for the use of virtualization. Sci-entific software, compared to commercial mainstream products, is often hard to install and use [9]. Pre- and incrementally-built virtual machine (VM) images can be run on physical machines to greatly reduce deployment time for scientific software [31].
Many clouds already exist, but not all provide virtualization, or even computing services. Table1summarizes the characteristics of several clouds currently in production; of these, Amazon is the only commercial IaaS provider with an infrastructure size that can accommodate entire grids and PPI workloads.
EC2 is an IaaS cloud computing service that opens Amazon’s large computing infrastructure to its users. The service is elastic in the sense that it enables the user to extend or shrink its infrastructure by launching or terminating new virtual machines (instances). The user can use any of the fiveinstance typescurrently available on offer, the characteristics of which are summarized in Table 2. An ECU is the equivalent CPU power of a 1.0-1.2 GHz 2007 Opteron or Xeon processor. The theoretical peak performance can be computed for different instances from the ECU definition: a 1.1 GHz 2007 Opteron can perform 4 flops per cycle at full pipeline, which means at peak performance one ECU equals 4.4 gigaflops per second (GFLOPS).
To create an infrastructure from EC2 resources, the user first requires the launch of one or several instances, for which it specifies the instance type and the VM image; the user can specify any VM image previously registered with Amazon, including Amazon’s or the user’s own. Once the VM image has been transparently deployed on a physical machine (the resource status isrunning), the instance is booted; at the end of the boot process the resource status becomesinstalled. The installed resource can be used as a regular computing node immediately after the booting process has finished, via an ssh connection. A maximum of 20 instances can be used concurrently by regular users; an application can be made to increase this limit. The Amazon EC2 does not provide job execution or resource management services; a cloud resource management system can act as middleware between the user and Amazon EC2 to reduce resource complexity. Amazon EC2 abides by a Service Level Agreement in which the user is compensated if the resources are not available for acquisition at least 99.95% of the time, 365 days/year. The security of the Amazon services has been investigated elsewhere [34].
Early Cloud Computing EvaluationWp Wp3. Cloud Performance Evaluation
Table 3: The benchmarks used for cloud performance evaluation. B, FLOP, U, MS, and PS stand for bytes, floating point operations, updates, makespan, and per second, respectively.
Type Suite/Benchmark Resource Unit
SJSI lmbench/all Many Many
SJSI Bonnie/all Disk MBps
SJSI CacheBench/all Memory MBps
SJMI HPCC/HPL CPU, float GFLOPS
SJMI HPCC/DGEMM CPU, double GFLOPS
SJMI HPCC/STREAM Memory GBps
SJMI HPCC/RandomAccess Network MUPS
SJMI HPCC/bef f Memory µs, GBps
MJMI -/Trace Workload MS
3
Cloud Performance Evaluation
In this section we present a performance evaluation of cloud computing services for scientific computing.
3.1
Method
We design a performance evaluation method that allows an assessment of clouds, and a comparison of clouds with other scientific computing infrastructures such as grids and PPIs. To this end, we divide the evaluation procedure into two parts, the first cloud-specific, the second infrastructure-agnostic.
Cloud-specific evaluation An attractive promise of clouds is that there are always unused resources, so that they can be obtained at any time without additional waiting time. However, the load of other large-scale systems varies over time due to submission patterns; we want to investigate if large clouds can indeed bypass this problem. Thus, we test the duration of resource acquisition and release over short and long periods of time. For the short-time periods one or more instances of the same instance type are repeatedly acquired and released during a few minutes; the resource acquisition requests follow a Poisson process with arrival rateλ= 1s. For the long periods an instance is acquired then released every 2 minutes over a period of one week, then hourly averages are aggregated from the 2-minute samples taken over a period of at least one month.
Infrastructure-agnostic evaluation There currently is no single accepted benchmark for scientific com-puting at large-scale [19]. In particular, there is no such benchmark for the common scientific computing scenario in which an infrastructure is shared by several independent jobs, despite the large performance losses that such a scenario can incur [6]. To address this issue, our method both uses traditional benchmarks comprising suites of job to be run in isolation and replays workload traces taken from real scientific computing environments.
We design three types of test workloads: SJSI/MJSI–run one or more single-process jobs on a single instance (possibly with multiple cores), SJMI–run a single multi-process jobs on multiple instances, and MJMI–run multiple jobs on multiple instances. The SJSI, MJSI, and SJMI workloads all involve executing one or more from a list of four open-source benchmarks: LMbench [28], Bonnie [10], CacheBench [29], and the HPC Challenge Benchmark (HPCC) [27]. The characteristics of the used benchmarks and the mapping to the test workloads are summarized in Table3; we refer to the benchmarks’ references for more details.
MJMI workloads are workload traces taken from real scientific computing environments [17]. A workload trace comprises a number of jobs. For each job the trace records an abstract description of the job that includes at least the job size, and the job’s submission, start, and end time. The Grid Workloads Archive (GWA) [22] and the Parallel Workloads Archive (PWA) [3] are two large online trace repositories for grids and PPIs, respectively.
3.2
Experimental Setup
Early Cloud Computing EvaluationWp Wp3.3 Experimental Results
Table 4: The EC2 VM images. FC6 stands for Fedore Core 6 OS (Linux 2.6 kernel).
EC2 VM image Software Archi Benchmarks
ami-2bb65342 FC6 32bit Bonnie & LMbench
ami-36ff1a5f FC6 64bit Bonnie & LMbench
ami-3e836657 FC6 & MPI 32bit HPCC
ami-e813f681 FC6 & MPI 64bit HPCC
Performance Analysis ToolWe have extended the GrenchMark [18] large-scale distributed testing frame-work with new features which allow it to test cloud computing infrastructures. The frameframe-work was already able to generate and submit both real and synthetic workloads to grids, clusters, and other large-scale distributed environments. For this work we have added to GrenchMark the ability to measure cloud-specific metrics such as resource acquisition time and experiment cost.
Cloud resource management We have also added to the framework basic cloud resource management functionalities, since currently no resource management components and no middleware exist for accessing and managing cloud resources. We have identified four alternatives for managing these virtual resources, based on whether there is a queue between the submission host and the cloud computing environment and whether the resources are acquired and released for each submitted job. We discuss the two alternatives that were used in this work in Section5.
Performance metricsWe use the performance metrics defined by the benchmarks used in this work. We also define and use theHPL efficiency for a real virtual cluster based on instance typeTas the ratio between the HPL benchmark performance of the cluster and the performance of another real environment formed with only one instance, expressed as a percentage.
EnvironmentWe perform all our measurements on the Amazon EC2 environment. However, this does not limit our results, as there are sufficient reports of performance values for all the Single-Job benchmarks, and in particular for the HPCC [2]. For our experiments we build homogeneous environments with 1 to 32 cores based on the five EC2 instance types.
Amazon EC2 offers a wide range of ready-made machine images. In our experiments, we used the images listed in Table 4 for the 32 and 64 bit instances; all VM images are based on a Fedora Core 6 OS with Linux 2.6 kernel. The VM images used for the HPCC benchmarks also have a working pre-configured MPI based on thempich2-1.0.5[40] implementation.
Optimizations, tuningThe benchmarks were compiled using GNU C/C++ 4.1 with the-O3 -funroll-loops
command-line arguments. We did not use any additional architecture- or instance-dependent optimizations. For the HPL benchmark, the performance results depend on two main factors: the the Basic Linear Algebra Sub-program (BLAS) [12] library, and the problem size. We used in our experiments the GotoBLAS [39] library, which is one of the best portable solutions freely available to scientists. Searching for the problem size that can deliver peak performance is an extensive (and costly); instead, we used a free mathematical problem size analyzer [4] to find the problem sizes that can deliver results close to the peak performance: five problem sizes ranging from 13,000 to 55,000.
3.3
Experimental Results
The experimental results of the Amazon EC2 performance evaluation are presented in the following. 3.3.1 Resource Acquisition and Release
We study three resource acquisition and release scenarios: for single instances over a short period, for multiple instances over a short period, and for single instances over a long period of time.
Early Cloud Computing EvaluationWp Wp3.3 Experimental Results 0 20 40 60 80 100 120 140 160 180 200
m1.small m1.large m1.xlarge c1.medium c1.xlarge m1.small
m1.large m1.xlarge c1.medium c1.xlarge m1.small
m1.large m1.xlarge c1.medium c1.xlarge m1.small
m1.large m1.xlarge c1.medium c1.xlarge
Duration [s]
Total Time for Res. Acquisition
VM Boot Time for Res. Acquisition VM Deployment Time
for Res. Acquisition
Total Time for Res. Release 883 881 685 Quartiles Median Mean Outliers
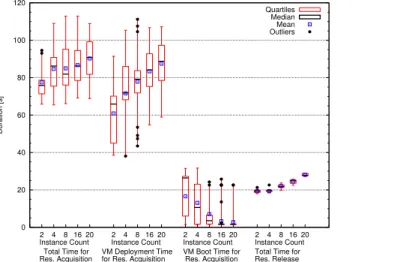
Figure 1: Resource acquisition and release overheads for acquiring single instances.
0 20 40 60 80 100 120 2 4 8 16 20 2 4 8 16 20 2 4 8 16 20 2 4 8 16 20 Duration [s]
Instance Count Instance Count Instance Count Instance Count Total Time for
Res. Acquisition
VM Boot Time for Res. Acquisition VM Deployment Time
for Res. Acquisition
Total Time for Res. Release Quartiles
Median Mean Outliers
Figure 2: Single-instance resource acquisition and release overheads when acquiring multiple c1.xlarge in-stances at the same time.
Single instancesWe first repeat 20 times for each of the five instance types a resource acquisition followed by a release as soon as the resource status becomes installed (see Section 2). Figure 1 shows the overheads associated with resource acquisition and release in EC2. The total resource acquisition time (Total) is the sum of the Install andBoot times. TheRelease time is the time taken to release the resource back to EC2; after it is released the resource stops being charged by Amazon. Thec1.*instances are surprisingly easy to obtain; in contrast, the m1.* instances have for the resource acquisition time higher expectation (63-90s compared to around 63s) and variability (much larger boxes). With the exception of the occasional outlier, both the VM Boot andRelease times are stable and represent about a quarter ofTotal each.
Multiple instancesWe investigate next the performance of requesting the acquisition of multiple resources (2,4,8,16, and 20) at the same time; this corresponds to the real-life scenario where a user would create a homogeneous cluster from Amazon EC2 resources. When resources are requested in bulk, we record acquisition and release times for each resource in the request, separately. Figure2shows the basic statistical properties of the times recorded forc1.xlargeinstances. The expectation and the variability are both higher for multiple instances than for a single instance.
Early Cloud Computing EvaluationWp Wp3.3 Experimental Results 0 20 40 60 80 100 120 140 02-08 00:00 16-08 00:00 30-08 00:00 13-09 00:00 27-09 00:00 11-10 00:00 25-10 00:00 08-11 00:00 22-11 00:00
Resource Acquisition Delay [s]
Date/Time Duration (avg) 0 20 40 60 80 100 120 140 160 06-08 00:00 07-08 00:00 08-08 00:00 09-08 00:00 10-08 00:00 11-08 00:00 12-08 00:00 13-08 00:00 14-08 00:00 15-08 00:00 16-08 00:00 17-08 00:00 18-08 00:00 19-08 00:00 20-08 00:00 21-08 00:00
Resource Acquisition Delay [s]
Date/Time
Duration (avg) Duration (min) Duration (max)
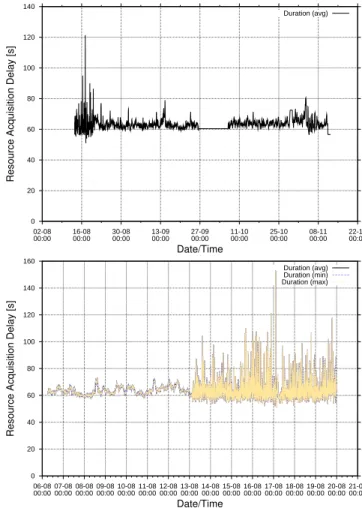
Figure 3: Evolution of the VM Install time in EC2 over long periods of time. (top) Hourly average over a period of three months. (bottom) Two-minutes average over a period of one week
Long-term investigation Last, we discuss the Install time measurements published online by the inde-pendent CloudStatus team [1]. We have written web crawlers and parsing tools and taken samples every two minutes between Aug 2008 and Nov 2008 (two months). We find that the time values fluctuate within the expected range (expected value plus or minus the expected variability, see Figure 3). We conclude that in Amazon EC2 resources can indeed be provisioned without additional waiting time due to system overload. 3.3.2 Performance of Single-Job-Single-Machine Workloads
In this set of experiments we measure the raw performance of the CPU, I/O, and memory hierarchy using the Single-Instance benchmarks listed in Section3.1.
Compute performanceWe assess the computational performance of each instance type using the entire LMbench suite. The performance of int and int64 operations, and of the float and double float operations is depicted in Figure 4 top and bottom, respectively. The GOPS recorded for the floating point and double operations is6−8×lower than the theoretical maximum of ECU (4.4 GOPS).Also, the double float performance of the c1.* instances, arguably the most important for scientific computing, is mixed: excellent addition but poor multiplication capabilities. Thus, as many scientific computing applications use heavily both of these
Early Cloud Computing EvaluationWp Wp3.3 Experimental Results 0 2 4 6 8 10
m1.small m1.large m1.xlarge c1.medium c1.xlarge
Performance [GOPS]
Instance Type
INT-bit INT-add INT-mul INT64-bit INT64-mul
0 0.2 0.4 0.6 0.8 1
m1.small m1.large m1.xlarge c1.medium c1.xlarge
Performance [GOPS] Instance Type FLOAT-add FLOAT-mul FLOAT-bogo DOUBLE-add DOUBLE-mul DOUBLE-bogo
Figure 4: LMbench results. The Performance of 32- and 64-bit integer operations in giga-operations per second (GOPS) (top), and of floating operations with single and double precision (bottom).
Table 5: The I/O performance of the Amazon EC2 instance types and of 2002 [25] and 2007 [7] systems.
Seq. Output Seq. Input Rand.
Instance Char Block Rewrite Char Block Input
Type [MB/s] [MB/s] [MB/s] [MB/s] [MB/s] [Seek/s] m1.small 22.37 60.18 33.27 25.94 73.46 74.4 m1.large 50.88 64.28 24.40 35.92 63.20 124.3 m1.xlarge 56.98 87.84 33.35 41.18 74.51 387.9 c1.medium 49.15 58.67 32.80 47.43 74.95 72.4 c1.xlarge 64.85 87.82 29.96 44.98 74.46 373.9 ’02 Ext3 12.24 38.75 25.66 12.67 173.68 -’02 RAID5 14.45 14.32 12.19 13.50 73.03 -’07 RAID5 30.88 40.63 29.03 41.91 112.69 192.9
operations, the user is faced with the difficult problem of selecting between two wrong choices. Finally, several floating and double point operations take longer onc1.mediumthan onm1.small.
Early Cloud Computing EvaluationWp Wp3.3 Experimental Results 0 200 400 600 800 1000 1200 1400
1024KiB 2MiB 5MiB 10MiB 20MiB 50MiB 100MiB 500MiB 1000MiB 2GiB 5GiB Rewrite Bonnie benchmark Sequential Output [MBps]
Test File Size
c1.xlarge c1.medium m1.xlarge m1.large m1.small
Figure 5: The results of the Bonnie Rewrite benchmark. The performance drop indicates the capacity of the memory-based disk cache.
0 500 1000 1500 2000 2500 3000 3500 4000
1024KiB 2MiB 5MiB 10MiB 20MiB 50MiB 100MiB 500MiB 1000MiB
Metric: Seq.In.Block.MBps
Test File Size m1.small m1.large m1.xlarge c1.medium c1.xlarge 0 100 200 300 400 500 600 700 800
1024KiB 2MiB 5MiB 10MiB 20MiB 50MiB 100MiB 500MiB 1000MiB
Metric: Seq.Out.Block.MBps
Test File Size m1.small
m1.large m1.xlarge c1.medium c1.xlarge
Figure 6: Bonnie benchmark results. (left) Average sequential block-read. (right) Average sequential block-write.
I/O performance We assess the I/O performance of each instance type with the Bonnie benchmarking suite, in two steps. The first step is to determine the smallest file size that invalidates the memory-based I/O cache, by running the Bonnie suite for thirteen file sizes in the range 1024 Kilo-binary byte (KiB) to 40 GiB. Figure5 depicts the results of the rewrite with sequential output benchmark, which involves sequences of read-seek-write operations of data blocks that are dirtied before writing. For all instance types, a performance drop begins with the 100MiB test file and ends at 2GiB, indicating a capacity of the memory-based disk cache of 4-5GiB (twice 2GiB). Thus, the results obtained for the file sizes above 5GiB correspond to the real I/O performance of the system; lower file sizes would be served by the system with a combination of memory and disk operations. We analyze the I/O performance obtained for files sizes above 5GiB in the second step; Table5
summarizes the results. We find that the I/O performance indicated by Amazon EC2 (see Table2) corresponds to the achieved performance for random I/O operations (column ’Rand. Input’ in Table 5). The *.xlarge
instance types have the best I/O performance from all instance types. For the sequential operations more typical to scientific computing all Amazon EC2 instance types have in general better performance when compared with similar modern commodity systems, such as the systems described in the last three rows in Table5.
Other I/O tests We also conduct a full baterry of tests involving nine file sizes in the range 1024 Kilo-binary byte (KiB) to 1000 MiB. Figure6 (left) depicts the results of average sequential block-read benchmark. Thec1.xlargeinstance performs best in this test, with 3632.65 MBps for the 1024 KiB test file and 1901.25
Early Cloud Computing EvaluationWp Wp3.3 Experimental Results 0 10 20 30 40 50 60 70 80
1024KiB 2MiB 5MiB 10MiB 20MiB 50MiB 100MiB500MiB1000MiB 2GiB 5GiB 10GiB 20GiB
Metric: Seq.Out.PerChar.MBps
Test File Size m1.small
m1.large m1.xlarge c1.medium c1.xlarge
Figure 7: Bonnie benchmark results: average sequential per-char output.
MBps for the 1000 MiB test file, almost 4 times faster thenm1.small, the lowest performer. The performance of the other three instance types is in the bandwidth range from 1200 to 1800 MBps. The performance of the sequential character-by-character reads benchmark (not shown) is much worse, always below 85 Mbps. The results of the random seek benchmark (not shown) lead to similar findings, with maximum values of up to 140,000 (37,000) seeks/second forc1.xlarge(m1.small), the best (worst) performer. Figure6(right) depicts the results of average sequential block-write benchmark. The fastest instance type is again c1.xlarge, with values of 722.07 MBps for 1024KiB and 449.79MBps for 1000 MiB file sizes, this is up to 40! times faster than
m1.small, again the lowest performer. Unexpectedly, the c1.medium instance has a significant performance drops for file sizes beyond 100 MiB, down to a throughput minimum of 45.2 MBps for the maximum test file size.
Figure7 shows the results for the throughput achieved by sequential read of characters in the test file. The results do not differ much until the file size reaches 5 GiB. The m1.small instances showing a performance of around 21 MBps, while the fastest one c1.xlarge achieves an average value of 80MBps (3.8 times faster). The m1.large results were really good for 1024 KiB file size with the highest value of 83.15MBps which drops for the 2 MiB size to more reasonable value of 59.05 MBps and stabilises afterwards.
Memory hierarchy performance We test the performance of the memory hierarchy using CacheBench on each instance type. Figure 8 depicts the performance of the memory hierarchy when performing the Rd-Mod-Wr benchmark with 1 benchmark process per instance. Thec1.* instances perform very similar, almost twice as good as the next performance group formed bym1.xlargeandm1.large; them1.smallinstance is last with a big performance gap for working sets of 217
–219
B. We find the memory hierarchy sizes by extracting the major performance drop-offs. The visible L1/L2 memory sizes are 64KB/1MB for them1.*instances; thec1.*
instances have only one performance drop point around 2MB (L2). Looking at the other results (not shown), we find that L1 c1.* is only 32KB. For the Rd and Wr unoptimized benchmarks we have obtained similar results up to the L2 cache boundary, after which the performance of m1.xlargedrops rapidly and the system performs worse thanm1.large. We speculate on the existence of a throttling mechanism installed by Amazon to limit resource consumption. If this speculation is true, the performance of scientific computing applications would be severely limited when the working set is near or past the L2 boundary.
Early Cloud Computing EvaluationWp Wp3.3 Experimental Results 0 5000 10000 15000 20000 25000 30000 35000 40000 210 215 220 225 230 Performance [MBps] Working Set [B] 32KB 1MB m1.small m1.large m1.xlarge c1.medium c1.xlarge
Figure 8: CacheBench Rd-Mod-Wr benchmark results, one benchmark process per instance. Table 6: HPL performance and cost comparison for various EC2 instance types.
Peak GFLOPS GFLOPS
Name Perf. GFLOPS /ECU /$1
m1.small 4.4 1.96 1.96 19.6
m1.large 17.6 7.15 1.79 17.9
m1.xlarge 35.2 11.38 1.42 14.2
c1.medium 22.0 3.91 0.78 19.6
c1.xlarge 88.0 51.58 2.58 64.5
instance type. To get a better picture of the side effects caused by the sharing with other users the same physical resource, a long-term evaluation would be required. A recent analysis of the load sharing mechanisms offered by Xen [16] shows that there exist mechanisms to handle well CPU-sharing. Hoewever, as the end-users do not control the mapping of VM instances to real resources, there is no deterministic and repeatable test setup for this situation.
Reliability We have encountered several system problems during the SJSI experiments. When running the LMbench benchmark on a c1.mediuminstance using the default VM image provided by Amazon for this architecture, the test did not complete and the instance became partially responsive; the problem was repro-ducible on another instance of the same type. For one whole day we were no longer able to start instances–any attempt to acquire resources was terminated instantly without a reason. Via the Amazon forums we have found a solution to the second problem (the user has to perform manually several account/setup actions); we assume it will be fixed by Amazon in the near future.
3.3.3 Performance of Single-Job-Multi-Machine Workloads
In this set of experiments we measure the performance delivered by homogeneous clusters formed with Amazon EC2 instances when running the Single-Job-Multi-Machine benchmarks. For these tests we execute the HPCC benchmark on homogeneous clusters of size 1–16 instances.
HPL performance The performance achieved for the HPL benchmark on various virtual clusters based on them1.smallinstance is depicted in Figure9. The cluster with one node was able to achieve a performance of 1.96 GFLOPS, which is 44.54% from the peak performance advertised by Amazon. For 16 instances we have obtained 27.8 GFLOPS, or 39.4% from the theoretical peak and 89% efficiency. We further investigate
Early Cloud Computing EvaluationWp Wp3.3 Experimental Results 0 8 16 24 32 1 2 4 8 16 0 25 50 75 100 Performance [GFLOPS] Efficiency [%] Number of Nodes
LINPACK Performance [GFLOPS] LINPACK Efficiency [%]
Figure 9: The HPL (LINPACK) performance of m1.small-based virtual clusters.
Table 7: The HPCC performance for various platforms. HPCC-x is the system with the HPCC IDx [2]. The machines HPCC-227 and HPCC-228, HPCC-237, and HPCC-286 are of brand TopSpin/Cisco, Intel Atlantis, and Intel Endeavor, respectively.
Peak Perf. HPL DGEMM STREAM RandomAccess Latency Bandwidth Provider, System [GFLOPS] [GFLOPS] [GFLOPS] [GBps] [MUPs] [µs] [GBps]
EC2, m1.small 4.40 1.96 2.62 3.49 11.60 - -EC2, m1.large 17.60 7.15 6.83 2.38 54.35 20.48 0.70 EC2, m1.xlarge 35.20 11.38 8.52 3.47 168.64 17.87 0.92 EC2, c1.medium 22.00 - 11.85 3.84 46.73 13.92 2.07 EC2, c1.xlarge 88.00 51.58 44.05 15.65 249.66 14.19 1.49 EC2, 16 x m1.small 70.40 27.80 4.36 11.95 77.83 68.24 0.10 EC2, 2 x c1.xlarge 176.00 - - 15.77 280.10 24.18 1.49 HPCC-228, 8 cores 51.20 27.78 4.88 2.95 10.29 5.81 0.66 HPCC-227, 16 cores 102.40 55.23 4.88 2.95 10.25 6.81 0.66 HPCC-237, 16 cores 170.24 134.19 9.67 3.99 58.45 2.27 1.51 HPCC-286, 16 cores 179.20 153.25 10.50 5.18 87.61 1.23 1.96
the performance of the HPL benchmark for different instance types; Table 6 summarizes the results. The
c1.xlarge instance achieves good performance (51.58 out of a theoretical performance of 88 GFLOPS, or 58.6%), but the other instance types do not reach even 50% of their theoretical peak performance. The low performance of c1.medium is due to the reliability problems discussed later in this section. Cost-wise, the
c1.xlarge instance can achieve up to 64.5 GFLOPS/$ (assuming an already installed instance is present), which is the best measured value in our test. This instance type also has in our tests the best ratio between its Amazon ECU rating (column “ECUs” in Table2) and achieved performance (2.58 GFLOPS/ECU).
HPCC performance To obtain the performance of virtual EC2 clusters we run the HPCC benchmarks on unit clusters comprising one instance, and on 16-core clusters comprising at least two instances. Table7
summarizes the obtained results and, for comparison, results published by HPCC for four modern and similarly-sized HPC clusters [2]. For HPL, only the performance of thec1.xlargeis comparable to that of an HPC system. However, for DGEMM, STREAM, and RandomAccess the performance of the EC2 clusters is similar or better than the performance of the HPC clusters. We attribute this mixed behavior to the network characteristics: the EC2 platform has much higher latency, which has an important negative impact on the performance of the HPL benchmark. In particular, this relatively low network performance means that the ratio between the theoretical peak performance and achieved HPL performance increases with the number of instances, making the virtual
Early Cloud Computing EvaluationWp Wp3.3 Experimental Results 0 10 20 30 40 50 60 70 80 90 100 0 20 40 60 80 100 120 CDF [%] Response Time [s] c1.xlarge m1.xlarge
Figure 10: The CDF of the job response times for them1.xlargeandc1.xlargeinstance types.
EC2 clusters poorly scalable. Thus, for scientific computing applications similar to HPL the virtual EC2 clusters can lead to an order of magnitude lower performance for large system sizes (1024 cores and higher), while for other types of scientific computing the virtual EC2 clusters are already suitable execution environments.
Reliability We have encountered several reliability problems during these experiments; the two most im-portant were related to HPL and are reproducible. First, them1.largeinstances hang for an HPL problem size of 27,776 (one process blocks). Second, on the c1.mediuminstance HPL cannot complete problem sizes above 12,288 even if these should still fit in the available memory; as a result, the achieved performance onc1.medium
was much lower than expected.
3.3.4 Performance of Multi-Job Workloads
We use a trace from a real system to assess the performance overheads due to executing complete workloads instead of single jobs in a virtual Amazon EC2 cluster. To this end, we replay on EC2 a part of the trace of our multi-cluster DAS3 grid system, which trace contains the jobs submitted to one of the DAS3 clusters. The trace is dominated by an independent set of jobs submitted together (a bag-of-tasks [21, 23]). As the DAS3 cluster consists of 32 processors, in our experiments we use either 8m1.xlargeinstances or 4c1.xlarge
instances. A space sharing policy is emulated for the virtual clusters in these experiments. We submit the same workload repeatedly for each instance type, and follow two main performance characteristics: (i) the stability of the workload makespan, that is, the basic statistical properties of the measured workload makespan values, and (ii) the overhead associated with resource acquisition and release, and with job execution.
Stable results and low overhead for the execution of concurrent jobs For each instance type, we have found the individual makespan values obtained from repeated workload replays to be less than 1% different from the median workload makespan. Figure 10depicts the CDFs of the job response times during one submission for each of the two instance types. There is little difference between the individual job response times, and thus also between the workload makespans. We have also observed a low and stable job overhead, similar to the overhead measured in Section3.3.1(not shown). We conclude that there is no visible overhead due to the execution of concurrent jobs on EC2 resources. Thus, we can use the performance results obtained from single-job benchmarks to assess the performance of workloads comprising concurrent job execution.
Early Cloud Computing EvaluationWp Wp4. Clouds vs. Other Scientific Computing Infrastructures
Table 8: The characteristics of the workload traces used in our clouds vs. grids and PPIs comparison.
Trace System
Length No.of Size Load
ID, Source Mo. Jobs Users Sites Cpus [%]
Grid Workloads Archive traces [22]
DAS-2, GWA-1 18 1.1M 333 5 0.4K 15+ RAL, GWA-6 12 0.2M 208 1 0.8K 85+ GLOW, GWA-7 3 0.2M 18 1 1.6K 60+ Grid3, GWA-8 18 1.3M 19 29 3.5K -SharcNet, GWA-10 13 1.1M 412 10 6.8K -LCG, GWA-11 1 0.2M 216 200+ 24.4K
-Parallel Workloads Archive traces [3]
CTC SP2, PWA-6 11 0.1M 679 1 430 66
SDSC SP2, PWA-21 24 0.1M 437 1 128 83
LANL O2K, PWA-22 5 0.1M 337 1 2048 64
SDSC DS, PWA-26 13 0.1M 460 1 1664 63
4
Clouds vs. Other Scientific Computing Infrastructures
In this section we present a comparison between clouds and other scientific computing infrastructures.
4.1
Method
We use trace-based simulation to compare clouds with scientific computing infrastructures. To this end, we first extract the performance characteristics from long-term workload traces of scientific computing infrastructures; we call these infrastructuressource environments. Then, we compare these characteristics with those of a cloud execution. We assume an exclusive resource use per job: for each job in the trace, the necessary resources are acquired from the cloud, then released after the job has been executed.
We define two performance models of clouds, which differ in the way they define the job runtime. Thecloud with source-like performance is a theoretical cloud environment that comprises the same resources as the source environment. In this cloud model, the runtimes of jobs executed in the cloud are equal to those recorded in the source environment’s workload traces. This model is useful for assessing the theoretical performance of future and more mature clouds, but not the real clouds whose performance is below its theoretical peak, as we have shown in Section3. Thus, we introduce theclouds with real performance mode, in which the runtimes of jobs in the cloud are extended by a factor measured in Section3. Specifically, single-processor jobs are slowed-down by a factor of 7, which is the average performance ratio between theoretical and achieved performance analyzed in Section 3.3.2, and parallel jobs are slowed-down by a factor up to 10 depending on the job size, due to the HPL performance degradation with job size described in Section3.3.3.
4.2
Experimental Setup
Performance Analysis Tools We use the Grid Workloads Archive [22] tools to extract the performance characteristics of grids and PPIs from the workload traces. We use the DGSimsimulator [24] to analyze the performance of cloud environments. We have extendedDGSimwith the models of clouds with real and source-like performance, and used the extendedDGSimto simulate the execution of real scientific computing workloads on cloud computing infrastructures.
Performance and cost metrics The performance of all environments is measured with three traditional metrics [13]: wait time (WT),response time (ReT), andbounded slowdown (BSD))–the ratio between the job response time in the real vs. an exclusively-used environment, with a bound that eliminates the bias towards
Early Cloud Computing EvaluationWp Wp4.3 Comparison Results
Table 9: The results of the comparison between workload execution in source environments (grids, PPIs, etc.) and in clouds. The “-” sign denotes missing data in the original traces.
Source env. (Grid/PPI) Cloud (real performance) Cloud (source performance)
AWT AReT ABSD AWT AReT ABSD Total Cost AWT AReT ABSD Total Cost
Trace ID [s] [s] (10s) [s] [s] (10s) [EC2-h, M] [s] [s] (10s) [EC2-h, M]
DAS-2 432 802 11.24 80 2,292 2.39 1.66 80 450 2.03 1.19 RAL 13,214 27,807 67.95 80 131,380 1.27 40.29 80 18,837 1.16 6.39 GLOW 9,162 17,643 54.51 80 59,448 1.22 3.44 80 8,561 1.15 0.60 Grid3 - 7,199 - 80 50,470 3.44 18.90 80 7,279 3.33 3.60 SharcNet 31,017 61,682 242.27 80 219,212 1.23 73.46 80 31,711 1.11 11.34 LCG - 9,011 - 80 63,158 1.11 3.39 80 9,091 1.04 0.62 CTC SP2 25,748 37,019 78.16 80 75,706 1.11 1.65 80 11,351 1.03 0.30 SDSC SP2 26,705 33,388 389.32 80 46,818 1.77 0.81 80 6,763 1.70 0.16 LANL O2K 4,658 9,594 60.82 80 37,786 1.76 1.35 80 5,016 1.55 0.26 SDSC DataStar 32,271 33,807 515.89 80 57,065 1.81 1.57 80 6,790 1.80 0.25
short jobs. The BSD is expressed as BSD = max(1, ReT /max(10, ReT −W T)), where the value 10 is the bound and eliminates the bias of all jobs with runtime at most 10 seconds. We report the average values for these metrics, AWT, AReT, and ABSD, respectively. We also report for clouds the total cost of workload execution as the number of EC2 instance hours used to complete all the jobs.
Source InfrastructuresWe use ten workload traces taken from real scientific computing infrastructures; Table 8 summarizes their characteristics. The ID of the trace indicates the system from which it was taken; see [22,3] for details about each trace. The traces Grid3 and LCG come without information about job waiting time; we make the assumption that in these large environments there are always free resources, leading to zero waiting time and favoring grids in their comparison with clouds (clouds have non-zero resource acquisition and release overheads).
4.3
Comparison Results
We compare the execution in source environments (grids, PPIs, etc.) and in clouds of the ten workload traces described in Table 8. The AWT of the cloud environments is obtained from real measurements (see Sec-tion3.3.1). Table9summarizes the results of this comparison; we comment below on two main conclusions of these experiments.
An order of magnitude better performance is needed for clouds to be useful for daily scientific computing. The performance of the cloud with real performance model is insufficient to make a strong case for clouds replacing grids and PPIs as a scientific computing infrastructure. The response time of these clouds is higher than that of the source environment by a factor of 4-10. In contrast, the response time of the clouds with source-like performance is much better, leading in general to significant gains (up to 80% faster average job response time) and at worst to 1% higher AWT (for traces of Grid3 and LCG, which are assumed to always have zero waiting time). We conclude that if clouds would offer their advertised performance, an order of magnitude higher than the performance observed in practice, they would form an attractive alternative for scientific computing, not considering costs. Looking at costs, one million EC-hours equate at current Amazon EC2 prices to $100,000; the total costs for the cloud with source performance are reasonable, considering in contrast that costs of the source environment must include among others energy, software licenses, and human resources costs (which in turn depend on the number of sites, number of resources).
Clouds are now a viable alternative for short deadlines. A low and steady job wait time leads to much lower (bounded) slow-down for any cloud model, when compared to the source environment. High and often unpredictable queue wait time is one of the major concerns in adopting shared infrastructures such as grids [17, 32]. Indeed, the ABSD observed in real grids and PPIs is for our traces between 11 and over 500!, but the ABSD values obtained for both cloud models are all below 3.5 and often below 1.5, both for systems
Early Cloud Computing EvaluationWp Wp5. How to Improve Clouds for Scientific Computing? 20 40 60 80 100 120 140 160 180 200 210 215 220 225 230
Performance of Unoptimized vs. Hand-Tuned Benchmarks [%]
Working Set [B]
unoptimized v hand-tuned (c1.xlarge x 1 process) unoptimized v hand-tuned (c1.xlarge x 2 processes) unoptimized v hand-tuned (c1.xlarge x 4 processes) unoptimized v hand-tuned (c1.xlarge x 8 processes) Optimization break-even: Unoptimized = Hand-tuned (theoretical)
Figure 11: CacheBench Wr hand-tuned benchmark results on thec1.xlargeinstance type with 1–8 processes per instance.
with low and with high utilization. Thus, when a scientific computing project wants to be fair towards its users or has a tight deadline, and can disregard the price, running jobs in a cloud is already a viable alternative.
5
How to Improve Clouds for Scientific Computing?
In this section we present two main research directions in improving the cloud computing sevices for scientific computing.
Tuning applications for virtualized resources We have shown throughout Section 3.3 that there is no “best”-performing instance type in clouds–each instance type has preferred instruction mixes and types of applications for which it behaves better than the others. Moreover, a real scientific application may exhibit unstable behavior when run on virtualized resources. Thus, the user is faced with the complex task of choosing a virtualized infrastructure and then tuning the application for it. But is it worth tuning an application for a cloud? To answer this question, we use from CacheBench the hand-tuned benchmarks to test the effect of simple, portable code optimizations such as loop unrolling etc. We use the experimental setup described in Section 3.2. Figure11depicts the performance of the memory hierarchy when performing the Wr hand-tuned then compiler-optimized benchmark of CacheBench on thec1.xlargeinstance types, with 1 up to 8 benchmark processes per instance. Up to the L1 cache size, the compiler optimizations to the unoptimized CacheBench benchmarks leads to less than 60% of the peak performance achieved when the compiler optimizes the hand-tuned benchmarks. This indicates a big performance loss when running applications on EC2, unless time is spent to optimize the applications (high roll-in costs). When the working set of the application falls between the L1 and L2 cache sizes, the performance of the hand-tuned benchmarks is still better, but with a lower margin. Finally, when the working set of the application is bigger than the L2 cache size, the performance of the hand-tuned benchmarks is lower than that of the unoptimized applications. Given the performance difference between unoptimized and hand tuned versions of the same applications, and that tuning for a virtual environment holds promise for stable performance across many physical systems,we raise as a future research problem the tuning of applications for cloud platforms.
Performance and security vs. cost Today’s clouds offer resources, but they do not offer a resource management architecture that can use these resources. Thus, the cloud adopter may use any of the resource management middleware from grids and PPIs; for a review of grid middleware we refer to our recent work [20]. We have already introduced the basic concepts of cloud resource management in Section 3.2, and explored the potential of a cloud resource management strategy (strategy S1) for which resources are acquired and released for each submitted job in Section4. This strategy has good security and resource setup flexibility, but may incur
Early Cloud Computing EvaluationWp Wp6. Related work
Table 10: The performance of the resource bulk allocation strategy (S2) relative to the resource acquisition and release per job strategy (S1).
Relative Cost Trace ID S2−S1 S1 ×100 [%] DAS-2 -30.2 RAL +1.2 GLOW +2.0 Grid3 -11.5 SharcNet +1.8 LCG -9.3 CTC SP2 -0.5 SDSC SP2 -0.9 LANL O2K -9.1 SDSC DataStar -4.4
high time and cost overheads, as resources that could be reused to run other jobs on them are immediately discarded. As an alternative, we investigate now the potential of a cloud resource management strategy in which resources are allocated in bulk for all users, and released only when there is no job to be served (strategy S2). To compare these two cloud resource management strategies we use the experimental setup described in Section 4.2; Table 10 shows the obtained results. The maximum relative cost difference between strategies is for these traces around 30% (the DAS-2 trace); in three cases around 10% of the total cost is to be gained. Given these cost differences, we raise as a future research problem optimizing the application execution as a cost-performance-security trade-off.
6
Related work
There has been a spur of research activity in assessing the performance of virtualized resources, in cloud computing environments and in general [42, 11, 34, 38, 33, 30, 41,35, 36]. In contrast to these studies, ours targets computational cloud resources for scientific computing, and is much broader in size and scope: it performs much more in-depth measurements, compares clouds with other environments based on real long-term scientific computing traces, and explores avenues for improving the current clouds for scientific computing.
Close to our work is the study of performance and cost of executing the Montage workflow on clouds [11]. The applications used in our study are closer to the mainstream HPC scientific community. Also close to our work is the seminal study of Amazon S3 [34], which also includes an evaluation of file transfer between Amazon EC2 and S3. Our work complements this study by analyzing the performance of Amazon EC2, the other major Amazon cloud service; we also use more scientific workloads, and a realistic analysis of several cost models and job execution models for the cloud. Several small-scale performance studies of Amazon EC2 have been recently conducted: the study of Amazon EC2 performance using the NPB benchmark suite [38], the early comparative study of Eucalyptus and EC2 performance [33], etc. Our performance evaluation results extend and complement these previous findings, and give more insights into the loss of performance exhibited by Amazon EC2 resources.
7
Conclusions and future work
With the emergence of cloud computing as the paradigm in which scientific computing is done exclusively on resources leased only when needed from big data centers, e-scientists are faced with a new platform option. However, the initial target workload of the cloud computing paradigm does not match the characteristics of the scientific computing workloads. Thus, in this paper we seek to answer an important question research question: Is the performance of today’s cloud computing services sufficient for scientific computing? To this
Early Cloud Computing EvaluationWp Wp7. Conclusions and future work
end, we have first performed a comprehensive performance evaluation of a large computing cloud that is already in production. Then, we have compared the performance and cost of clouds with those of scientific computing alternatives such as grids and parallel production infrastructures. Our main finding is that the performance and the reliability of the tested cloud are low. Thus, the tested cloud is insufficient for scientific computing at large, though it still appeals to the scientists that need resources immediately and temporarily. Motivated by this finding, we have analyzed how to improve the current clouds for scientific computing, and identified two research directions which hold each good potential.
We will extend this work with additional analysis of the other services offered by Amazon: Storage (S3), database (SimpleDB), queue service (SQS), and their inter-connection. We will also extend the performance evaluation results by running similar experiments on other clouds and also on other real large-scale platforms, such as grids and commodity clusters. In the long term, we intend to explore the two new research topics that we have raised in our assessment of needed cloud improvements.
Tool and Data Availability
The tools and data used in this work will be available at:
http://grenchmark.st.ewi.tudelft.nl/
Acknowledgments
Early Cloud Computing EvaluationWp WpReferences
References
[1] The Cloud Status Team . JSON report crawl, Dec. 2008. [Online]. Available: http://www.cloudstatus.com/. 9
[2] The HPCC Team . HPCChallenge results, Dec. 2008. [Online]. Available:
http://icl.cs.utk.edu/hpcc/hpcc_results.cgi. 7,14
[3] The Parallel Workloads Archive Team . The parallel workloads archive logs, Dec. 2008. [Online]. Available:
http://www.cs.huji.ac.il/labs/parallel/workload/logs.html. 6,16,17
[4] Advanced Clustering Tech. Linpack problem size analyzer, Dec 2008. [Online] Available:
http://www.advancedclustering.com/. 7
[5] Amazon Inc. Amazon Elastic Compute Cloud (Amazon EC2), Dec 2008. [Online] Available:
http://aws.amazon.com/ec2/. 4
[6] R. H. Arpaci-Dusseau, A. C. Arpaci-Dusseau, A. Vahdat, L. T. Liu, T. E. Anderson, and D. A. Patterson. The
interaction of parallel and sequential workloads on a network of workstations. In SIGMETRICS, pages 267–278,
1995. 6
[7] M. Babcock. XEN benchmarks. Tech.Rep., Aug 2007. [Online] Available: mikebabcock.ca/linux/xen/. 10
[8] P. Barham, B. Dragovic, K. Fraser, S. Hand, T. L. Harris, A. Ho, R. Neugebauer, I. Pratt, and A. Warfield. Xen
and the art of virtualization. InSOSP, pages 164–177. ACM, 2003. 5
[9] R. Bradshaw, N. Desai, T. Freeman, and K. Keahey. A scalable approach to deploying and managing appliances.
TeraGrid Conference 2007, Jun 2007. 5
[10] T. Bray. Bonnie, 1996. [Online] Available: http://www.textuality.com/bonnie/, Dec 2008. 6
[11] E. Deelman, G. Singh, M. Livny, J. B. Berriman, and J. Good. The cost of doing science on the cloud: the
Montage example. InACM/IEEE SuperComputing Conference on High Performance Networking and Computing
(SC), page 50. IEEE/ACM, 2008.4,19
[12] J. Dongarra et al. Basic linear algebra subprograms technical forum standard. Int’l. J. of High Perf. App. and
Supercomputing, 16(1):1–111, 2002. 7
[13] D. G. Feitelson, L. Rudolph, U. Schwiegelshohn, K. C. Sevcik, and P. Wong. Theory and practice in parallel job
scheduling. InProc. of the Job Scheduling Strategies for Parallel Processing, Workshop (JSSPP), volume 1291 of
Lecture Notes in Comput. Sci., pages 1–34. Springer-Verlag, 1997. 16
[14] I. T. Foster, T. Freeman, K. Keahey, D. Scheftner, B. Sotomayor, and X. Zhang. Virtual clusters for grid
com-munities. InIEEE/ACM Int’l. Symp. on Cluster Computing and the Grid (CCGrid), pages 513–520. IEEE, 2006.
5
[15] GoGrid. GoGrid cloud-server hosting, Dec 2008. [Online] Available: http://www.gogrid.com. 4
[16] D. Gupta, L. Cherkasova, R. Gardner, and A. Vahdat. Enforcing performance isolation across virtual machines in
xen. InMiddleware 2006, ACM/IFIP/USENIX 7th International Middleware Conference, Melbourne, Australia,
November 27-December 1, 2006, Proceedings, volume 4290 of Lecture Notes in Computer Science, pages 342–362.
Springer, 2006. 13
[17] A. Iosup, C. Dumitrescu, D. H. J. Epema, H. Li, and L. Wolters. How are real grids used? the analysis of four grid
traces and its implications. InIEEE/ACM Int´l. Conf. on Grid Computing (GRID), pages 262–269, 2006. 4,6,17
[18] A. Iosup and D. H. J. Epema. GrenchMark: A framework for analyzing, testing, and comparing grids. InIEEE/ACM
Int’l. Symp. on Cluster Computing and the Grid (CCGrid), pages 313–320. IEEE, 2006. 7
[19] A. Iosup, D. H. J. Epema, C. Franke, A. Papaspyrou, L. Schley, B. Song, and R. Yahyapour. On grid performance
evaluation using synthetic workloads. InProc. of the Job Scheduling Strategies for Parallel Processing, Workshop
(JSSPP), volume 4376 ofLecture Notes in Comput. Sci., pages 232–255. Springer-Verlag, 2007. 6
[20] A. Iosup, D. H. J. Epema, T. Tannenbaum, M. Farrellee, and M. Livny. Inter-operating grids through delegated
matchmaking. InACM/IEEE SuperComputing Conference on High Performance Networking and Computing (SC),
page 13. ACM, 2007. 18
[21] A. Iosup, M. Jan, O. O. Sonmez, and D. H. J. Epema. The characteristics and performance of groups of jobs in
grids. InInt’l. Euro-Par Conference on European Conference on Parallel and Distributed Computing, volume 4641
ofLecture Notes in Comput. Sci., pages 382–393. Springer-Verlag, 2007. 15
[22] A. Iosup, H. Li, M. Jan, S. Anoep, C. Dumitrescu, L. Wolters, and D. Epema. The Grid Workloads Archive.Future
Generation Comp. Syst., 24(7):672–686, 2008. 6,16,17
[23] A. Iosup, O. O. Sonmez, S. Anoep, and D. H. J. Epema. The performance of bags-of-tasks in large-scale distributed
systems. InInternational Symposium on High-Performance Distributed Computing (HPDC), pages 97–108. ACM,
Early Cloud Computing EvaluationWp WpReferences
[24] A. Iosup, O. O. Sonmez, and D. H. J. Epema. DGSim: Comparing grid resource management architectures through
trace-based simulation. InEuro-Par, volume 5168 ofLecture Notes in Comput. Sci., pages 13–25. Springer-Verlag,
2008. 16
[25] A. Kowalski. Bonnie - file system benchmarks. Tech.Rep., Jefferson Lab, Oct 2002. [Online] Available:
http://cc.jlab.org/docs/scicomp/benchmark/bonnie.html. 10
[26] U. Lublin and D. G. Feitelson. Workload on parallel supercomputers: modeling characteristics of rigid jobs.
J.Par.&Distr.Comp., 63(11):1105–1122, 2003. 4
[27] P. Luszczek, D. H. Bailey, J. Dongarra, J. Kepner, R. F. Lucas, R. Rabenseifner, and D. Takahashi. S12 - The HPC
Challenge (HPCC) benchmark suite. InACM/IEEE SuperComputing Conference on High Performance Networking
and Computing (SC), page 213. ACM, 2006. 6
[28] L. McVoy and C. Staelin. LMbench - tools for performance analysis. [Online] Available:
http://www.bitmover.com/lmbench/, Dec 2008. 6
[29] P. J. Mucci and K. S. London. Low level architectural characterization benchmarks for parallel computers. Technical
Report UT-CS-98-394, U. Tennessee, 1998. 6
[30] A. B. Nagarajan, F. Mueller, C. Engelmann, and S. L. Scott. Proactive fault tolerance for HPC with Xen
virtual-ization. InICS, pages 23–32. ACM, 2007. 19
[31] H. Nishimura, N. Maruyama, and S. Matsuoka. Virtual clusters on the fly - fast, scalable, and flexible installation. InIEEE/ACM Int’l. Symp. on Cluster Computing and the Grid (CCGrid), pages 549–556. IEEE, 2007. 5
[32] D. Nurmi, R. Wolski, and J. Brevik. Varq: virtual advance reservations for queues. InInternational Symposium on
High-Performance Distributed Computing (HPDC), pages 75–86. ACM, 2008. 17
[33] D. Nurmi, R. Wolski, C. Grzegorczyk, G. Obertelli, S. Soman, L. Youseff, and D. Zagorodnov. The
Eucalyptus open-source cloud-computing system. 2008. UCSD Tech.Rep. 2008-10. [Online] Available:
http://eucalyptus.cs.ucsb.edu/. 5,19
[34] M. R. Palankar, A. Iamnitchi, M. Ripeanu, and S. Garfinkel. Amazon S3 for science grids: a viable solution? InDADC ’08: Proceedings of the 2008 international workshop on Data-aware distributed computing, pages 55–64.
ACM, 2008.4,5,19
[35] B. Qu´etier, V. N´eri, and F. Cappello. Scalability comparison of four host virtualization tools. J. Grid Comput.,
5(1):83–98, 2007. 19
[36] N. Sotomayor, K. Keahey, and I. Foster. Overhead matters: A model for virtual resource management. InVTDC,
pages 4–11. IEEE, 2006. 19
[37] D. Thain, T. Tannenbaum, and M. Livny. Distributed computing in practice: the Condor experience.
Conc.&Comp.:Pract.&Exp., 17(2-4):323–356, 2005.5
[38] E. Walker. Benchmarking Amazon EC2 for HP Scientific Computing. Login, 33(5):18–23, Nov 2008. 4,19
[39] P. Wang, G. W. Turner, D. A. Lauer, M. Allen, S. Simms, D. Hart, M. Papakhian, and C. A. Stewart. Linpack
performance on a geographically distributed linux cluster. InIPDPS. IEEE, 2004.7
[40] J. Worringen and K. Scholtyssik. MP-MPICH: User documentation & technical notes, Jun 2002. 7
[41] L. Youseff, K. Seymour, H. You, J. Dongarra, and R. Wolski. The impact of paravirtualized memory hierarchy on
linear algebra computational kernels and software. InHPDC, pages 141–152. ACM, 2008. 19
[42] L. Youseff, R. Wolski, B. C. Gorda, and C. Krintz. Paravirtualization for hpc systems. InISPA Workshops, volume


![Table 7: The HPCC performance for various platforms. HPCC-x is the system with the HPCC ID x [2]](https://thumb-us.123doks.com/thumbv2/123dok_us/1872852.2773396/16.892.101.787.646.837/table-hpcc-performance-various-platforms-hpcc-hpcc-id.webp)
