Mining Query-Based Subnetwork Outliers in
Heterogeneous Information Networks
Honglei Zhuang
∗, Jing Zhang
†, George Brova
∗, Jie Tang
†, Hasan Cam
‡, Xifeng Yan
§, Jiawei Han
∗ ∗Department of Computer Science, University of Illinois at Urbana-Champaign†Department of Computer Science and Technology, Tsinghua University ‡US Army Research Lab
§Computer Science Department, University of California at Santa Barbara {hzhuang3, brova2, hanj}@illinois.edu, zhangjing12@mails.tsinghua.edu.cn,
jietang@tsinghua.edu.cn, hasan.cam.civ@mail.mil, xyan@cs.ucsb.edu
Abstract—Mining outliers in a heterogeneous information network is a challenging problem: It is even unclear what should be outliers in a large heterogeneous network (e.g., outliers in the entire bibliographic network consisting of authors, titles, papers and venues). In this study, we propose an interesting class of outliers,query-based subnetwork outliers: Given a heterogeneous network, a user raises a query to retrieve a set of task-relevant subnetworks, among which, subnetwork outliers are those that significantly deviate from others (e.g., outliers of author groups among those studying “topic modeling”). We formalize this prob-lem and propose a general framework, where one can query for finding subnetwork outliers with respect to different semantics. We introduce the notion of subnetwork similarity that captures the proximity between two subnetworks by their membership distributions. We propose an outlier detection algorithm to rank all the subnetworks according to their outlierness without tuning parameters. Our quantitative and qualitative experiments on both synthetic and real data sets show that the proposed method outperforms other baselines.
I. INTRODUCTION
Outlier detection [10], [2], that is, uncovering objects, data points, or vertices that significantly deviate from others, is a critical task in data mining, owing to its broad applications. With the advent of heterogeneous information networks, it is natural to examine the problem of outlier mining in such networks. Unfortunately, this is a challenging problem since it is even unclear what should be the outliers in a large heterogeneous network. For example, given a bibliographic heterogeneous network consisting of authors, papers, titles and venues, what type of entities, such as objects, relationships, or subnetworks, should be outliers? Even confining the outliers to authors, it is still unclear by which standard authors should be distinguished from others: by their coauthorship, or by the venues where they publish papers. Based on our reasoning, we believe a user is usually interested in studying and comparing subnetworks of certain properties. For example, a user may be interested in studying coauthor subnetworks for those who study “topic modeling” and finding unusual author subnet-works (i.e., outliers) that deviate substantially from others.
This leads to a new notion of outliers,query-based subnet-work outliers in a heterogeneous information network. Given such a network, a user can pose query at will to retrieve a set of task-relevant subnetworks, among which, subnetwork outliers are those that significantly deviate from others (e.g., outliers of author groups among those studying “topic modeling”).
Notice that a subnetwork outlier is different from an individual outlier. Even if every member in a subnetwork is individually normal, the subnetwork as a whole can still be an outlier. For instance, thousands of Amazon shoppers who purchase pressure cookers are not considered as outliers. However, a group of users buying pressure cookers within a short duration, sharing the same zipcode, and/or purchas-ing fertilizer simultaneously, can be suspicious (e.g., Boston Marathon bombers). Thus, mining such subnetwork outliers is a new, challenging problem with broad applications.
Figure 1 illustrates a motivating example of our research problem. Suppose we are given a heterogeneous travel net-work, which consists of numerous travelers and their booked flights and hotels. The booking relations are represented by edges in the heterogeneous network. An analyst may pose a query to check only those whose destination is Sochi (2014 Winter Olympics city), which leads to the extraction of certain flights (e.g., the red solid circle in left figure), with the results of retrieved subnetworks shown in the middle figure by blue dash circles. In the right figure, a traveler subnetwork is identified as an outlier (red solid circle), since they travel all the way together but have no traceable hotel information, which significantly distinguish themselves from other subnetworks.
The query-based subnetwork outlier detection problem in heterogeneous networks poses several unique challenges. First, we need to design a flexible interaction model for users to pose queries in order to retrieve an interesting set of subnet-works. Second, we need to formalize how to judge whether a subnetwork is an outlier subnetwork, which is a fundamentally different and more challenging problem from individual outlier detection. Third, with different queries, outliers can be defined rather differently. It is challenging to design a general algo-rithm that can adapt itself to different queries and accurately identify the outlier subnetworks.
In this paper, we formalize the query-based subnetwork outlier detection problem in a heterogeneous network; we then introduce a new notion of subnetwork similarity to measure the proximity between two subnetworks based on their mem-bership distribution; we finally propose an outlier detection method to calculate the outlierness and output a ranked list of subnetworks. Experimental results on both synthetic and real data sets show that the proposed method can outperform the baselines in terms of AUC (of ROC curves) and MAP.
Input: travel information network, query Retrieve relevant subnetworks Output: outlier subnetworks
Outlier subnetwork
Flights to Sochi
Passenger Hotel Flight
Fig. 1. Uncover potential terrorist ring by detecting subnetwork outliers in a travel information network. The left figure shows the input: a heterogeneous network containing traveler, flight and hotel information, as well as a query (find traveler subnetwork outliers flying to Sochi). The middle figure presents the candidate subnetworks, represented by blue dashed circles. The right figure illustrates a subnetwork outlier, represented by the red solid circle.
II. RELATEDWORK
Outlier detection. There has been numerous studies exploring the field of outlier detection. A number of surveys [2], [10] provide thorough summarization of existing outlier detection techniques. Network-based outlier detection is a specific type of outlier analysis. Some methods focus on detecting vertex outliers based on network structure [18], [5], [6], while others also regard the whole network as outliers [9]. Noble et al.[17] propose to discover the graph-based outliers based on minimum description length. There are studies on subnetwork outlier detection [16], [22]. However, they do not explore a query-based outlier detection scenario. Gupta et al. [8] also propose a definition of subgraph outliers in heterogeneous networks in a query-based framework, where queries can only extract isomorphic subgraphs. The query-based framework proposed in this paper is more flexible.
Network similarity. There are many different similarity or distance functions to measure the proximity of two vertices in a network. Jeh et al.[11] propose SimRank to recursively define a similarity measure for two vertices in a network. Similar ways to define a similarity include [14] and [12]. Sun et al. [19] propose PathSim for vertices in a heterogeneous information network. Some other vertex similarity measures are summarized in [13]. But it is not straightforward to extend vertex similarity measures to subnetwork similarity measures. There are also several attempts to develop similarity mea-sures that are capable of measuring network proximity. Eiteret al.[3] propose several distance measures for sets of points but not vertices in networks. Tong et al. [21] defines a group-to-group proximity but in a homogeneous network.
III. OVERVIEW
A. Concepts and Notations
We start with recalling the concept of a heterogeneous information network.
Definition 1: Heterogeneous information network. A heterogeneous information network is an information network with multiple types of vertices. Without loss of generality, it can be defined as a directed network G= (V, E;φ,A)where
V is the set of vertices, and E is the set of edges. There is a vertex/edge type mapping function φ :V → A or E → A
where A is the set of types, i.e. each vertex v ∈ V or edge e∈Ebelongs to a particular type inA. For undirected cases, an undirected edge can be viewed as two symmetric directed edges. When there is only one type, i.e.|A|= 1, the network reduces to a homogeneous information network.
A typical example is a bibliographic information network, with four types of vertices: paper (P), venue (V), author (A), and term (T). Directed edges can be defined between different types of vertices according to their relationships.
Definition 2: Meta-path. In a heterogeneous network G, a meta-path is an ordered sequence of vertex types, denoted by P= (T1T2. . . Tl), where Tx∈ A. We say an instantiation
of P is a path in G, denoted by p= (v1v2. . . vl), satisfying
φ(vx) = Tx,∀x= 1,2, . . . , l. In addition, we denote the set
of all the path instances instantiated by meta-path P between vertices vi andvj as πP(vi, vj).
B. Problem Definition
We define our research problem of query-based subnetwork outlier detection, and describe how can we specify a query and retrieve relevant subnetworks.
Problem 1: Subnetwork outlier detection. Given a het-erogeneous information networkG= (V, E;φ,A)and a query q, where φ: V → A specifies the type of each vertex. Our objective is to identify a set of outlier subnetworksSω⊂ S(q),
whereS(q)is the set of subnetworks{Si ⊂ V}i=1,...,krelevant
to q; and the subnetworks in Sω significantly deviate from
subnetworks in S(q)\ Sω.
Query definition and execution. We introduce a simple but effective definition. A query consists of 1) Vq ⊂ V as a set of
queried vertices; 2)TS ∈ Awhich indicates the vertex type of
desired subnetworks; 3) meta-path PQ andPS. PQ is given
to specify the semantics of query vertices, andPS is given to
specify the semantics of candidate vertices. For example, if one wants to find author subnetworks relevant to venue “KDD”, where venues and authors can be characterized by papers, a query can be formed as q= (Vq ={“KDD”}, TS =A,PQ=
(V P),PS = (AP))
We retrieve subnetworks by finding any groups of vertices that are both mutually highly connected as well as highly connected to the query vertices. To be concrete, we denote
the set of vertices reachable from vi via paths instantiated by
meta-pathP as νP(vi) ={vj|πP(vi, vj)6=∅}. We extract all
the subnetworks S satisfying \ u∈Vq νPQ(u) \ v∈S νPS(v) ≥θ
where θ is a given threshold. We also remove all the sub-networks that are a proper subset of any other retrieved subnetworks from the results. Thereby we obtain a set of subnetworks relevant to query q, denoted by S(q).
In practice, this simple methodology can easily generate reasonable subnetworks relevant to the given query. Some of the results can be seen in Table II. Other methods for retrieving relevant subnetworks from a query [7] can be easily plugged in our framework without much modification.
IV. SUBNETWORKSIMILARITY
In this section, we introduce a subnetwork similarity mea-sure to examine the similarity between two subnetworks in heterogeneous networks. The intuition is, for two subnetworks, if they are composed of members from similar communities and with similar authorities, they should be regarded as similar regardless of their network size.
Balance mapping similarity (BMSim). We define the bal-ance mapping similarity between two subnetworksS1andS2.
We first construct a bipartite with vertices in S1 andS2 and
edges between every pair of vi1 ∈S1 and v
j
2 ∈ S2 weighted
by a certain vertex similarity of v1 andv2 in the originalG.
Here we employ PathSim [19], which is defined as: P athSimP(vi, vj) =
2|πP(vi, vj)|
|πP(vi, vi)|+|πP(vj, vj)|
(1) Without loss of generality, we assume|S1| ≥ |S2|. We try
to map each member of S1 to a similar member in S2, while
trying to keep the frequency of members inS2 being mapped
as balanced as possible. To be concrete, we define a balance mapping betweenS1andS2as a set of vertex pairsM ⊂S1×
S2, which satisfies that ∀v1i ∈ S1,
{v i 1|(v1i, v j 2)∈M} = 1, and ∀v2j ∈S2, 1≤ {v j 2|(vi1, v j 2)∈M} <1 + |S1| |S2|,i.e. each
vertex in S1must be mapped to exactly one vertex inS2, and
each vertex in S2 has to be connected to at least one but no
more than a certain upper limit number of vertices inS1. The
similarity is measured by the optimal balance mapping M∗ with the maximum sum of edge weights, normalized by the cardinality ofS1: σBM(S1, S2) = 1 |S1| max M X (xi,yj)∈M P athSim(v1i, vj2) (2) whereMis a balance mapping satisfying the conditions above. To obtain the maximum weighted balance mapping, it is straightforward to convert this formulation into a minimum cost maximum flow problem by constructing a network flow graph, and solved in polynomial time [3].
Comparison with existing measures. We compare the sim-ilarity measure to other existing measures. A simple strategy to calculate subnetwork similarity, called Average Subnetwork Similarity (AvgSim), simply takes the average similarity over
v1 1 v1 2 v2 1 v22 S1 S2 AvgSim 0.5 MatchSim 1.0 BMSim 1.0 (a) v1 1 v1 4 v2 1 v2 2 S1 S2 v1 2 v1 3 AvgSim 0.5 MatchSim 0.5 BMSim 1.0 (b) v1 1 v1 4 v2 1 v2 3 S1 S2 v1 2 v1 3 AvgSim 0.375 MatchSim 0.5 BMSim 0.5 v2 2 v2 4 (c) Fig. 2. Comparing different similarity measures.
all the pairs of vertices from S1 and S2 respectively. More
precisely, σAvg(S1, S2) = P vi 1∈S1,v2j∈S2 P athSim(vi 1, v j 2) |S1| × |S2| (3) Another subnetwork similarity that can be employed is Maximum Matching Similarity (MatchSim), adapted from [14]1. It is calculated by finding a maximum weighted matching in a bipartite constructed in a similar way to BMSim, where a matching between S1 and S2 is defined as a set of
pairs of vertices from each subnetwork without intersecting vertices. More precisely,
σM atch(S1, S2) = 1 |S1| max M0 X (xi,yj)∈M0 P athSim(vi1, v2j) (4) whereM0 is a matching betweenS1 andS2.
In Figure 2, we show several examples to compare all the similarity measures above. Suppose each circle represents a type of vertex (denoted as A), and each triangle represents another type of vertex (denoted as B). We use the meta-path ABA to calculate the PathSim between vertex pairs of type A. In Figure 2(a), vertices in both subnetworks share the same neighborhood, and therefore S1 andS2 should be considered
identical. However, AvgSim compares every possible pair of vertices and yields a similarity of 0.5, which violates our intuition. In Figure 2(b), subnetworkS1 is larger thanS2, but
its membership distribution is still identical to S2. However,
MatchSim yields the similarity of 0.5, which also violates our intuition. In Figure 2(c), the two subnetworks have totally different membership distributions. Thus BMSim is calculated as 0.5, which correctly reflects our intuition.
V. RANKINGOUTLIERSUBNETWORKS
In this section, we introduce an algorithm to rank all the subnetworks in S(q) by their outlierness. The basic idea follows the clustering-based outlier detection philosophy, i.e.trying to cluster all the subnetworks, and those subnetworks that are less similar to any clusters have higher outlierness. The algorithm is summarized in Algorithm 1.
The clustering algorithm is similar to affinity propaga-tion [4], but with multiple similarity measures. Suppose there 1Note the original paper does not use PathSim, and cannot be directly
applied on heterogeneous networks. We make some slight modifications to the original MatchSim formalization.
δ
1δ
2δ
31(1, )
σ ⋅ σ2(1, )⋅ σ1(2, )⋅ σ2(2, )⋅ σ1(3, )⋅ σ2(3, )⋅
Y1 Y2 Y3
Fig. 3. An example graphical representation of the factor graph model. Random variablesYi are represented by circles; constraint functionδi(Y)
and similarity measureσm(i,·)are represented by squares.
are in totalksubnetworksS1, . . . , Sk as input. Based onµ
pre-defined different types of meta-paths, we can calculate µ dif-ferent similarity measures between subnetworks, represented by σ1(Si, Sj), . . . , σµ(Si, Sj). We use random variable Yi to
represent whether subnetwork Si is an outlier or belongs to
a cluster represented by a “representative subnetwork”. Each Yi can take a value yi from {0,1, . . . , k}, where yi = 0
represents that Si is an outlier subnetwork, and 1 ≤yi ≤k
indicates the index of the “representative subnetwork” of the cluster it belongs to. We denote the vector(Y1, . . . , Yk)asY.
Our objective is to find a configuration for Y such that the following objective function can be maximized:
O(Y,w) = k Y i=1 exp " µ X m=1 wβmσm(i, Yi) # (5) with the constraint that
∀i:Yi=j=⇒Yj=j and µ
X
m=1
wm= 1
i.e.if any subnetworkSjis identified by other subnetwork as a
representative, it cannot recognize other subnetworks but itself as its representative. Notice that there are two special cases in the similarity functionσm(·,·). First,σm(i, i)should be used
to indicate how well a subnetwork serves as a representative subnetwork. Without any prior knowledge, we can simply set all the σm(i, i) as the average value of elements of σm(i, j)
where i 6=j and (1 ≤i, j ≤k). Second, σj(i,0) should be
defined as a threshold similarity to determine outliers. w = (w1, . . . , wµ)is a weighting vector to leverage the importance
of different similarity measures, with a given factor0< β <1
indicating the discrimination extent of the weighting vector. Similar formalization is also used in [1].
We take the logarithm of the objective function, and combine the first constraint into the objective function:
logO(Y,w) =X i δi(Y) + X i X m wmβσm(i, Yi)
where δi(Y) = −∞ when there exists Yj = i and Yi 6=
i; otherwise δi(Y) = 0. Thereby we can construct a factor
graph model to optimize the objective function. An example is illustrated in Figure 3 (k= 3, µ= 2).
To maximize the objective function with respect to the given constraints, we optimize parameter w and Y respec-tively. At each iteration, we first hold the value of w and optimize Y, then keep the configuration of Y fixed and optimize w.
InferringY. We use a loopy belief propagation similar to [4] to optimize Y. We denote messages sent from Yi to Yj as
ri→j and messages sent from Yj toYi as ai←j. In addition,
we need to introduce an auxiliary nodeY0. Messages sending
fromYitoY0are denoted byri→0and messages received byYi
fromY0areai←0. All the random variables sendri→jto other
variables and receiveai←jfrom other variables iteratively until
the objective function converges. The updating rules can be written as: ri→j= X m wβmσm(i, j)−max j06=j " X m wmβσm(i, j0) +ai←j0 # ai←j= 0, j= 0 P i06=imax (0, ri0→j), j=i minh0, rj→j+Pi0∈{/ i,j}max (0, ri0→j)
i
, 0< j6=i
After the updating process converges, we can determine the optimal configuration for∀i >0 by:
ˆ Yi= arg max yi " ai←j+ X m wβmσm(i, yi) # = 0, maxj6=0ai←j+Pmwmβσm(i, j)<Pmwmβσm(i,0); i, i= arg maxj ai←j+Pmw β mσm(i, j) ; arg max j0: ˆY j0=j0 ai←j0+P mw β mσm(i, j0) ,otherwise. i.e. we first determine all the outlier subnetworks with Yˆi =
0; then we determine all the representative subnetworks with
ˆ
Yi=i; we finally assign the representative subnetwork for the
rest subnetworks by the last equation above.
Learningw. The second step is to learn the weighting vector w for different similarity measures derived from different meta-paths. We aim to find configuration of w to maximize the objective function, while holding the configuration of Y. Omitting the delta function since at this step the first constraint is always satisfied. By using a Lagrange multiplier, the optimal weights can be updated by:
wm= [P iσm(Si, Yi)] 1 1−β P m0[Piσm0(Si, Yi)] 1 1−β (6) We iteratively update the configurationYand weighting vector w till the objective function converges.
To rank the outlier subnetworks, since we judge whether a subnetwork is an outlier subnetwork by P
mwβmσm(i,0)−
maxj6=0ai←j+Pmwmβσm(i, j), and Pmwβmσm(i,0)
re-mains the same for all the subnetworks when we have no prior knowledge, we can calculate the “outlierness” as:
Ω(Si) =−max j6=0 " ai←j+ X m wβmσm(i, j) # (7) By ranking subnetwork Si with respect to Ω(Si), we can
output the desired ranked list of outliers. VI. EXPERIMENTS
To validate the effectiveness of our proposed framework on outlier subnetwork detection, we apply our method on a synthetic data set and several real data sets.
Input:G,S ={Si}i=1,...,k,{Pm}m=1,...,µ,β Output: Outlierness for allΩ(Si)
// Calculate similarity measures; 1 forall thePm do
2 forall theSi, Sj∈ S do
3 Calculateσm(Si, Sj)according to Equation (2); // Calculate outlierness scores;
4 wm←1/µ,∀m= 1, . . . , µ; 5 ai←j= 0,∀1≤i, j≤k ; 6 repeat 7 repeat 8 Updateri→j,∀1≤i≤k,0≤j≤k; 9 Updateai←j,∀1≤i≤k,0≤j≤k; 10 untilconverged; 11 EstimateYˆi,∀1≤i≤k; 12 Updatewm,∀m= 1, . . . , µ; 13 untilconverged; 14 CalculateΩ(Si),∀1≤i≤k;
Algorithm 1:Calculate outlierness for subnetworks.
A. Data Sets
We employ a synthetic data set and two real data sets in our experiments.
Synthetic. We first generate a synthetic network by a graph partition model [15] with slight modification. There are n vertices in the vertex set V. There is a coloring assignment function ψ : V → 2C \ ∅ to assign each vertex a coloring. A vertex vi is also associated with a type denoted by φ(vi).
For any two verticesvi, vj∈ V, we generate an edge between
them with probabilitypifψ(vi)∩ψ(vj)6=∅; otherwise with
probabilityqp. In our experiments, we setnas1,000,|C|
as 3 and |A| as 2. We also setp= 0.1 and q = 0.001. The functionψ andφfor each vertex is randomly determined.
Bibliography. We use a bibliographic heterogeneous infor-mation network data generated from ArnetMiner2 [20]. It has
2,244,018 publications and 1,274,360 authors in different fields of computer science. We construct the network by intro-ducing four different types of vertices, corresponding to papers (P), authors (A), venues (V), and terms (T) respectively. The edges involved include paper-author (written-by), paper-venue (published-in) and paper-terms (title-containing).
Patent. We collect a subset of US patents data3. The data set consists of 1,000,000 patents, with 970,869 inventors and 96,161 assignees (companies). There are 6 types of vertices: patent (P), inventor (I), assignee (A), term (T), keyword (K), and class (C). Each patent can be associated with several inventors, a few assignees, several terms in its title, some keywords, and a set of classes.
B. Experiment Setup
Comparison methods. There are several baseline methods we can compare with.
• Individual (Ind). We perform our proposed algorithm on individual vertices with the PathSim similarity measure and calculate the subnetwork outlierness as the average of members’ outlierness scores.
2http://arnetminer.org/AMinerNetwork
3http://www.uspto.gov/patents/resources/classification/index.jsp
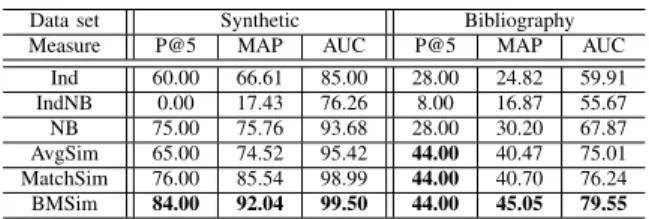
TABLE I. PERFORMANCE COMPARISON(%).
Data set Synthetic Bibliography
Measure P@5 MAP AUC P@5 MAP AUC
Ind 60.00 66.61 85.00 28.00 24.82 59.91 IndNB 0.00 17.43 76.26 8.00 16.87 55.67 NB 75.00 75.76 93.68 28.00 30.20 67.87 AvgSim 65.00 74.52 95.42 44.00 40.47 75.01 MatchSim 76.00 85.54 98.99 44.00 40.70 76.24 BMSim 84.00 92.04 99.50 44.00 45.05 79.55
• Neighborhood-based (NB).An alternative way to find outlier subnetworks is to use a topic-model-like al-gorithm by inserting an additional “outlier” topic [5]. By regarding each subnetwork as a document and the neighbors of vertices in the subnetwork as words, we can estimate the probability of a subnetwork belonging to the “outlier” topic as its outlierness.
• Individual Neighborhood-based (IndNB).We perform the neighborhood-based method on individual vertices and use the average of outlierness scores of subnet-work members as subnetsubnet-work outlierness.
We can also plug in different similarity measures into the σj(·,·)function in our proposed ranking algorithm, and check
which similarity measure is performs better.
• BMSim.Our proposed similarity in Equation (2).
• AvgSim. Similarity measure replaced by AvgSim de-fined by in Equation (3).
• MatchSim. Similarity measure replaced by Match-Sim [14] defined in Equation (4).
Settings. In Synthetic data set, we set A = {A, B}. For each query, we directly select 100 subnetworks consisting of typeAvertices. Among these subnetworks,95%are generated by drawing vertices from a “normal” coloring distribution, while another 5% are generated from an “outlier” coloring distribution. We generate 5 different sets of subnetworks for Synthetic data set. We use meta-path ABA to calculate the similarity in our experiments.
In Bibliography data set, we raise five queries q, sharing the same TS = A, the same PS = (AP) and the same
PQ= (T P), but with different keywordsVq. We use “frequent
pattern mining”, “topic model”, “social influence”, “named entity recognition”, and “transfer learning” in our experiments. We choose 4 types of meta-paths to calculate the similarity: AP A,AP AP A,AP V P A, andAP T P A.
In Patent data set, we aim to find outlier subnetworks of assignees (companies), while querying by terms. We tried a list of queries withPS= (AP I)andPQ= (T P I). We use
meta-pathsAP IP A,AP T P A,AP AP A,AP KP A, andAP CP A to calculate the subnetwork similarity.
For all the data sets, β is set to 0.5. For real data sets, we pick the largest threshold θ that guarantees more than 50 subnetworks can be retrieved.
Evaluation. For Synthetic data set, since we manually insert outliers into the data set, the ground-truth is known. For Bibli-ography data set, we are able to label the outlier subnetworks. We evaluate our outlier ranking results by the mean average precision (MAP), and area under the ROC curve (AUC).
TABLE II. CASE STUDY RESULTS. THE LEFT COLUMN SHOWS THE OUTLIER SUBNETWORKS RANKED AS TOP-5BY THE PROPOSED METHOD BUT NOT BY THE BASELINE;THE RIGHT COLUMN SHOWS THE OUTLIER SUBNETWORKS RANKED AS TOP-5BY THE BASELINE BUT NOT BY THE PROPOSED METHOD.
Data set / Query Comparing results
Bibliography / “topic model”
Sω
BM Sim\ SIndω SωInd\ SωBM Sim Ankur Moitra; Sanjeev Arora; Rong Ge Khoat Than; Tu Bao Ho
They have many theoretical papers in STOC, FOCS, etc. They are interested in machine learning and data mining. Andrea Tagarelli; Giovanni Ponti Zhongzhi Shi; Huifang Ma; Zhixin Li
Giovanni Ponti is interested in economics. They are interested in machine learning, neural computing and data mining.
Patent / “rechargeable battery” Sω BM Sim\ S ω N B S ω N B\ S ω BM Sim LSI Logic Corporation; Symbios Logic Inc. Eltech Systems Corporation; Diamond Shamrock LSI designs semiconductors and software to accelerate storage;
Sym-bios is a manufacturer of storage systems.
Eltech provides solutions for electrochemical industries; Diamond Shamrock produces basic chemical products.
Advanced Technology; Teledyne Industries, Inc. Oronzio de Nora; Diamond Shamrock Advanced Technology is an environmental technology company;
Teledyne produces digital imaging and engineered systems.
Oronzio de Nora is a provider of electrochemical technologies; Diamond Shamrock produces basic chemical products.
C. Experimental Results
Performance comparison. Table I shows a comparison for different methods in terms of their average performance over multiple queries in both Synthetic and Bibliography data sets. Our proposed method outperforms other baselines in both data sets. In Synthetic data set, our proposed approach achieves almost perfect performance (> 99% in AUC and >90% in MAP), while the two baselines based on individual outlier de-tection (Ind and IndNB) achieve relatively poor performance. This verifies our claim that subnetwork outlier detection is a problem more challenging than individual outlier detection and cannot directly be solved by traditional methods. The results on Bibliography data set also show that our proposed method outperforms the baselines, with a fairly high performance (about 80%in AUC and 45% in MAP).
Case study. We conduct a case study to compare our method with several baseline methods on different data sets (Cf. Ta-ble II). In Bibliography data set, we compare BMSim with Ind baseline on a selected query. We find that our method is able to find interesting outlier subnetworks such as a theory research group (Moitra et al.) publishing papers about “topic model”, which is very different from other retrieved subnetworks from data mining or machine learning areas. However, the results returned by Ind baseline is not satisfying. For Patent data set, we compare BMSim with the NB baseline. It shows that NB prioritizes a subnetwork of electrochemical companies, which is fairly normal for the query “rechargeable battery”. This is probably because NB fails to characterize “normal stereotype” of subnetworks when there are many big companies with a great variety of business involved (Hitachi, Mitsubishi,etc.), as they introduce significant noise. In comparison, our proposed method can still tell interesting outliers (e.g.LSI and Symbios).
VII. CONCLUSION
In this work, we present a novel problem of query-based subnetwork outlier detection in a heterogeneous information network. We design a similarity measure which can capture the proximity between membership distributions of two sub-networks and propose a novel outlier detection method to rank the subnetworks by their outlierness. The subnetwork outlier detection can trigger various applications, such as identification of gangs of terrorists hidden in a large social network. Also, it is worth exploring several extensions of this problem, e.g.to apply the algorithm on dynamic heterogeneous networks.
Acknowledgements. Research was sponsored in part by the Army Research Lab. under Cooperative Agreement No. W911NF-09-2-0053 (NSCTA) and W911NF-11-2-0086, the Army Research Office under Cooperative Agreement No. W911NF-13-1-0193, National Science Foundation IIS-1017362, IIS-1320617, and IIS-1354329, HDTRA1-10-1-0120, and MIAS, a DHS-IDS Center for Multimodal Information Access and Synthesis at UIUC. Jie Tang and Jing Zhang are supported by the National High-tech R&D Program (No. 2014AA015103) and Natural Science Foundation of China (No. 61222212).
REFERENCES
[1] C. Biernacki, G. Celeux, and G. Govaert. Assessing a mixture model for clustering with the integrated completed likelihood.IEEE Transactions on Pattern Analysis and Machine Intelligence, 22(7):719–725, 2000. [2] V. Chandola, A. Banerjee, and V. Kumar. Anomaly detection: A survey.
ACM Computing Surveys, 41(3):15:1–15:58, 2009.
[3] T. Eiter and H. Mannila. Distance measures for point sets and their computation. Acta Informatica, 34(2):109–133, 1997.
[4] B. J. Frey and D. Dueck. Clustering by passing messages between data points. Science, 315(5814):972–976, 2007.
[5] J. Gao, F. Liang, W. Fan, C. Wang, Y. Sun, and J. Han. On community outliers and their efficient detection in information networks. InKDD, pages 813–822, 2010.
[6] M. Gupta, J. Gao, Y. Sun, and J. Han. Integrating community matching and outlier detection for mining evolutionary community outliers. In KDD, pages 859–867, 2012.
[7] M. Gupta, J. Gao, X. Yan, H. Cam, and J. Han. Top-k interesting subgraph discovery in information networks. InICDE, 2014. [8] M. Gupta, A. Mallya, S. Roy, J. H. Cho, and J. Han. Local learning
for mining outlier subgraphs from network datasets. InSDM, 2014. [9] S. Hirose, K. Yamanishi, T. Nakata, and R. Fujimaki. Network anomaly
detection based on eigen equation compression. InKDD, pages 1185– 1194, 2009.
[10] V. J. Hodge and J. Austin. A survey of outlier detection methodologies. Artificial Intelligence Review, 22(2):85–126, 2004.
[11] G. Jeh and J. Widom. Simrank: a measure of structural-context similarity. InKDD, pages 538–543, 2002.
[12] R. Jin, V. E. Lee, and H. Hong. Axiomatic ranking of network role similarity. InKDD, pages 922–930, 2011.
[13] D. Liben-Nowell and J. M. Kleinberg. The link-prediction problem for social networks. JASIST, 58(7):1019–1031, 2007.
[14] Z. Lin, M. R. Lyu, and I. King. Matchsim: a novel neighbor-based similarity measure with maximum neighborhood matching. InCIKM, pages 1613–1616, 2009.
[15] F. McSherry. Spectral partitioning of random graphs. InFOCS, pages 529–537, 2001.
[16] M. Mongiovi, P. Bogdanov, and R. Ranca. Netspot: Spotting significant anomalous regions on dynamic networks. InSDM, 2013.
[17] C. C. Noble and D. J. Cook. Graph-based anomaly detection. InKDD, pages 631–636, 2003.
[18] J. Sun, H. Qu, D. Chakrabarti, and C. Faloutsos. Neighborhood formation and anomaly detection in bipartite graphs. InICDM, pages 418–425, 2005.
[19] Y. Sun, J. Han, X. Yan, P. S. Yu, and T. Wu. Pathsim: Meta path-based top-k similarity search in heterogeneous information networks. InVLDB, pages 992–1003, 2011.
[20] J. Tang, J. Zhang, L. Yao, J. Li, L. Zhang, and Z. Su. Arnetminer: Extraction and mining of academic social networks. In KDD, pages 990–998, 2008.
[21] H. Tong, C. Faloutsos, and Y. Koren. Fast direction-aware proximity for graph mining. InKDD, pages 747–756, 2007.
[22] R. Yu, X. He, and Y. Liu. Glad: group anomaly detection in social media analysis. InKDD, pages 372–381, 2014.