The Study of Inflation in Algeria: An ARDL Testing Approach
Ahmed SmahiDepartment of Economics, Tlemcen University, Algeria
Abstract
It is recognized that inflation is one of most misunderstood economic phenomena. Indeed, it is a persistent increase in general price level both of goods and services in an economy over a period of time, which affect necessarily the purchasing power or a loss in the real value of the money. Therefore, in many countries, controlling inflation has been a high priority, especially those with small open economies since the early 1970s when oil prices soared to record high levels.In Algeria, inflation appears as a first challenge for recent economic performance. This study examines the main determinants of inflation in Algeria using the ARDL model during the period 1980-2016. In this context, this paper focuses on the major sources to explain inflation trend in Algeria (imports price, oil price and money stock, government expenditure and effective nominal exchange rates of the Algerian Dinar). However, our results based on ARDL model establish that a stable long-run relationship exists between inflation and its determinants. Thus, in the short run, only external factors (imports price, oil price and effective and nominal exchange rates) impact inflation in Algeria. Consequently, we may infer, as far as the impact on inflation is concerned, that fiscal and monetary policies cannot on their own be statistically significant.
Keywords: inflation, fiscal and monetary policies, imports price, exchange rate, ARDL Model.
1. Introduction
Despite the launch of pertinent Economic reforms and the implementation of structural Adjustment Program during the 1990s which was adopted by the Algerian government in cooperation with the International Monetary Fund (FMI) and the World Bank (WB), inflation in Algeria has been growing rapidly with an average rate of 18.55% see (Figure 1). In the beginning of the 90’s the rate was very high, but it lessened in the second decade (2000s) with an average rate of 3.2 %. The persistence of a low level inflation rate in this period has been associated with the raise of oil revenues that constitute the dominant income of the Algerian economy. This sector accounted for 97% of exports between 2002 and 2011, and 32 to 45 percent of GDP. Its impact on government revenue varied between 46 to 70 percent. Moreover, trade openness exhibits a high percentage with more than 60% in the same period (table 01). After the end of the first decade of the new millennium and the beginning of the second decade, the inflation rate started to increase to some worrying levels 6 to 8.5 percent; furthermore, from 2010 onwards fiscal and monetary policies seem to be blamed so as to be considered as important determinants of inflation.
Hitherto, this study examines the most important determinants of inflation in Algeria by applying the Auto Regressive Distributed Lag model (ARDL) during the period 1980-2012. Results of the estimation lead us to conclude that a stable long-run relationship exists between inflation and its determinants ((imports price, oil price and effective nominal exchange rates).
The rest of the paper is organized as follows. In section 2 we present a short Literature Review, followed in Section 3 by the presentation of the Model as well as the Methodology. Section 4 shows the results and the discussion.
2. Literature Review
During the last three decades, many authors investigated theoretically and empirically the relationship between inflation and economy growth. Baroo (1991)studied the relationship between inflation and economic growth using a cross-sectional analysis from1960 -1990 for around 100 countries. His results show a causal influence of inflation on growth. Conversely, Bruno and Easterly (1998)carried out a similar analysis and found out the inexistence of a long-run relationship between inflation and growth. Burdekin et al (1994), Gosh and Phillips (1998), and Khan and Senhadji (2001) confirm the negative relationship between inflation and growth. Nicholas M. Odhiambo (2012) examined the short-run and long-run causal relationship between inflation, investment and economic growth in Tanzania using the ARDL-bounds testing approach. This study finds a unidirectional causal flow from inflation to economic growth with no inverse relationship.
Several previous studies focused their analyses on the oil-producing countries. Klein and Kyei (2009) using a Vector Error Correction (VEC) model show that excess liquidity and exchange rate movements drive inflation in Angola. For the oil-rich Gulf Cooperation Council (GCC), Kandil and Morsy (2011) concluded that the following variables may explain inflation: inflation in trading partners as well as growth of credit and aggregate spending credit and aggregate spending
Ibrahim A. O and Akinwande A, (2010) analyzed the inter-relationship between inflation and its determinants in Nigeria between 1970 and 2007. Results of the Error Correction Mechanism (ECM) model for the short-run and the Augmented Engle Granger (AEG) cointegration test for the long run, establish a
relationship between inflation and its determinants such as Growth of Gross Domestic Product (GDP), Growth of Money supply(M2), Fiscal deficit as percentage of GDP, Import as a percentage of GDP, Exchange rate(U.S dollar to Naira), and interest rate.
Huang et al (2010)investigated what determine china’s inflation. Results of their estimation demonstrate that excess liquidity, output gap, housing price, and stock price positively affect inflation. On the Contrary, exchange rate and interest rate have a week effect on china’s inflation. Using a SVAR model baumeister et al (2008) observed that excess liquidity can impact inflation.
In the USA, early studies using different types of empirical methods examined the determinants of inflation. King and Plosser (1985) established a causal relationship between budget deficit and inflation. The same results by Montiel (1989)put the emphasis on fiscal policy and budget deficit as determinants of inflation in industrialized countries, and in developing countries by Dornbusch et al. (1990)as well asClick (1998).
Hofmann (2008)concludes that monetary indicators explain Euro inflation since the start of EMU over the period: first quarter 1999 till third quarter 2006. Antonio Rua (2012) confirmed Hofmann’s results by establishing a relationship between money growth and inflation in the euro area over the last 40 years.
Khan and Axel (2006) study finds that the private sector and growth of money supply (M2) are the most important determinants of inflation in Pakistan using monthly data from January 1998 to June 2005. Abdul A , Syed Kalim and Qazi M Ahmed (2007 )using data from the 1972-73 to 2005-06 period for same country, and applying ordinary least square method and verifying results through Breusch-Godfrey Serial Correlation LM confirm the role of credit and rising import prices and fiscal policies as significant causes of inflation.
Mehdi S and Seyed Y.A (2013) examined the effects of money (M2) on inflation in Iran by vector error correction model (VECM) between 1988Q1 and 2005Q4. Results of their estimation exhibit a long-run excess supply of money lead to inflation. Bonato (2007) finds a strong relation between money and inflation in Iran. Also VECM approaches used in different countries allow to detect the effect of growth of money on inflation, (see: Budina (2002) for Romany, Lim and Papi (1997) and Yamak (1998)for Turkey and Cheng (2002) for Malaysia). Mohsen Bahmani A, and Dan Xi (2012) used the bounds-testing approach to cointegration and error-correction modeling in 17 countries. The results reveal that in 12 of the countries, exchange rate volatility has short-run effects on consumption. Long-run effects are observed in only 9 countries. For CEMAC members (Central African Economic and Monetary Community) and using cointegrated VAR model,Carlos C, Marcos P, and Darlena T (2011) found out that imported commodity price are significant in explaining the inflation.
Kinda (2011) and Loening et al (2009) show that External Factors (agricultural shocks, exchange rate, and foreign prices) affect inflation in Ethiopia. Diop, Pedersen (2010), Habermeier et al (2009), Dufrénot et Sanon (2008) and Cecchetti and Moessner (2008) found in several countries that manufactured goods such as food and oil prices are the main drivers of inflation.
Arize et al.(2004)found that nominal exchange-rate variability can have a positive and significant effect on the variability of inflation for 82 countries over the 1973Q2–1998Q1 period.
3. Model and Methodology
We shall present our data sources then the econometric approach
3.1. Data sources
The sample comprises 33 annual observations for the period 1980 - 2012.The sources of our variables are collected from different issues of International financial Statistics, world development indicators and the Bank of Algeria.
3.2. Econometric approach
The ARDL model is used to analyze cointegration series for long-run and short-run dynamics, even when the time-series are stationary I(0) or integrated of order I(1). The variables may include a mixture of stationary and non-stationary time-series for ARDL Bounds testing approach proposed by Pesaran (1997), Pesaran, Smith and Shin (2001) and Pesaran et al. (2001). In addition, the bounds testing procedure (Pesaran et al., 2001) proposed in this study is robust for small sample (Abd Pattichis, 1999; Mah, 2000; and Tang and Nair, 2002, Halim et al 2006). Our variables are INF, INFt-1, G, M2, OIL, IMP and EX representing Inflation rate, first inflation lag, public Expenditure as Percentage of GDP, Growth rate of Money supply (M2), oil prices, Imports, effective Exchange rate.
The mathematical representation of an ARDL regression model is:
Inft = β0 + β1inft-1 + ....+ βkinft-p + αG0t + α1Gt-1 + α2M2t-2 + α3oilt-3+ α4impt-4+ α5et-5 +εt… (1)
Where:
εt is a random "disturbance" term. β0= Intercept of the function
β1, α0, α1, α2, α3, α4, α5 are parameter estimates.
Test of the time series data by Augmented Dickey-Fuller & Philips-Perron and we proceed to determine the F-test for ARDL Model.
4. Results and discussion
Before estimating the ARDL bounds approach, we use the Augmented Dickey-Fuller (1979, 1981) and Phillips and Perron, (1988) tests for stationary and non-stationary time-series. The results are represented in
table (2) showing that all variables are integrated of order one (I (1)) except the exchange rate and Growth rate of Money supply (M2) when the variables are stationary (I (0)).
In order to determine the long-run relationship between inflation and its determinants by applying the ARDL Model, we compute the F-statistic compared with the critical value tabulated by Pesaran et al. (2001) at the 5 percent level. On this basis , we reject the null hypothesis and accept the alternative hypothesis (existence of cointegration relations). Our results of this comparison are represented in table (3) that means that a long-run relationship can be confirmed.
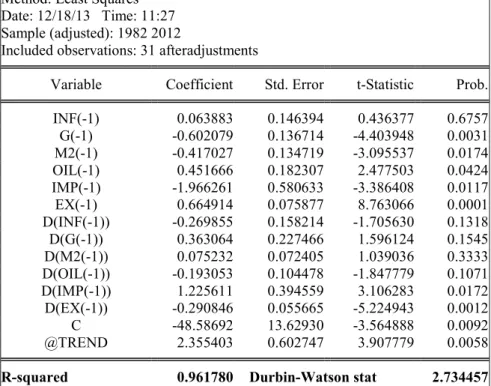
Thus, on the basis of the results in Table (4), we may conclude that fiscal policy (government expenditure), Growth rate of Money supply (M2),oil prices, Imports and effective Exchange rate can impact inflation in the long-run. However, in the short -run, fiscal and monetary policies do not seem to cause inflation in Algeria.
Inf= 4.78 G (-1) + 2.56 M2 (-1) - 3.63 oil (-1) + 5.80 imp (-1) - 6.35 ex (-1) + 1.80d (oil (-1)) + 6.39 d (imp (-1)) - 2.25 d (ex (-1)) -23.05…… (2)
The empirical results identified in equation (2) show through some elasticities that one per cent change in public spending leads to 4.78% rise in inflation; and one percent increase in (M2) and imports leads to 2.56 and 5.8 percent rise in the Inflation rate. The long-run estimated elasticities of the government expenditures and supply of money (M2) have a positive impact on the Algerian inflation. These are the main arguments presented by monetary and Keynesian approaches. We find that rising import prices over the estimation period, are the most important determinants of inflation in long and short-run (the imported inflation) when food and manufactured goods prices in the markets commodities represent the main Algerian imports composition (3/4) which confirms what the Algeria’s economic is integrated in the global economy.
In addition, one percent increase in oil prices and effective exchange rate leads to 3.6 and 6.3 percent decrease in the inflation rate in long-run. Moreover higher income due to Crude oil export as the major government revenue leads in the first hand to a price subsidy for the necessary goods that can lessen to a certain extent the impact of inflation. On the other hand, the foreign exchange receipts from a rise in oil prices can serve for some reasons the Algerian exchange rate regime which is classified as managed floating exchange rate system to converge toward its mean of effective nominal exchange rate that should lead to controlled domestic price.
In the short-run, only external factor (imports price, oil price and effective nominal exchange rate) may impact inflation in Algeria. Positive effect on inflation is seen through a decrease of 2.2 percent as a result of one percent increase in oil and exchange rate levels. Import prices have had an effect on the domestic inflation rate through the fact that it would be associated with a 1 percent increase in the import price and a 6 percent increase in domestic inflation. In the same context, our results conclude that fiscal and the monetary policies cannot be statistically significant on Algeria’s inflation.
5. Conclusion
Our results show that there are long-run relationships between inflation and its determinants. However, our estimation of an ARDL model indicates that necessary prerequisites to control inflation in Algeria rests on monetary mechanisms triggered by central bank that can help optimize government expenditure
References
António, Rua. (2012). Money Growth and Inflation in the Euro Area: A Time-Frequency View. Oxford Bulletin of Economics and Statistics, Department of Economics, University of Oxford, vol. 74(6), pages 875-885, December.
Arize, Augustine C., John, Malindretos., and Srinivas, Nippani. (2004). Variations in Exchange Rates and Inflation in 82 Countries: An Empirical Investigation. The North American Journal of Economics and Finance, 15, 227-247.
Barro, R. (1991). Economic growth in a cross section of countries. Quarterly Journal of Economics, 407–443. Baumeister, C. et al (2008). Liquidity, Inflation and Asset Prices in a Time-Varying Framework for the Euro Area,
Working Paper No. 142, National Bank of Belgium.
Borio, C. and A. Filardo. (2007). Globalization and inflation: New cross-country evidence on the global determinants of domestic inflation. BIS Working Paper No. 227, Bank for International Settlement, Switzerland.
Bruno, M. and W. Easterly, (1998). Inflation crises and long-run growth. Journal of Monetary Economics, vol. 41, pp. 3-26.
Caceres C et al (2011). Inflation Dynamics in the CEMAC Region, IMF Working Paper, WP/11/232 Cecchetti, Stephen C. and Richhild Moessner, (2008). Commodity Prices and Inflation. BIS WP.
Cheung, C. (2009). Are commodity prices useful leading indicators of inflation?. Bank of Canada Discussion Paper2009–5.
Click, R., (1998). Seignior age in a cross-section of countries. Journal of Money, Credit and Banking 30, 154–163 Dickey DA, Fuller WA. (1979). Distribution of the Estimator for Autoregressive Time Series with a Unit Root.
Am. J. Statist. Assoc. 74:427-431.
Diop, A., Dufrénot, G., et Sanon, G. (2008), Long Run Determinants of Inflation in WAEMU. In A-M. Gulde et C. Tsangarides (Eds.), The CFA Franc Zone: Common Currency, Uncommon Challenges, Washington DC: International Monetary Fund.
Diouf, M. (2007). Modeling inflation for Mali. IMF Working Paper07/295, International Monetary Fund, Washington.
Dornbush, Rudiger., Sturzenegger, Fedrico, Wolf, Holger, Fischer, Stanley and Robert, Barro. (1990). Extreme Inflation: Dynamics and Stabilization. Brookings Papers on Economic Activity, 2, 1-84.
Habermeier, Karl. et al. (2009). Inflation Pressures and Monetary Policy Options in Emerging and Developing Countries: A Cross Regional Perspective. IMF Working Paper 09/01 (Washington: International Monetary Fund)
Ghosh, A. and Phillips, S. (1998). Inflation, disinflation and growth. IMF Working Papers 68, International Monetary Fund.
Khan, A et al (2007). Determinants Of Recent Inflation in Pakistan, "MPRA Paper 16254, University Library of Munich, Germany, revised 2007.
Khan, M. and Senhadji, A. (2000), Threshold effects in the relationship between inflation and growth, IMF Working Papers 110.
Khan, Mohsin S. and Axel Schimmelpfennig (2006). ‘Inflation in Pakistan: Money or Wheat?’ IMF Working Paper No./06/60.
Kinda, T. (2011). Modeling Inflation in Chad. IMF Working Paper, WP 11/57, Washington: International Monetary Fund
King, R. G., and C. I. Plosser (1985). Money, Deficits, and Inflation”, Carnegie-Rochester Conference Series on Public Policy, 22, Spring, 147-196.
Hofmann, B. (2006). Do monetary indicators (still) predict euro area inflation?. Dutsche Bundes Bank, Discussion Paper, Series1: Economic Studies, No. 18
Huang et al (2010), what determine chain’s inflation, working paper series, china center for economic research, N° E2010001, 2010-2
Nir, Klein., and Alexander, Kyei. (2009). Understanding Inflation Inertia in Angola. IMF Working Paper, WP/09/98
Juselius, K. (1992). Domestic and foreign effects on prices in an open economy: The case of Denmark. Journal of Policy Modeling, Elsevier, 14(4): 401–428.
Lim, C. H. and L. Papi.(1997). “An econometric analysis of determinants of inflation in Turkey.”, IMF Working Paper97/170, International Monetary Fund, Washington.
Magda, Kandil. and Hanan, Morsy. (2011). Determinants of inflation in GCC, Middle East. Dev. J.03, 141. Mah, J. S.(2000). An Empirical Examination of the Disaggregated Import Demand of Korea - The case of
Information Technology Product. Journal of Asian Economic, 11, 237-244.
Mehdi, S. and Seyyed, Y.A. (2013). Modeling the impact of money on GDP and inflation in Iran: ion-model (VECM) approach, African Journal of Business Management, Vol. 7(35), pp. 3423-3434, 21 September. Mohsen, Bahmani A, and Dan Xi (2012). Exchange Rate Volatility and Domestic Consumption: Evidence from
Japan, Economic Systems, Vol. 36, No. 2.
Odhiambo, Nicholas M., (2009). Energy consumption and economic growth nexus in Tanzania: An ARDL bounds testing approach. Energy Policy, Elsevier, vol. 37(2), pages 617-622, February.
Odusanya, I. A. and A. A., Atanda (2010). Analysis of Inflation and Its Determinants in Nigeria. Pakistan Journal of Social Sciences, Volume 7, No. 2. Pg. 97-100.
Pattichis, C.A (1999). Price and income elasticities of disaggregated import demand: results from UECMs and application. Journal of Applied Econometrics.31, 1061-1071.
Pedersen, M. (2010). Propagation of inflationary shocks in Chile and an international comparison of propagation of shocks to food and energy prices’, Working Paper No. 566, Central Bank of Chile.
Pesaran, M.H. (1997). The Role of Economic Theory in Modelling the Long Run.” The Economic Journal 107: 198–191.
Pesaran, H., Shin, Y., and Smith, R. (2001). Bounds testing approaches to the analysis of level relationships. Journal of Applied Econometrics, 16, 289−326.
Tang, T. C., & Nair, M. (2002). A Cointegration Analysis of Malaysian Import Demand Function: Reassessment from the Bound Test. Applied Economics Letter, 9, 293-296.
Yamak, R, Kukkale Y. (1998). Anticipated Versus Unanticipated Money in Turkey. Yapi Kredi Econ. Rev 9(1):15-25.
ANNEXE
Figure 1: inflation rates variations in Algeria
0 4 8 12 16 20 24 28 32 80 82 84 86 88 90 92 94 96 98 00 02 04 06 08 10 12
Source: World Development Indicators Database.
Table 1. GDP & government revenues dependency on oil
2004 2005 2006 2007 2008 2009 2010 2011 2012 Share of oil in GDP (%) 35.5 45 45.4 43.3 45.4 31.6 32.5 39 31.7 government expenditure
(billions of dollars) 44.4 46.1 50.8 57.6 73.9 67.4 79.5 81 91.4 Trade Openness (%) 58,1 64,8 64,9 64,6 69,4 60,2 61,1 71 53,9
Source:* IMF Country Report of Algeria from 2004-2012.
**Statistics Algeria, The ministry of Finance: http://www.mf.gov.dz/rubriques/15/Activités.html.
Table 2. Stationary test results
variable ADF PP
Level First difference Level First difference
INF G M2 IMP OIL E -1.87 -2.59* -4.81*** -0.90 -1.07 -3.61*** -4.91*** -4.33*** -7.80*** -7.23*** -6.56*** -10.11*** -2.01 -2.56 -5.69 -1.31 -0.82 -7.28*** -4.83*** -4.64*** -20.08* -8.84*** -6.25*** -20.85*** *show values are significant at 10 % level with MacKinnon (1996).
**show values are significant at 1% level with MacKinnon (1996). ***show values are significant at 5 % and 1 level with MacKinnon (1996).
Table 3. Results of F-test Wald Test:
Equation: EQ04
Test Statistic Value df Probability
F-statistic 22.52404 (6, 7) 0.0003
Table 4. Estimated Coefficients using the ARDL approach Dependent Variable: D(INF)
Method: Least Squares Date: 12/18/13 Time: 11:27 Sample (adjusted): 1982 2012
Included observations: 31 afteradjustments
Variable Coefficient Std. Error t-Statistic Prob.
INF(-1) 0.063883 0.146394 0.436377 0.6757 G(-1) -0.602079 0.136714 -4.403948 0.0031 M2(-1) -0.417027 0.134719 -3.095537 0.0174 OIL(-1) 0.451666 0.182307 2.477503 0.0424 IMP(-1) -1.966261 0.580633 -3.386408 0.0117 EX(-1) 0.664914 0.075877 8.763066 0.0001 D(INF(-1)) -0.269855 0.158214 -1.705630 0.1318 D(G(-1)) 0.363064 0.227466 1.596124 0.1545 D(M2(-1)) 0.075232 0.072405 1.039036 0.3333 D(OIL(-1)) -0.193053 0.104478 -1.847779 0.1071 D(IMP(-1)) 1.225611 0.394559 3.106283 0.0172 D(EX(-1)) -0.290846 0.055665 -5.224943 0.0012 C -48.58692 13.62930 -3.564888 0.0092 @TREND 2.355403 0.602747 3.907779 0.0058