th
Annual Report 2002
8
th
Annual Report 2002
Danish Polar Center
Ministry of Science, Technology and Innovation
2003
Zackenberg Ecological Research Operations
8
th
Annual Report, 2002
Danish Polar Center 2003
Copenhagen, Danish Polar Center, Ministry of Science, Technology and Innovation, 2003. © 2003 Danish Polar Center
Editors Morten Rasch and Kirsten Caning Layout Special-Trykkeriet Viborg a-s Printed by Special-Trykkeriet Viborg a-s Impression 800
Paper 80 g recycled
Front cover: The micro meteorological station for continuous measurements of energy, carbon dioxide and water vapour exchange between the tundra and the atmosphere is established each year in June, on the heath east of Zackenberg Station. On the photo, GeoBasis Assistant Charlotte Sigsgaard is working with the first calibration of the instrument (Photo Morten Rasch/PolarPhotos).
Back of cover: BioBasis Manager Hans Meltofte and BioBasis assistant Line Kyhn are emptying the different insect traps in ‘Gadekæret’ just outside Zackenberg Station in early June 2002 (Photo Morten
Rasch/PolarPhotos). ISBN 87-90369-66-1
This book is free of charge and may be ordered from Danish Polar Center
Strandgade 100H DK-1401 Copenhagen K Tel. (+45) 32880100 Fax (+45) 32880101 Email: [email protected]
Contents
Executive summaryby Hans Meltofte and Morten Rasch . . . . 5
1 Introductionby Morten Rasch . . . . 7
2Logistics by Henrik Philipsen . . . . 9
3 Zackenberg Basic: The GeoBasis and ClimateBasis programmesedited by Morten Rasch . . . . 10
3.1 The meteorological station by Dorthe Petersen . . . . 10
3.2 TinyTalk/TinyTag dataloggers by Morten Rasch and Charlotte Sigsgaard . . . . 12
3.3 The hydrometric station by Dorthe Petersen, Håkon Gjessing Karlsen, Morten Rasch and Charlotte Sigsgaard . . . . 12
3.4 Landscape monitoring by Morten Rasch, Charlotte Sigsgaard and Jørgen Hinkler . . . . 14
4 Zackenberg Basic: The BioBasis programmeedited by Hans Meltofte . . . . 21
4.1 Spring snow cover, ice conditions and streams by Hans Meltofte and Jørgen Hinkler . . . . 21
4.2 Vegetation by Hans Meltofte, Mikkel Tamstorf, Henrik Søgaard, Morten Rasch and Charlotte Sigsgaard . . . . 22
4.3 Arthropods by Line Anker Kyhn and Hans Meltofte . . . . 28
4.4 Birds by Hans Meltofte . . . . 33
4.5 Mammals by Thomas B. Berg . . . . 43
4.6 Lakes by Kirsten Christoffersen and Erik Jeppesen . . . . 50
5 Research projects . . . 53
5.1 Measuring snow depths in Zackenbergdalen with ground penetrating radar by Jens Nykjær Larsen and Håkon Gjessing Karlsen . . . . 53
5.2 Glacier pilot study by Håkon Gjessing Karlsen and Jens Nykjær Larsen . . . . 54
5.3 Effects of UV-B radiation on vegetation in Zackenberg by Teis N. Mikkelsen, Helge Ro-Poulsen, Linda Bredahl and Kristian Albert . . . . 54
5.4 High resolution Digital Terrain Model and Hyperspectral data cube for Zackenberg by Mikkel Tamstorf . . . . 55
5.5 Chemistry and genetic variability in arctic plants by Per Mølgaard . . . . 56
5.6 Behaviour of the Collared lemming Dicrostonyx groenlandicus in the arctic summer by Line A. Kyhn . . . . 56
5.7 Collared Lemming Project – Zackenberg by Thomas B. Berg . . . . 58
5.8 Marine studies at Daneborg by Søren Rysgaard, Ronnie N. Glud and Egon Frandsen . . . . 58
5.9 Walrus studies on Sandøen by Erik W. Born, Lars Ø. Knutsen, Lars Heilmann and Nette Levermann . . . . 60
5.10 ITACA2 – twin 76 magnetic latitude auroral monitors by Stefano Massetti, Maurizio Candidi, Pasquale Cerulli-Irelli, Roberto Sparapani, Marco Maggiore and Henrik Philipsen . . . . 61
5.11 Soil moisture and fluvial geomorphology by Bent Hasholt . . . . 62
5.12 Spectral Calibration for High Arctic Primary Production Estimation (SCHAPPE) by Mikkel Tamstorf . . . . 62
6 Disturbances in the study areaby Hans Meltofte . . . . 64
7 Zackenberg – Daneborg publications 2001compiled by Vibeke Sloth Jakobsen . . . . 66
9 Zackenberg Basic. Climate change effects in a High Arctic ecosystem at Zackenberg, Northeast Greenland. The conceptby Morten Rasch,
Søren Rysgaard, Hans Meltofte and Jørgen Bille Hansen . . . . 70
In 2002, Zackenberg Station was open 97 days from 28 May to 31 August. Seventeen scientists and four logisticians worked at the station during that period and six other persons paid Zackenberg a visit. Ten scientists and two logisticians used the af-filiation in Daneborg from 27 May to 14 June and again from 28 July to 31 August. The total number of bed nights at Zacken-berg Station was only 978, which is less than in previous years.
In 2002, Climate Basis continued the measurements of climate at Zackenberg and water discharge in Zackenbergelven, and GeoBasis continued their measure-ments of different geomorphological and hydrological parameters. No major changes were made to the climate stations at Zackenberg in 2002, but GeoBasis in-stalled equipment for measurements of the physical and chemical environment in the top soil at two of the BioBasis vegeta-tion plots (Salix 1 and Dryas 2). A mast was erected for sampling of precipitation near the climate station.
2002 was a year of extraordinary high temperatures in early spring, i.e. late May and early June, and again in late June and early July, weather was warm and sunny. The mean temperatures for the period 21 May – 10 June were the highest recorded at both Danmarkshavn and Daneborg weather stations since computerised data were made available from 1958. For June in general, 2002 was the warmest month recorded at Danmarkshavn since measure-ments began in 1949, whereas four years had as high or even a little higher temper-atures at Daneborg (data since 1958).
In spite of the fact that the snow depth at Zackenberg was the second highest recorded during the ZERO programme (since 1997-98), it was not particularly ex-tensive, and the warm spring resulted in a relatively fast snowmelt. Again, due to the warm weather, ponds and lakes became ice-free early, and the streams started to run earlier than recorded before. The same applies to break up of the fjord ice, which was 1-3 weeks earlier than before. Also the other fjords of Northeast Greenland broke up exceptionally early, and unprecedented
little pack ice was found in the East Green-land Current in summer and autumn.
Flowering was generally among the ear-liest recorded for white arctic bell-heather, arctic poppy and arctic willow together with some of the mountain avens plots, while others were closer to average. Open-ing of seed capsules showed a more di-verse pattern, with arctic puppy close to average or even late, and arctic willow very early. Purple saxifrage was relatively early to intermediate. This diverse pattern may have been due to a relatively cool weather in the second half of July and most of August. 2002 was again a year of many flowers especially in arctic willow, moss campion and arctic cotton-grass, but not quite as many as in 2001 in most white arctic bell-heather and mountain avens plots. Berry production was moderate in the bearberry plots and even poorer in the arctic blueberry plot, while crowberries again appeared in good numbers.
Greening index data from a Landsat-7 satellite image and from hand-held mea-surements showed values for 2002 that were similar or very close to the values from 2001 and somewhat lower than most other years.
Soil respiration increased during snowmelt and reached a maximum of 0.85 g C per m2per day on 28 June during a spell of very warm weather. The growing season, characterised by a daily net C ac-cumulation, began on 2 July, within the range from previous years. During the peak growing season, the CO2uptake reached a maximum of 1.0 g C per m2per day, and the CO2exchange in the 2002 growing season was of the same order of magnitude as found in the two previous years. The end of the growing season on 16 August was within the range from pre-vious years, and the second half of August was characterised by net C loss.
The total number of arthropods collect-ed this year (71,972) was much higher than last year and almost reaches the high-est number ever recorded. Butterflies were caught in the highest numbers since 1996, and also the number of larvae was high relative to the last three years. Outside the
Executive summary
traps, the most common butterflies, arctic clouded yellow and fritillary sp., were also encountered in very high numbers during bird census work. The warm and sunny weather in 2002 together with the relative-ly earrelative-ly snowmelt (giving high numbers of trapping days) are the most obvious rea-sons for the very high numbers of arthro-pods caught this season. Especially early June was warm, and this is reflected in the earlier build up and peak of many of the arthropods.
Most bird populations were of about the same size as in previous years, but fewer sanderlings and turnstones were found, possibly as a result of three consecutive problematic breeding seasons. The rock ptarmigan population remained low for the third year in succession. Egg-laying in waders was extraordinary early, and some wader clutches were initiated as early as the earliest recorded in high arctic Green-land so far. This was probably the result of the unprecedented high temperatures in late May and early June. Hatching success was moderate due to predation, but gener-ally young production was good. Long-tailed skuas suffered from heavy preda-tion by foxes. More barnacle goose fami-lies brought their young to Zacken-bergdalen than recorded before, while the brood size was close to average.
After the increase in lemming winter nests from 2000 to 2001, the winter popu-lation was expected to peak during the winter 2001-2002, but the density re-mained at an intermediate level equal to the previous year. Numbers of lemming winter nests depredated by stoat have re-mained almost the same for three years now.
High numbers of musk oxen were recorded in June, but mainly outside the 40 km2census area. Totals decreased to-wards 1 July, whereupon numbers fol-lowed the patterns of previous years, and numbers of ’musk ox days’ within the 40 km2census area were within the range recorded in earlier years. The maximum number of musk oxen recorded within the census area was 145 individuals in mid August. The calf:cow ratio was 0.32:1, which is in the lower end compared with previous years. On 22 July, an aerial sur-vey covering Wollaston Forland and A.P. Olsen Land gave 234 musk oxen, which including data from the almost simultane-ous ground counts, add up to a total of 368 musk oxen. Considering the biases in nection with the aerial survey it was con-cluded that the musk ox population was within the range of 500-800 animals earlier estimated for the area.
Five fox dens in the study area were partly in use during the summer. Pups may have been present in one den, which in that case might have died in early July. The total number of fox encounters was much the same as in 1997, 1998 and 1999. Three records of single arctic wolfs were made. A minimum of nine arctic hares was recorded within the study area.
A maximum of 48 seals was recorded on the fjord ice in late June, and a maximum of 24 walruses was hauled-out on Sandøen in late July.
Twelve scientific projects were carried out in 2002 based on data from Zacken-berg. Of these, three projects were carried out at Daneborg while the remaining were carried out either at Zackenberg or based on data from Zackenberg.
The 2002 field season at Zackenberg Sta-tion had the lowest activity since the first year in 1995. Only 26 scientists represent-ing twelve different projects visited the station during June-August, and when we departed from the station on 31 August, the total number of bed nights counted 978. An activity level like that makes the run of Zackenberg Station very expensive due to a high level of general costs. There-fore, several attempts have been made to improve the knowledge about the station in the science community, and already several projects have announced their in-terest in using the station in 2003. The op-timal level of activity at Zackenberg is be-tween 1,500-1,700 bed nights. With less ac-tivity it is relatively expensive to serve each scientist at the station and with more activity the capacity of the physical facility is exceeded and the level of disturbance to the ecosystem becomes too high.
Changes in the concept of Zackenberg Basic
Over the last two years, attempts have been made to extend and restructure the moni-toring programme, Zackenberg Basic. Until now, the monitoring has consisted of three sub-programmes. ClimateBasis is run by Asiaq, Greenland Field Investigation, and the programme takes care of the run and maintenance of the climate station and the hydrometric station at Zackenberg. GeoBa-sis is run by Danish Polar Center in cooper-ation with Institute of Geography, Univer-sity of Copenhagen. This programme mea-sures the fluxes of water, suspended sedi-ment, organic matter and solutes in the re-search area, it measures the development of the active layer and it monitors selected ge-omorphological processes. BioBasis moni-tors the biotic part of the terrestrial ecosys-tem incl. the flora and fauna at Zackenebrg. The programme is run by Danish National Environmental Research Institute.
With the planned new concept for Zack-enberg Basic it is our intention to extend GeoBasis and to make it a cooperation be-tween Danish National Environmental Re-search Institute and Institute of
Geogra-phy at University of Copenhagen. Further, it is our intention to introduce a new ma-rine monitoring programme, Mama-rineBasis, continuing and extending the marine re-search activities carried out in Daneborg by Danish National Environmental Re-search Institute since 1994. By these means Zackenberg Basic could become the first programme in the world studying all the different aspects of eco system function in a high arctic environment, and the pro-gramme would be an ideal Danish contri-bution to AMAP’s Climate Change Effects Programme. The new concept has been described in a concept paper prepared in cooperation between Danish Polar Center, Danish National Environmental Research Institute, University of Copenhagen and Asiaq, Greenland Field Investigation. The content of the concept paper is given in Chapter 9 in this report. In 2002, the Dan-ish Environmental Protection Agency funded four smaller pilot projects neces-sary for the extension of GeoBasis and the introduction of MarineBasis.
Extension of the facility
The plans of extending the station with an accommodation building and a combined power station, workshop and garage were not carried out in 2002. The establishment of the two buildings are part of a compre-hensive plan for the future development of the National Park of North and North-east Greenland. At the moment the exten-sion of the Zackenberg facility is waiting for a process of defining the future owner-ship of all buildings in the National Park. The process of coordinating the future ac-tivities in the National Park is carried out in cooperation between the major opera-tors in the National Park, and the process is being led by the Ministry of Science, Technology and Innovation.
In 2002, Zackenberg Station took over a smaller house which originally was build by the Sirius Dog Sledge Patrol as the first building at Zackenberg in 1995. It is our plan to restore the house and eventually use it for accommodation of Zackenberg staff.
1 Introduction
Morten RaschCooperation with Greenland research sites
The cooperation with the other Greenland research facilities, including Arctic Station (central West Greenland), Greenland Insti-tute of Natural Resources (southern West Greenland), Kangerlussuaq International Science Support (mid West Greenland) and Sermilik Station (Southeast Green-land), was continued in 2002. A common brochure telling about the different possi-bilities at the different stations was pub-lished. This brochure will be sent to uni-versities and research institutes with de-partments for polar research in order to promote Greenland as an excellent re-search area with very different field sta-tions in very different environmental set-tings.
International cooperation
Zackenberg Station continued its partici-pation in the two EU-funded networks, ENVINET and SCANNET. In SCANNET, Zackenberg Station is leading a project on Species Performance and Phenology in the North Atlantic region. In ENVINET, Zack-enberg Station is taking care of the Station Manager Forum, a forum promoting the experience exchange and cooperation be-tween station managers at different Euro-pean research stations. To run these two projects, Danish Polar Center has received funding for the employment of two per-sons, Toke Thomas Høye, employed at University of Copenhagen and taking care of the SCANNET obligations and Ga-brielle Stockmann, employed at Danish Polar Center and taking care of the EN-VINET obligations.
Zackenberg Station has become in-volved in the establishment of a circum arctic network of research stations. The network is called Circum-Arctic Environ-mental Observatories Network (CEON). The initiating institutions are United States National Science Foundation, Abisko Scientific Research Station and Danish Polar Center. The plan will be pre-sented at Arctic Science Summit Week in Sweden early in 2003 and a workshop ini-tiating the network is planned to be held in Stockholm in the autumn of 2003.
Danish Polar Center has in cooperation with the Swedish Polar Research Secretari-at, tried to join forces in a Danish-Swedish Biodiversity Project involving six Danish and six Swedish scientists at Zackenberg
in 2002. Unfortunately, it was not possible to accomplish the project due to lack of funding for the Danish part of the project. The Swedish part of the project was fund-ed by the Swfund-edish Polar Research Secre-tariat which in contrast to Danish Polar Center have the possibility of funding strategic research initiatives. Attempts will be made to find funding for the Danish part of the project in 2003.
Late in 2002, the Swedish Polar Re-search Secretariat offered to a Zackenberg logistician to join their activities in the Antarctic. As a result, logistician Aka Lyn-ge, worked for one and a half month on the Swedish facilities, WASA and SVEA. The purpose of his trip to the Antarctic was to learn from the Swedish experiences about the run and maintenance of a large research station in an extreme environ-ment.
Plans for the 2003 field season
The 2003 field season is expected to be very busy with several large projects both at Zackenberg and at Daneborg. Due to in-creased activities out of Zackenberg (in the Young Sund/Tyrolerfjord system, on Clavering Ø and on A.P. Olsen Land) it is our plan to buy a large rubber boat for transportation of scientists from Zacken-berg to different field sites. Further, it is our intention to improve the toilet facili-ties, and to finish repairing the house that we bought in 2002 from the Sirius Dogsledge Patrol.
Further information about
Zackenberg Station and the study area
Details about Zackenberg Station and its study area are given in earlier annual re-ports (Meltofte and Thing 1996, 1997; Meltofte and Rasch 1998; Rasch 1999; Can-ing and Rasch 2000, 2001, 2003). The annu-al reports can be downloaded from the homepage www.zackenberg.dk where other publications from Zackenberg as well as a description of the facility, the ZERO Site Manual, application forms and other relevant materials are available. The secretariat can be contacted on the ad-dress: The Zackenberg Station Secretariat, Danish Polar Center, Strandgade 100H, DK-1401 Copenhagen K, Denmark. Phone: +45 32880100, Fax: +45 32880101, E-mail: [email protected].
In 2002, Zackenberg Station was open for 97 days, from 28 May to 31 August. Seven-teen scientist and four logisticians worked from the station. The station received five official guests. Zackenberg´s branch facili-ty in Daneborg was used by 10 scientists and one logistician from 27 May to 14 June and again from 28 July to 31 August. The total number of person days at Zacken-berg and Daneborg was 978.
Transportation
The runway at Zackenberg was covered by snow and ice on our first arrival 27 May and was ready to welcome the first plane on 1 June.
The number of landings with fixed winged aircrafts was 24, twelve landings with personel and twelve landings with cargo. One helicopter landed to pick up guests for transport to Mestersvig.
Local transportation of heavy equip-ment was done with our ATV, on marked roads. One trip was made off road during the night between 28 and 29 May over the sea ice to Daneborg to pick up cargo and provision. Another off road trip was made during the night between 3 and 4 June to Store Sø to deliver heavy equipment for a scientific project.
Houses
At Zackenberg, guests and scientists are accomodated in Weatherheaven shelters. The shelters need repair, but are still us-able for one or two years. The condition of the houses at Zackenberg is good because of continuous maintenance. In 2002, a hut formerly owned by the Sirius Dog Sledge Patrol was purchased by Zackenberg Sta-tion and upgraded to allow for accommo-dation of two persons in single rooms. In the mess room a data projector was in-stalled to allow for scientific presentations,
as well as a DVD with surround sound for the weekly transformation of the mess room to “Zackenberg Cinema”.
Electrical power supply
Two 14.8 kW generators supply the station with electricity and five small generators are used for power supply in the field. The large generators are still working very well.
The power supply in two houses was converted from AC 230 V to AC 400 V to allow installation of two new electrical water heaters.
Water supply
In 2000 and 2001 we installed aluminium tanks for water storage and in 2002 we bought an integrated water pump system. The new water supply system is expected to work from the beginning of the 2003 field season.
Telecommunication
External communication is performed by a satellite phone (Inmarsat-M), fax and e-mail. This year 751 e-mails were sent and received through a dial-up connection to a server at the Institute of Geography, Uni-versity of Copenhagen. Telephone com-munication totalled 1,368 minutes.
To communicate with other stations in Northeast Greenland a HF-radio is used. VHF-radios are used for local communica-tion at the stacommunica-tion and surroundings.
Boats
A 2.4 m rubber boat, Suzumar RIB with a 15 HP engine, was bought. The old Zodiac rubber boat is still in use, but will need re-pair during the winter 2002-3.
2 Logistics
Henrik PhilipsenThe GeoBasis and ClimateBasis program-mes collect data describing the physical and geomorphological environment at Zackenberg. This includes the climate in the Zackenberg area, the water balance of the Zackenbergelven river drainage basin, the sediment, solute and organic matter yield of the Zackenbergelven drainage basin, the dynamics of selected physical land-scape elements, and the seasonal develop-ment of the active layer, its temperature conditions and its soil water chemistry.
GeoBasis is operated by Institute of Ge-ography at University of Copenhagen and Danish Polar Center in cooperation.
ClimateBasis is operated by Asiaq, Greenland Field Investigations, who takes care of the run and maintenance of the cli-mate station and the hydrometric station
The GeoBasis and ClimateBasis installa-tions have been described in previous an-nual reports (Meltofte and Thing 1996; Meltofte and Rasch 1998; Rasch 1999; Can-ing and Rasch 2000, 2001, 2003a). Data
from the two programmes are available free of charge from Institute of Geography, University of Copenhagen ([email protected]).
3.1 The meteorological station
Dorthe Petersen
The meteorological station at Zackenberg was constructed in the summer of 1995. The technical specifications of the station are described in Meltofte and Thing (1996). In 1997 the radiation sensors were moved to a separate mast and a mast for snow depth measurements was erected (see Meltofte and Rasch 1998).
In 2002, no major changes to the station were conducted. The sensors were cali-brated and checked by ASIAQ, Greenland Field investigations.
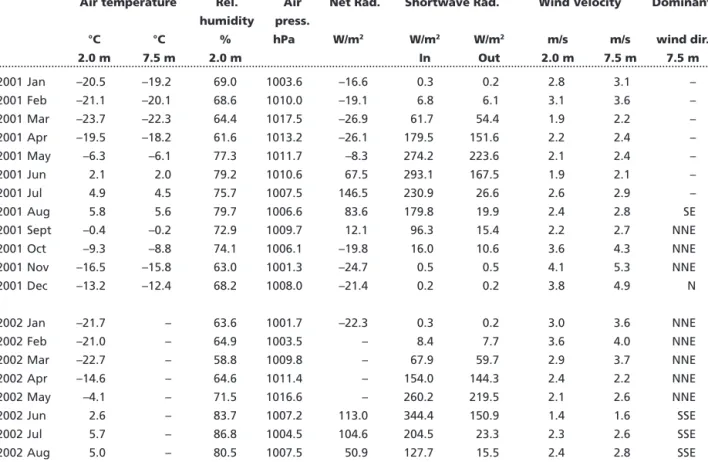
Meteorological data from 2001
Table 3.1 shows a summary of climatic
pa-Table 3.1. Summary of selected climate parame-ters, 2001.
3 Zackenberg Basic:
The GeoBasis and ClimateBasis
programmes
Morten Rasch (editor)
Mean Max. Min.
Air temperature, 2 m above terrain (°C) –9.7 12.6 –35.1
Air temperature, 7.5 m above terrain (°C) –9.2 12.4 –33.0
Relative air humidity 2 m above terrain (%) 71.2 99.6 21.6
Air Pressure (hPa) 1008.8 1042.5 972.2
Incoming shortwave radiation (W/m2) 112.1 818.0 0.0
Outgoing shortwave radiation (W/m2) 56.5 619.8 0.0
Net Radiation (W/m2) 13.2 601.8 –123.7
Wind Velocity, 2 m above terrain (m/s) 2.7 20.6 0.0
Wind Velocity, 7.5 m above terrain (m/s) 3.2 25.0 0.0
Precipitation (mm w.eq.), total 236
Ground temperature, 0 cm below surface (°C) –7.6 21.0 –19.5
Ground temperature, 2.5 cm below surface (°C) –7.7 13.0 –18.0
Ground temperature, 5 cm below surface (°C) –7.1 11.6 –17.0
Ground temperature, 10 cm below surface (°C) –6.3 11.4 –16.3
Ground temperature, 20 cm below surface (°C) –7.7 7.6 –16.9
Ground temperature, 40 cm below surface (°C) –8.3 3.1 –16.0
Ground temperature, 60 cm below surface (°C) –6.5 2.6 –13.0
Ground temperature, 80 cm below surface (°C) –6.2 1.1 –12.2
Ground temperature, 100 cm below surface (°C) –7.6 –0.6 –13.3
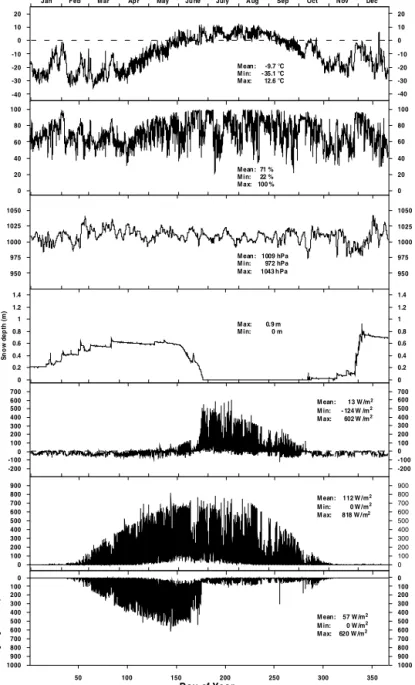
rameters measured in 2001. Tables 3.2 and 3.3 show monthly mean values (January 2001 – August 2002) of climate parameters and ground temperatures, respectively. The variations of selected climate parame-ters and wind parameparame-ters in 2001 are shown in Figures 3.1 and 3.2, respectively.
In 2001, the mean air temperature mea-sured 2 m above terrain was –9.7°C. The maximum temperature was 12.6°C (early August), and the minimum temperature was –35.1°C (early March). The tempera-ture varies much more in winter than in summer. The period with frequent tem-peratures above 0°C started in late May and ended in mid September (Figure 3.1).
The total amount of precipitation in 2001 was 236 mm. The snow depth reached a maximum of 0.68 m in the win-ter 2000/2001.
The mean air pressure was 1,008.8 hPa. The air pressure was generally more stable during summer than during winter.
The relative humidity was highest dur-ing the summer period. Mean relative hu-midity was 71.2%.
The monthly mean net radiation was positive in June, July, August and Septem-ber and negative in the remaining months. The same distribution has been seen in the
previous years. The mean net radiation was 13.2 W/m2. The last snow melted away in late June resulting in a large in-crease of the net radiation due to de-creased albedo.
Mean wind speeds 2 and 7.5 m above ground were 2.7 and 3.2 m/s, respectively. The highest 10 minutes mean value was 20.6 m/s at 2 m above ground and 25.0 m/s at 7.5 m above ground. The wind speeds are generally higher during winter than during summer.
The wind direction sensor was unfortu-nately out of order from late January until the measuring station was inspected in late July. The distribution of wind from different directions is therefore not calcu-lated for 2001. In the autumn and winter period, the dominant wind direction was between N and NNE (Table 3.2 and Figure 3.2).
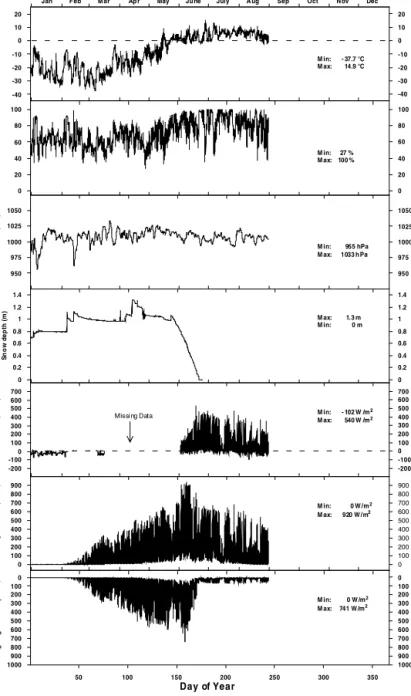
Meteorological data from 2002
Monthly mean values of climate parame-ters are given in Tables 3.2 and 3.3. The variations of selected climate parameters and wind parameters are shown for the period January until August in respective-ly Figure 3.3 and Figure 3.4.
The monthly mean values of the
climat-Table 3.2. Monthly mean values of selected climate parameters, January 2001 – August 2002
Air temperature Rel. Air Net Rad. Shortwave Rad. Wind Velocity Dominant humidity press.
°C °C % hPa W/m2 W/m2 W/m2 m/s m/s wind dir.
2.0 m 7.5 m 2.0 m In Out 2.0 m 7.5 m 7.5 m 2001 Jan –20.5 –19.2 69.0 1003.6 –16.6 0.3 0.2 2.8 3.1 – 2001 Feb –21.1 –20.1 68.6 1010.0 –19.1 6.8 6.1 3.1 3.6 – 2001 Mar –23.7 –22.3 64.4 1017.5 –26.9 61.7 54.4 1.9 2.2 – 2001 Apr –19.5 –18.2 61.6 1013.2 –26.1 179.5 151.6 2.2 2.4 – 2001 May –6.3 –6.1 77.3 1011.7 –8.3 274.2 223.6 2.1 2.4 – 2001 Jun 2.1 2.0 79.2 1010.6 67.5 293.1 167.5 1.9 2.1 – 2001 Jul 4.9 4.5 75.7 1007.5 146.5 230.9 26.6 2.6 2.9 – 2001 Aug 5.8 5.6 79.7 1006.6 83.6 179.8 19.9 2.4 2.8 SE 2001 Sept –0.4 –0.2 72.9 1009.7 12.1 96.3 15.4 2.2 2.7 NNE 2001 Oct –9.3 –8.8 74.1 1006.1 –19.8 16.0 10.6 3.6 4.3 NNE 2001 Nov –16.5 –15.8 63.0 1001.3 –24.7 0.5 0.5 4.1 5.3 NNE 2001 Dec –13.2 –12.4 68.2 1008.0 –21.4 0.2 0.2 3.8 4.9 N 2002 Jan –21.7 – 63.6 1001.7 –22.3 0.3 0.2 3.0 3.6 NNE 2002 Feb –21.0 – 64.9 1003.5 – 8.4 7.7 3.6 4.0 NNE 2002 Mar –22.7 – 58.8 1009.8 – 67.9 59.7 2.9 3.7 NNE 2002 Apr –14.6 – 64.6 1011.4 – 154.0 144.3 2.4 2.2 NNE 2002 May –4.1 – 71.5 1016.6 – 260.2 219.5 2.1 2.6 NNE 2002 Jun 2.6 – 83.7 1007.2 113.0 344.4 150.9 1.4 1.6 SSE 2002 Jul 5.7 – 86.8 1004.5 104.6 204.5 23.3 2.3 2.6 SSE 2002 Aug 5.0 – 80.5 1007.5 50.9 127.7 15.5 2.4 2.8 SSE
ic parameters show the same trend as in previous years. The monthly mean tem-peratures became positive in June. The monthly mean relative humidity exceeded 70% in May.
The snow depth reached a maximum of 1.30 m during the winter 2001-2002. The last snow disappeared from the measuring station in late June giving a large positive net radiation in the following period (see section 4.1).
The dominant wind direction was NNE from January to May and SSE during the summer months (June-August). In previ-ous years (before 2001) the dominant wind direction has been NNW during the win-ter period and ESE to SE in the summer period. This might indicate a relatively large shift in the wind field. However, as
the shift coincides with a change of wind sensor, the change could also be the result of a technical error made during the change of the sensor. A detailed check of the sensor is planned in the coming field season. In case the shift in wind direction is a result of a technical error during the mounting of the new sensor it will be rela-tively easy to correct the data.
3.2 TinyTalk/TinyTag
dataloggers
Morten Rasch and Charlotte Sigsgaard
GeoBasis operated a total of 33 datalog-gers in 2001-2002 for measurements of air temperature at soil surface at three sites, soil temperature profiles (incl. air temper-ature at soil surface) at six sites, water temperature at one site and air tempera-ture in- and outside a snow patch at four sites. The purpose of the measurements has been described together with the posi-tion of the dataloggers, the interval be-tween measurements and the period of operation in Table 3.2.1 in Meltofte and Rasch (1998). Statistics from the period 1996-2001 are given in Table 3.4. Unfortu-nately there were serious problems with the TinyTag dataloggers in 2001-2002. Thirteen out of 33 dataloggers did not work well throughout 2000. This is defi-nitely not satisfying and as a result we started in 2001 when the problems first oc-curred to improve the set up by making the casings for the dataloggers more resis-tant towards water and moisture.
3.3 The hydrometric station
Dorthe Petersen, Håkon Gjessing Karlsen, Morten Rasch and Charlotte Sigsgaard
The hydrological measurements started at Zackenbergelven in 1995. The hydrometric station is described in details in Meltofte and Thing (1996). The station records the water discharge from the drainage basin of Zackenbergdalen, Store Sødal, Linde-mansdalen and Slettedalen. The basin covers an area of 514 km2. Glaciers cover 106 km2.
At the station, the water level is logged automatically with a sonic range sensor. This sensor determines by the use of sound the distance between the sensor
Figure 3.1. Variation in 2001 of selected climate parameters. From above: Air temperature, relative humidity, air pressure, snow depth, net radiation, incoming short wave radi-ation and outgoing short wave radiation. All param-eters are measured two meters above terrain.
M ean: 57 W /m2 M in: 0 W /m2 M ax: 620 W /m2 M ean: 112 W /m2 M in: 0 W /m2 M ax: 818 W /m2 M ean: 13 W /m2 M in: - 124 W /m2 M ax: 602 W /m2 M ean : 1009 hPa M in: 972 hPa M ax: 1043 hPa M ean : 71 % M in: 22 % M ax: 100 % M ean : -9.7 °C M in: - 35.1 °C M ax: 12.6 °C 50 100 150 200 250 300 350 Day of Year -40 -30 -20 -10 0 10 20 Ai r t e m p er at u re ( °C) 0 20 40 60 80 100 Re la ti v e H u m id it y ( % ) 950 975 1000 1025 1050 A ir P res su re ( h P a) -200 -100 0 100 200 300 400 500 600 700 N e t R a d ia tio n ( W /m 2) 0 100 200 300 400 500 600 700 800 900 In c o m ing S W R ad. ( W /m 2) 1000 900 800 700 600 500 400 300 200 100 0 O u tg o ing S W R a d. ( W /m 2) 0 0.2 0.4 0.6 0.8 1 1.2 1.4 S n ow d e pt h (m ) -40 -30 -20 -10 0 10 20 0 20 40 60 80 100 -200 -100 0 100 200 300 400 500 600 700 0 100 200 300 400 500 600 700 800 900 1000 900 800 700 600 500 400 300 200 100 0 950 975 1000 1025 1050 Jan Feb M ar Ap r May Ju ne July A ug Sep Oct N ov Dec
0 0.2 0.4 0.6 0.8 1 1.2 1.4 M ax: 0.9 m M in: 0 m
and the water surface. This signal is trans-formed to a water level, which can be transformed to a discharge, using an es-tablished relation between water level and discharge (a Q/h-relation)
The Q/h-relation
Discharges and corresponding water lev-els have been measured during all field seasons from 1995 to 2002. The function that describes the relation between water level and discharge is shown in Figure 3.5. The Q/h-relation is based on discharge measurements performed in the years 1995 to 1998 and discharges ranging from 5.98 to 70 m3/s. The good correlation of the Q/h-relation indicates that the cross profile at the hydrometric station was sta-ble in the period 1995 to 1998. Manual dis-charge measurements in 1999, 2000, 2001 and 2002 indicate that the cross profile also was stable during that period.
The Q/h-relation is only valid when the riverbed and -banks are ice- and snow free because snow covering the banks changes the cross profile of the river, and ice layers at the bottom of the river gives at false wa-ter level.
Table 3.3. Monthly mean values of ground tempera-tures, January 2001 – July 2002. 0 cm –2.5 cm –5 cm –10 cm –20 cm –40 cm –60 cm –80 cm –100 cm –130 cm 2001 Jan –16.5 –16.2 –15.4 –14.6 –15.5 –14.9 –12.1 –11.0 –12.0 –10.9 2001 Feb –15.3 –15.1 –14.3 –13.6 –14.5 –14.3 –11.8 –11.0 –12.0 –11.4 2001 Mar –15.9 –15.8 –15.0 –14.3 –15.3 –15.0 –12.5 –11.7 –12.8 –12.2 2001 Apr –15.3 –15.3 –14.5 –13.8 –14.9 –14.8 –12.6 –11.9 –13.1 –12.6 2001 May –10.9 –11.2 –10.5 –9.9 –11.3 –12.1 –10.6 –10.5 –11.8 –11.9 2001 Jun 1.7 0.5 0.6 1.0 –1.5 –3.8 –3.3 –4.4 –6.2 –8.2 2001 Jul 8.3 6.8 6.9 7.3 4.7 1.2 1.2 0.2 –1.7 –4.0 2001 Aug 6.9 5.6 6.0 6.7 4.5 2.1 2.3 0.9 –0.8 –2.9 2001 Sept –0.8 –0.6 0.3 1.3 0.2 –0.5 1.0 0.9 –0.7 –2.4 2001 Oct –8.0 –7.0 –5.9 –5.0 –5.5 –4.7 –2.0 –1.1 –2.4 –2.9 2001 Nov –15.6 –14.7 –13.8 –12.9 –13.4 –12.7 –9.4 –7.8 –8.7 –7.2 2001 Dec –10.7 –10.6 –9.8 –9.0 –10.2 –10.5 –8.4 –7.8 –9.0 –8.5 2002 Jan –13.1 –12.8 –11.9 –11.2 –12.1 –12.1 –9.7 –8.9 –10.0 –9.3 2002 Feb –13.6 –13.4 –12.6 –11.9 –12.9 –13.1 –10.8 –10.0 –11.1 –10.4 2002 Mar –14.4 –13.9 –13.4 –12.3 –13.6 –13.4 –11.3 –10.2 –11.6 –10.8 2002 Apr –12.7 – –12.0 – –12.4 – –10.9 – –11.6 – 2002 May –9.4 – –9.1 – –9.9 – –9.4 – –10.6 – 2002 Jun 3.5 2.3 2.1 2.6 –0.3 –2.6 –1.6 –2.6 –4.6 –6.5 2002 Jul 9.3 8.0 8.1 8.5 5.6 1.8 2.0 0.5 –1.5 –3.5 50 100 150 200 250 300 350 Day of Year 0 30 60 90 120 150 180 210 240 270 300 330 360 W in d d ir ect io n ( d eg re es) 0 5 10 15 20 25 30 Wi n d s p e e d ( m /s )
Jan Feb Mar Apr May June July Aug Sep Oct Nov Dec
N NE E SE S SW W NW N 0 5 10 15 20 25 30 Mean: 3.2 m/s Min: 0 m/s Max: 25.0 m/s
Figure 3.2. Variation in wind speed (m/s) and wind direction, 2001. Parameters are measured 7.5 meters above terrain. The wind direction sensor was out of order from late January until late July.
River water discharge
The water discharge in Zackenbergelven in 2002 is shown in Figure 3.6. In 2002, wa-ter was first observed in the river on 4 June. A torrent was seen on 6 June. The flow consisted of thick brash ice. Until 12 June, the riverbanks were covered with snow and ice. For this period the Q/h-re-lation is therefore not considered valid. No manually measured discharges are avail-able from this period. The sonic range sen-sor measurements are used to calculate the discharge from 10 June and onwards (Fig-ure 3.6). In the period 4-10 June, the dis-charges calculated from the sonic range measurements are considered unrealistic.
The total measured amount of water drained from the catchment area in 2002 was approximately 306 mio. m3. With a
drainage area of 514 km2this corresponds to a total water loss of 595 mm from the area. The precipitation in the hydrological year 2002, i.e. 1 October 2001 – 30 Septem-ber 2002, was 154 mm.
Sediment, solute and organic matter yield
Sediment concentrations, solute concentra-tions (Na, K, Ca, Mg, Fe, Al, Mn, Cl, NO3, SO4, HCO3) and organic matter concentra-tions are measured in samples of river water taken from Zackenbergelven near its mouth (where it passes Zackenberg Sta-tion) once every day at 8:00 in the morn-ing. Water samples are analysed for alka-linity (concentration of HCO3), pH, sedi-ment concentrations and conductivity at Zackenberg. All other chemical analyses on water samples from Zackenbergelven are carried out at Institute of Geography, University of Copenhagen.
As an example of data from 2002, the time series for June – August of sediment concentration, pH, conductivity and tem-perature are shown in Figure 3.8. The high concentrations of sediment during the first flood is probably due to the sediment that settled on the river bed during the reces-sion in the late part of the 2001 season be-ing washed out of the system durbe-ing the first event of high water level and current velocities (Rasch et al. 2000). The high con-ductivity during the first days of water discharge (the so-called “ion pulse”) is due to solutes being washed out of the snow package during the first snow melt (Rasch et al. 2000).
All water concentration data from 2002 and earlier years (1997-2001) are available from Institute of Geography, University of Copenhagen ([email protected]).
Due to financial reasons (lack of man-power) it has still not been possible to cal-culate the annual fluxes of sediment, so-lute and organic matter in Zackenbergel-ven.
3.4 Landscape monitoring
Morten Rasch, Charlotte Sigsgaard and Jørgen Hinkler
GeoBasis performs the following monitor-ing of landscape elements and dynamics at Zackenberg:
1. photomonitoring of 24 different
dyn-Figure 3.3. Variation in 2002 of selected climate parameters. From above: Air temperature, relative humidity, air pressure, snow depth, net radiation, incoming short wave radi-ation and outgoing short wave radiation. All param-eters are measured two meters above terrain.
M in: 0 W /m2 M ax: 741 W /m2 M in: 0 W /m2 M ax: 920 W /m2 M in: - 102 W /m2 M ax: 540 W /m2 M in: 955 hPa M ax: 1033 h Pa M in: 27 % M ax: 100 % M in: - 37.7 °C M ax: 14.9 °C 50 100 150 200 250 300 350 Day of Year -40 -30 -20 -10 0 10 20 Ai r t e m p er at u re ( °C) 0 20 40 60 80 100 Re la ti v e H u m id it y ( % ) 950 975 1000 1025 1050 A ir P res su re ( h P a) -200 -100 0 100 200 300 400 500 600 700 N e t R a d ia tio n ( W /m 2) 0 100 200 300 400 500 600 700 800 900 In c o m in g S W R ad . ( W /m 2) 1000 900 800 700 600 500 400 300 200 100 0 O u tg o ing S W R a d. ( W /m 2) 0 0.2 0.4 0.6 0.8 1 1.2 1.4 S n ow d e pt h (m ) -40 -30 -20 -10 0 10 20 0 20 40 60 80 100 -200 -100 0 100 200 300 400 500 600 700 0 100 200 300 400 500 600 700 800 900 1000 900 800 700 600 500 400 300 200 100 0 950 975 1000 1025 1050 Jan Feb M ar Ap r May Ju ne July A ug Sep Oct N ov Dec
0 0.2 0.4 0.6 0.8 1 1.2 1.4 M ax: 1.3 m M in: 0 m Missi ng Data
amic landforms (e.g. rock glaciers, coastal spits, gullies, frost boils), 2. monitoring of the snow cover in
Za-ckenbergdalen with automatic digital cameras,
3. active layer depth measurements on a horizontal site (ZEROCALM-1) and on a sloping site (ZEROCALM-2),
4. soil water chemistry measurements at both active layer depth sites,
5. ice wedge growth measurements at two sites,
6. measurements of cross shore landscape changes (accretion or erosion) at six sites, and
7. measurements of vertical salt marsh accretion at two sites.
Monitoring photos
GeoBasis includes repeated photos of
dif-Table 3.4. Statistics on time series from the TinyTag/TinyTalk datalog-gers operated by GeoBasis. In 2000 new loggers were installed at site P6 (P6-New). These loggers have now pro-duced their first calendar year (2001) of tempera-ture measurements.
1996 1997 1998 1999 2000 2001
Mean Min. Max. Mean Min. Max. Mean Min. Max. Mean Min. Max. Mean Min. Max. Mean Min. Max.
°C °C °C °C °C °C °C °C °C °C °C °C °C °C °C °C °C °C P1 0 cm –7.7 –37.6 29.9 –9.8 –40.7 30.7 –9.1 –40.7 28.1 –9.3 –40.7 30.3 NV NV NV NV NV NV 10 cm NV NV NV –9.6 –39.1 19.1 –8.8 –37.6 17 –8.7 –36.3 19.5 –9.4 –36.3 19.5 –8.7 –36.3 20.2 50 cm –6.7 –25.2 7.3 –9.0 –29.4 8.8 –8.3 –28.4 7.3 –8.3 –27.5 8.8 –9.0 –27.5 8.0 –8.7 –27.5 8.0 118 cm –5.9 –15.6 –0.1 –8.1 –18.3 –0.1 –7.8 –17.6 –0.1 –8.0 –17.0 0.4 –8.1 –18.2 0.4 –8.3 –18.3 –0.1 P2 0 cm –5.6 –30.5 34.1 –7.8 –29.4 25.9 –7.5 –24.1 22 –7.1 –26.6 22.7 NV NV NV NV NV NV 10 cm –6.1 –24.6 12.4 –8.4 –25.7 12.8 –7.9 –21 18.8 NV NV NV NV NV NV NV NV NV 70 cm –6.0 –19.1 2.3 –8.1 –19.6 2.3 –7.2 –17 3.1 NV NV NV NV NV NV NV NV NV 155 cm –6.5 –14.6 –1.4 –8.6 –16.4 –1.8 –8.0 –14.6 –1.8 NV NV NV NV NV NV NV NV NV P3 0 cm –6.2 –31.5 25.2 –9.6 –36.3 23.4 –7.6 –34.8 23.4 –10.5 –36.8 19.8 –8.3 –39.2 32.1 –9.6 –28.8 19.4 10 cm –5.9 –27.5 18.1 –8.6 –32.6 18.8 NV NV NV –9.0 –26.5 15.6 –7.5 –28.3 21.5 –9.0 –25.6 16.5 66 cm –5.5 –20.3 6.9 –8.7 –23.3 6.5 NV NV NV NV NV NV –7.4 –21.5 8.4 –8.5 –20.3 5.9 P4 0 cm –8.5 –33.7 27.0 –10.7 –39.1 27.4 –8.2 –27.5 30.7 –10.9 –32.0 26.3 NV NV NV –9.5 –31.5 22.2 10 cm –8.0 –28.4 16.3 –10.5 –33.7 14.9 –8.0 –24.9 19.1 –10.4 –28.3 14.2 –9.2 –29.4 19.1 –9.4 –28.3 14.8 85 cm –7.6 –18.9 1.9 –10.4 –22.5 1.1 –8.6 –20.3 2.7 –9.7 –19.7 1.0 –9.4 –20.5 1.7 –9.5 –20.2 1.9 P5 0 cm –9.2 –36.0 20.4 NV NV NV –9.9 –33.7 19.1 NV NV NV –9.4 –31.5 18.4 75 cm –8.9 –22.4 11.0 NV NV NV –9.2 –19.6 9.5 NV NV NV NV NV NV 140 cm –8.6 –21.7 11.3 NV NV NV –14.8 –27.5 0.6 NV NV NV NV NV NV P6 0 cm –10.1 –37.6 19.1 –9.5 –32.6 18.4 –8.2 –32.6 24.1 NV NV NV NV NV NV 10 cm –9.9 –25.7 10.6 NV NV NV NV NV NV NV NV NV –9.0 –35.0 12.4 30 cm NV NV NV NV NV NV NV NV NV NV NV NV NV NV NV 60 cm NV NV NV NV NV NV NV NV NV NV NV NV NV NV NV P6-New 0 cm –9.1 –26.9 19.6 10 cm –8.7 –24.1 12.7 30 cm –9.1 –22.8 5.4 50 cm –9.3 –20.1 –0.1 S1 Plateau –8.1 –35.6 25.3 NV NV NV –12.5 –39.1 18.1 –10.0 –39.1 33.3 –10.0 –40.7 31.1 –9.3 –39.1 29.2 Slope/slope high NV NV NV NV NV NV –5.8 –21.7 22.3 –6.5 –17.6 24.1 –5.3 –11.2 21.6 –5.4 –13.0 23.8 Snow/slope low –5.9 –35.2 24.5 NV NV NV NV NV NV NV NV NV NV NV NV –5.5 –13.6 15.5 Below/front NV NV NV NV NV NV –8.0 –32.6 22.3 –13.0 –35.0 14.5 –11.7 –36.3 16.7 –9.9 –32.6 16.7 T1 air –7.3 –33.6 21.6 –9.8 –37.2 23.6 –9.2 –39.1 19.1 –9.8 –37.6 18.4 –10.2 –39.1 24.5 –10.0 –36.3 16.3 T2 air –7.9 –35 20.6 –10.3 –39.1 21.6 –9.8 –40.7 24.5 –11.1 –40.7 18.8 –10.0 –36.3 20.9 –10.5 –39.1 19.5 T3 air –9.2 –36.0 19.8 NV NV NV –10.2 –40.7 20.2 NV NV NV NV NV NV NV NV NV V1 water –2.5 –11.9 8.4 –5.1 –11.8 20.2 NV NV NV NV NV NV NV NV NV NV NV NV V2 water –10.8 –23.8 15.9 –8.0 –27.4 19.4 NV NV NV NV NV NV NV NV NV NV NV NV
ferent dynamic landforms at 24 sites. This part of the photo monitoring has now been running for seven years and except for the pictures of landforms in the coastal zone, there are still no signs of sig-nificant (visible) landscape changes in any of the pictures taken. However, the work-ing effort in takwork-ing the pictures is very limited, and the photo monitoring of dy-namic landforms will therefore be contin-ued at the same time interval as originally decided (pictures are taken once every one or two years). All 24 monitoring pho-tos of dynamic landforms were taken in 2002.
The automatic photo monitoring of the snow cover in the lower part of Zacken-bergdalen was continued in 2002. The photo monitoring is carried out with auto-matic cameras situated on the rock Nansenblokken at 477 m a.s.l. on the mountain Zackenberg west of Zacken-bergdalen. The techniques used for trans-formation of the oblique photos into or-tho-photos, the identification of snow in the photos, and the actual measurements of snow cover were described in details in Sections 3.4 and 5.1 in Caning and Rasch (2000) and in Hinkler et al. (2002).
In the beginning of the 2002 season two of the cameras were out of order. The cam-era taking pictures of the northern part of lower Zackenbergdalen had a defect in its power supply, and the camera taking pic-tures of the southern part of lower Zack-enbergdalen had falled c. 10 meters down from the rock where it is normally situ-ated, during one of the heavy winter storms. Fortunately, it was possible to re-pair the cameras in the early part of the season and to continue measurements. In 2003, it is planned to improve the set-up of the cameras by building a permanent plat-form for the cameras and by improving the internal power supplies with larger ex-ternal power supplies charged with solar panels.
Figure 3.10 shows the snow depletion curves for 1998-2002. As can be seen, the snow cover melted away from
Zacken-50 100 150 200 250 300 350 Day of Year 0 30 60 90 120 150 180 210 240 270 300 330 360 W in d d ir ect io n ( d eg re es) 0 5 10 15 20 25 30 Wi n d s p e e d ( m /s )
Jan Feb Mar Apr May June July Aug Sep Oct Nov Dec
N NE E SE S SW W NW N 0 5 10 15 20 25 30 Min: 0 m/s Max: 24.5 m/s 13.20 13.40 13.60 13.80 14.00 14.20 14.40 14.60 14.80 0 1020304050607080 Q (m3/s) H (m a.s.l.)
Q/H-relation Measurements Measurements 1999, 2000, 2001 and 2002
Q/H-relation for Zackenbergelven
Q=64.36(H-13.45)1.528
Figure 3.6. Variation of river water discharge in Zacken-bergelven, 2002. Discharge Zackenbergelven, 2002 0 20 40 60 80 100 120 140 160 180 160 167 174 181 188 195 202 209 216 223 230 237 244 DOY Discharge, m 3 /s 0,00 50,00 100,00 150,00 200,00 250,00 300,00 350,00
10/jun 24/jun 08/jul 22/jul 05/aug 19/aug 02/sep
Date
Total discharge, mill. m
3
Discharge Total Discharge
Figure 3.4. Variation in wind speed (m/s) and wind direction, 2002. Parameters are measured 7.5 meters above terrain.
Figure 3.5. Water level – discharge relation curve (Q/h-relation) for Zackenbergelven at the hydrometric station, 1995-1998. The coefficient of correlation (R2) for the curve is
0.99. Measurements from the period 1999-2002 indicate that no major changes have occurred to the Q/h-relation since 1998.
Discharge, m
3/s
Total discharge, mill. m
bergdalen early in 2002 compared to all previous years except 2000.
Active layer depth
For different reasons, most of the active layer depth curves for 2001 (Figures 3.13, 3.14 and 3.15) and the reporting of the ac-tive layer measurements for 2001 in Can-ing and Rasch (2003) were erroneous. As a result this section contains a new report-ing of the active layer depth measure-ments for both 2001 and 2002.
The development of the active layer is being monitored at a horizontal, well-drained Cassiope heath at the climate sta-tion (ZEROCALM-1) and at a southerly exposed slope with a snow patch (ZERO-CALM-2). ZEROCALM-1 consists of 121 measuring points in a 100 m x 100 m grid while ZEROCALM-2 consists of 208 mea-suring points in a 120 m x 150 m grid. A detailed description of the plots was given in section 5.1.12 in Meltofte and Thing (1997). The actual measurements of the ac-tive layer is carried out by hand using a metal spear with a centimetre division. Data from the active layer measurements are reported to the circumpolar monitor-ing programme CALM (Circumpolar Ac-tive Layer Monitoring) which is being run by International Permafrost Association.
Figure 3.7. A mast for sampling of precipitation was erected near the cli-mate station in 2002 (Photo Morten Rasch/ Polar Photos). 150 1 60 170 180 190 200 210 220 230 240 250 Day of Year 0 2 4 6 8 150 1 60 170 180 190 200 210 220 230 240 250 0 20 40 60 80 150 1 60 170 180 190 200 210 220 230 240 250 4.5 5 5.5 6 6.5 7 7.5 150 1 60 170 180 190 200 210 220 230 240 250 0 0.2 0.4 0.6 0.8 150 1 60 170 180 190 200 210 220 230 240 250 0 40 80 120 160 0 0.2 0.4 0.6 0.8 5 6 7 0 20 40 60 80 0 2 4 6 8 0 40 80 120 160
Figure 3.8. Water discharge, sediment concentration, pH, conductivity and temperature in Zackenbergelven during the summer of 2002. Note the high sediment concentration during the first flood and the high con-ductivity during the first period of water discharge.
Temperature, °C Conductivity, µS/cm pH Sediment conc., g/kg Water discharge, m¿3 /s
Figures 3.11 and 3.12 shows the active lay-er development in respectively ZERO-CALM-1 and ZEROCALM-2 in the sum-mers 1997-2002.
Figures 3.13 and 3.14 show the 2001 sit-uation with maximum active layer depths at the two sites, measured on respectively 29 August 2001 (ZEROCALM-1) and 22 August 2001 (ZEROCALM-2). Figures 3.15 and 3.16 show the 2002 situation with maximum active layer depths at the two sites, measured on 30 August 2002.
Maxi-Figure 3.9. Photos from the period 1 May – 17 July (one-week intervals) of the lower part of Zacken-bergdalen taken by one of the snow cover moni-toring cameras situated on the rock Nansen-blokken 477 m a.s.l. On 8 May and 5 June fog cov-ered Zackenbergdalen below the camera and on 26 July fog covered the camera. 140 160 180 200 220 240 Day of year 0 20 40 60 80 100 0 20 40 60 80 100
20-May 3-Jun 17-Jun 1-Jul 15-Jul 29-Jul 12-Aug 26-Aug Date
Snow depletion curves Zackenbergdalen 1998-2002 2000 2001 1999 1998 2002
Figure 3.10. Snow depletion curves for the southern part of Zackenbergdalen, 1998-2002. 150 160 170 18 0 19 0 20 0 210 220 230 240 250 Day of year 0 10 20 30 40 50 60 70 80
1-Jun 15-Jun 29-Jun 13-Jul 27-Jul 10-Aug 24-Aug 7-Sep
0 10 20 30 40 50 60 70 80 ZEROCALM-1, 1997-2002 2001 1998 1997 2000 1999 2002 150 160 170 18 0 19 0 20 0 210 220 230 240 250 0 10 20 30 40 50 60 70 80 0 10 20 30 40 50 60 70 80 1-Jun 15-Jun 29- Jun 13-Jul 27- Jul 10-Aug 24-Aug 7-Sep
ZEROCALM-2, 1997-2002 1997 1998 1999 2000 2001 2002
Figure 3.11. Active layer development in ZEROCALM-1, 1997-2002.
Figure 3.12. Active layer development in ZEROCALM-2, 1997-2002. Please note that Figure 3.13 (active layer development in ZEROCALM-2, 1997-2001) in Caning and Rasch (2003) was erroneous.
Snow cover (%)
Active layer depth (cm)
Active layer depth (cm)
mum active layer depth in 2001 was 0.63 m in ZEROCALM-1 (29 August) and 0.60 m in ZEROCALM-2 (22 August). In 2002, the maximum active layer depth mea-sured on 30 August was 0.71 m in ZERO-CALM-1 and 0.60 m in ZEROCALM-2.
The maximum active layer depth in ZE-ROCALM-1 was the highest ever mea-sured, while the maximum active layer depth in ZEROCALM-2 was average. The two sites react very differently, mainly be-cause ZEROCALM-2 is affected by the presence of a large snow patch while ZEROCALM-1 is not.
Soil water chemistry
Soil water samples are collected at differ-ent depths in the active layer at two sites. One site is situated on an Eriophorum fen immediately south of the ZEROCALM-2 site. At this site water is sampled from the depths 5, 10, 15, 20, 30, 40, 50 and 60 cm below the surface. The other site is situ-ated on a Cassiope heath close to the cli-mate station. At this site water is sampled from the depths 5, 10, 15, 20, 30, 40, 50, 60 and 70 cm below the surface. The water samples from the two sites were analysed for pH, conductivity and alkalinity (HCO3-concentration) at Zackenberg and for concentrations of Na, K, Ca, Mg, Fe, Mn, Cl, NO3and SO4) at Institute of Geog-raphy at University of Copenhagen. A
thorough description of the seasonal changes in soil water chemistry at the two sites was given in the annual report for 1999 (Caning and Rasch 2000).
In 2002, the water-sampling site at the Cassiope heath was supplemented with an almost identical set-up situated c. 20 meter away from the original site and with sam-pling at 5, 10, 15, 20, 30, 40, 50 and 60 cm below the surface. Also at the Eriophorum
Figure 3.14. Maximum active layer thickness in ZEROCALM-2, 22 August 2001. Depths are given in cm. Distances between curves are 10 cm. This figure replaces Figure 3.15 in Caning and Rasch (2003).
Figure 3.15. Maximum active layer thickness in ZEROCALM-1, 30 August 2002. Depths are given in cm. Distances between curves are 10 cm.
Figure 3.16. Maximum active layer thickness in ZEROCALM-2, 30 August 2002. Depths are given in cm. Distances between curves are 10 cm. 0 10 20 30 40 50 60 70 80 90 100 Easting (m) 0 10 20 30 40 50 60 70 80 90 100 No rthing (m ) ZEROCALM-1, 29 August 2001
Figure 3.13. Maximum active layer thickness in ZERO-CALM-1, 29 August 2001. Depths are given in cm. Dis-tances between curves are 10 cm. This figure replaces Figure 3.14 in Caning and Rasch (2003).
0 20 40 60 80 100 120 140 Easting (m) 0 20 40 60 80 100 120 Northin g (m) ZEROCALM-2, 22 August 2001 0 10 20 30 40 50 60 70 80 90 100 Easting (m) 0 10 20 30 40 50 60 70 80 90 100 No rthing (m ) ZEROCALM-1, 30 August 2002 0 20 40 60 80 100 120 140 Easting (m) 0 20 40 60 80 100 120 Northin g (m) ZEROCALM-2, 30 August 2002
fen, a new site was installed, but here only with sampling at 10, 20, 30 and 50 cm be-low the surface. It is necessary once in a while to change site for the soil water sam-pling due to the water suction probes clog-ging. When we change sites we normally collect water from both the old and the new sites for at least one year to make sure that the results are comparable.
Two identical sites for monitoring of water content, temperature and water chemistry in the top soils at two of the BioBasis vegetation plots (Salix 1 and Dryas 2) were established by GeoBasis in 2002. At these sites, we will in 2003 and onward measure soil water content twice every week at 5, 10 and 15 cm below the surface, we will measure soil temperature once every hour at 0 and 15 cm below the surface, and we will take water samples once every fourteen days at 5, 10 and 15 cm below the surface.
All water chemistry data from 2001 and earlier years (1996-2000) are available and can be ordered from Institute of
Geogra-phy, University of Copenhagen ([email protected]).
Coastal geomorphology
A map indicating the GeoBasis coastal monitoring sites are given in Figure 3.4.4.1 in Meltofte and Rasch (1998).
Coastal cliff recession is measured at four sites along a coastal cliff on the south coast of Zackenbergdalen, and changes of cross shore profile on an accretionary part of the same coast (a coastal spit) are mea-sured in two cross shore profiles. In 2002, extensive coastal cliff recession was mea-sured in the eastern part of Zacken-bergdalen (Table 3.5). This was probably due to the extremely low extent of drifting pack ice outside Northeast Greenland in 2002 allowing swell to arrive at the shores without being dampened by sea ice. Coastal recession was reported from sev-eral locations in Northeast Greenland dur-ing 2002, and on Hochstetter Forland it re-sulted in the old trapping station Møn-stedhus (founded in 1938) being washed out into the sea.
The cross-shore profiles were not sur-veyed in 2002. The vertical salt marsh ac-cretion will not be measured before ten years after the sites were established (in 1996) due to expected very low rates of vertical salt marsh accretion.
Figure 3.17. In 2002, monitoring of water con-tent, temperature and water chemistry in the top soils at two of the BioBasis vegetation plots were ini-tiated by GeoBasis. The set-up will be ready for measurements in the 2003 field season (Photo Morten Rasch/Polar Photos).
Table 3.5. Total coastal recession at the south coast of Zackenbergdalen in the period 1996-2002.
Recession (m)
Site 1 Site 2 Site 3 Site 4
1996-1997 0 0 0.3 1.0 1996-1998 0 0 0.3 1.3 1996-1999 0 0 0.3 1.3 1996-2000 0 0 0.5 1.4 1996-2001 0 0 0.5 1.4 1996-2002 0 0 0.7 2.8
The BioBasis programme at Zackenberg is carried out by the National Environmental Research Institute (NERI), Department of Arctic Environment, Ministry of Environ-ment, Denmark. It is funded by the Danish Environmental Protection Agency as part of the environmental support program Dancea – Danish Cooperation for Environ-ment in the Arctic. The authors are solely responsible for all results and conclusions presented in the report, and do not neces-sary reflect the position of the Danish En-vironmental Protection Agency.
Part of Line A. Kyhn’s stay and her lem-ming behaviour studies were funded by His Royal Highness Crown Prince Frede-rik’s Foundation.
Details on BioBasis methods and sam-pling procedures are presented in a manu-al (Meltofte and Berg 2003), which is avail-able from the home page of NERI
(http://biobasis.dmu.dk). A map with lo-cality names used in this chapter is found at the same place. Also, a synopsis of the entire BioBasis programme and primary data are presented on the website.
4.1 Spring snow cover, ice
conditions and streams
Hans Meltofte and Jørgen Hinkler
The amount of snow at the start of the melt in late May 2002 was the second highest recorded during our monitoring in Zackenbergdalen (Table 4.1), but the ex-tent of the cover was close to average in early June. In the lowland, the cover was a bit more extensive than average, while on the slopes of Aucellabjerg, cover was less extensive (Table 4.2). Due to the unprece-dented warm weather in late May and June, the clearance of the lowland was as fast as in ‘normal’ years (see also sections 4.2 and 4.3).
Table 4.1. Snow depth at six permanent stations in Zackenbergdalen in late May 1998-2002 given as the highest daily average during 21-31 May. Station nos 0 and 3 are the sonic range sensors at the hy-drometric station and the climate station, respec-tively.
Table 4.2. Area size and snow cover on 10 June in 13 bird and mammal study sections in Zacken-bergdalen and on the slopes of Aucellabjerg 1995-2002 (see Figure 4.1 in Caning and Rasch 2003 for map of sections). Photos were taken from a fixed point 477 m a.s.l. on the east facing slope of Zackenbergfjeldet within +/- 3 days of 10 June. Photos were analysed and data extrapolated according to the methods described by Pedersen and Hinkler (2000). Further-more, the proportions of the areas not visible from the photo point are given. Data from 1995 and 1996 are from satellite images
4 Zackenberg Basic: The BioBasis
programme
Hans Meltofte (editor)
Station 1998 1999 2000 2001 2002 0 – >101 44 79 131 2 – – – 177 265 3 – – – – 205 4 81 118 48 61 110 5 – – – – – 6 – – – – 90
Section Area Area 1995 1996 1997 1998 1999 2000 2001 2002 Mean hidden (km2) (%) 1 (0-50 m) 3.52 3.5 78 74 65 77 91 60 73 77 74 2 (0-50 m) 7.97 1.2 89 88 90 85 91 57 87 87 84 3 (50-150 m) 3.52 0.0 88 81 83 83 94 51 89 82 81 4 (150-300 m) 2.62 0.0 73 74 68 66 86 33 79 56 67 5 (300-600 m) 2.17 0.0 16 54 73 43 85 31 56 36 49 6 (50-150 m) 2.15 75.3 86 86 84 87 98 55 84 78 82 7 (150-300 m) 3.36 69.3 90 81 76 90 97 54 84 74 81 8 (300-600 m) 4.56 27.5 49 55 66 64 84 37 45 52 57 9 (0-50 m) 5.01 6.2 92 87 96 91 97 54 96 96 89 10 (50-150 m) 3.84 2.9 94 85 95 97 98 60 97 93 90 11 (150-300 m) 3.18 0.2 91 72 86 92 96 77* 97 88 89 12 (300-600 m) 3.82 0.0 40 66 89 68 89 65 73 65 69 13 (Lemmings) 2.05 1.0 89 80 76 80 87 58 83 83 80 Total area 45.70 12.9 76 77 81 80 92 54 82 77 77
The melt of the ice on the ponds north and south of the research station and on Lomsø together with start of running wa-ter in the rivulets and Zackenbergelven were among the earliest recorded so far (Table 4.3). Already at our arrival on 31 May, 10-20% open water was present in the ponds in Gadekæret, and by 10 June the monitored ponds were ice-free. Due to the very dry weather during the rest of June and all of July, the most shallow ponds south of the station started to dry up during late July.
On 8 July, all ice had disappeared from Lomsø. The ice melt on Sommerfuglesø and Langemandssø in Morænebakkerne was relatively early, but not as early as in the very early season of 2000 (Table 4.48). On 10 July, Store Sø was 70% covered in ice, but it was breaking up, and on 17 July it had all gone. This is very early.
Already on 1 June, Aucellaelv and some of the streams north-west of it had started to run on the slopes of Aucellabjerg. This is much earlier than recorded before. On 4 June, Zackenbergelven began to run past the research station, and later the same day, both Tørveelv and one of the tribu-taries of Kærelv were running (Table 4.3). During the following days, the remaining rivulets began to run.
When we flew up to Zackenberg on 31 May it was estimated that the edge of fast ice was at least 10 km east of Sandøen. From around 20 June, an open water area formed in Young Sund off Zackenberg-elven, and already on 1 July the fjord ice off Zackenbergdalen had broken up. This is about 1-3 weeks earlier than in previous years (Table 4.3). On 6 July, the open water almost reached Basaltø, and two days later the ice in outer Young Sund had broken up to the extent that it was possible to go by boat out of the fjord. Also the other fjords in Northeast Greenland broke up exceptionally early. Hence, during a flight
on 2 July it was seen that the fjords be-tween Scoresby Sund and Young Sund were either completely or at least predom-inantly ice-free.
Only a little polar drift ice entered Young Sund during the second half of July, and pack-ice was absent off Wollaston For-land for much of the summer. In fact, dur-ing a sea research cruise in September, po-lar pack-ice was not found until 81°N on 15. September (S. Rysgaard pers. comm.). So little ice has not been recorded before during more than 100 years of record (K. Q. Hansen, Ice Charting and Remote Sens-ing Division, Danish Meteorological Insti-tute).
4.2 Vegetation
The weekly records on amounts and phe-nology of flowering etc. were made by Line Anker Kyhn during the entire season. This year, boardwalks were established at small plots, where our traffic during six seasons had started to be visible on the vegetation around the plots. The board-walks are removed after each visit to avoid change of the local microclimatic en-vironment.
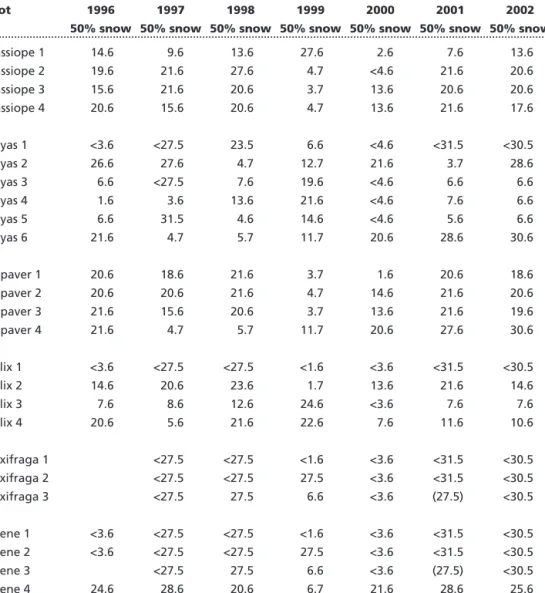
Reproductive phenology, amount of flowering and berry production Hans Meltofte
Due to high spring temperatures (see sec-tions 3.1 and 4.4), snowmelt in flower plots was close to average (Table 4.4) in spite of large amounts of snow (see section 4.1). Flowering was generally among the earliest recorded for white arctic bell-heather Cassiope tetragona, arctic poppy Pa-paver radicatum and arctic willow Salix arc-tica (except 2000) together with some of the mountain avens Dryas sp. plots (Table 4.5). Opening of seed capsules showed a
Table 4.3. Visually esti-mated dates of 50% ice cover on selected ponds and lakes around the research station, together with start of running water in rivers and break up of the fjord ice in Young Sund during 1995-2002. “West pond” and “East pond” are the two ponds in Gadekæret north of the runway, “South pond” is the major pond in Sydkærene south of the runway, “Rivulets” are the streams draining the slopes of Aucellabjerg through Rylekærene, “Zackenbergelven” gives the initial date of major flow in the river, and “Young Sund” is divided between break up of the fjord ice off Zacken-bergdalen and in all of the fjord. The 50% ice cover date for Lomsø is tenta-tive, as it is estimated from the research station.
1995 1996 1997 1998 1999 2000 2001 2002
West pond 4.6 Dry 5.6 10.6 30.5 8.6 2.6
East pond 3.6 Dry 6.6 16.6 1.6 6.6 3.6
South pond <3.6 30.5 7.6 12.6 1.6 8.6 3.6
Lomsø 4.7 2.7 8.7 10.7 1.7 4.7 30.6
Rivulets 6.6 11.6 11.6 15.6 4.6 10.6 4.6
Zackenbergelven <26.5 <3.6 4.6 10.6 20.6 8.6 8.6 4.6
Young Sund (Zac.) 13.7 19.7 14.7 14.7 8.7 13.7 1.7