R E S E A R C H
Open Access
Preferences of physicians for public and
private sector work
Anthony Scott
1*, Jon Helgeim Holte
2and Julia Witt
3Abstract
Background:The public-private mix of healthcare remains controversial. This paper examines physicians’ preferences for public sector work in the context of dual practice, whilst accounting for other differences in the characteristics of jobs.
Methods:A discrete choice experiment is conducted with data from 3422 non-GP specialists from the Medicine in
Australia: Balancing Employment and Life (MABEL) panel survey of physicians.
Results:Physicians prefer to work in the public sector, though the value of working in the public sector is very small at 0.14% of their annual earnings to work an additional hour per week. These preferences are heterogeneous. Contrary to other studies that show risk averse individuals prefer public sector work, for physicians, we find that those averse to taking career or clinical risks prefer to work in the private sector. Those with relatively low earnings prefer public sector work and those with high earnings prefer private sector work, though these effects are small.
Conclusions:Other job characteristics are more important than the sector of work, suggesting that these should
be the focus of policy to influence specialist’s allocation of time between sectors.
Keywords:Public sector, Dual practice, Physicians, Discrete choice experiments, Risk aversion
Background
In many healthcare systems, physicians are able to com-bine work in the public and private sector. Dual practice can be controversial in the context of universal health care that usually aims to provide care that does not de-pend on ability to pay but the need for health care [1]. Physicians choose to allocate their time across both sec-tors based on the institutional setting that governs regu-lations and remuneration, specialty, and conditional on this, physician’s preferences for the characteristics of each work setting. In a mixed public-private system, and where the number of physicians is relatively fixed in the short to medium term because of barriers to entry, phy-sician’s preferences for the amount of time spent in each
sector can influence access to health care, including pub-lic hospital waiting times, as well as expenditures and patient’s health outcomes.
The aim of this paper is to examine physician’s prefer-ences for working in the public or private sector within a given institutional setting that allows dual practice and a rich mix of public and private health care provision and financing. The literature on physician dual practice is largely theoretical and concerned with the nature of the regulation of public and private sector work [1–4]. The drivers of physician’s choices, such as the role of job characteristics, have not yet been examined in detail. Johannessen and Hagen [5] examine associations with physician characteristics such as debt and family size, but did not examine job characteristics. Cheng et al. [6] and Saether [7] focus on the role of earnings on sector choice. We build on these studies by using a discrete choice experiment to capture a much richer set of job characteristics [8, 9]. We also examine risk attitudes © The Author(s). 2020Open AccessThis article is licensed under a Creative Commons Attribution 4.0 International License, which permits use, sharing, adaptation, distribution and reproduction in any medium or format, as long as you give appropriate credit to the original author(s) and the source, provide a link to the Creative Commons licence, and indicate if changes were made. The images or other third party material in this article are included in the article's Creative Commons licence, unless indicated otherwise in a credit line to the material. If material is not included in the article's Creative Commons licence and your intended use is not permitted by statutory regulation or exceeds the permitted use, you will need to obtain permission directly from the copyright holder. To view a copy of this licence, visithttp://creativecommons.org/licenses/by/4.0/. The Creative Commons Public Domain Dedication waiver (http://creativecommons.org/publicdomain/zero/1.0/) applies to the data made available in this article, unless otherwise stated in a credit line to the data.
* Correspondence:[email protected]
1Melbourne Institute: Applied Economic and Social Research, The University of Melbourne, Level 5 FBE Building, 111 Barry Street, Melbourne, VIC 3010, Australia
which have been suggested as a reason why workers pre-fer the public sector to the private sector or to become self-employed [10–14] but have not been examined in the context of physician dual practice.
Methods Setting
There were 1325 hospitals in Australia in 2016/2017, in-cluding 630 private hospitals. Thirty-five percent of beds and 60% of separations were in public hospitals, whilst 59% of all elective surgery is conducted in private hospi-tals [15]. Medicare is Australia’s national tax-financed universal health insurance scheme that subsidises out of hospital medical services (GPs and non-GP specialists), pharmaceuticals, and around 40% of funding for public hospitals. States own and run public hospitals and fund the remainder from their own tax revenues. The govern-ment indirectly subsidises activity in private hospitals through subsidies for private health insurance premiums and through Medicare rebates for patients treated in pri-vate hospitals. Around 45% of the population has pripri-vate health insurance.
Non-GP specialists in Australia can be employed on a salary in public hospitals providing inpatient or out-patient services and, for those who have‘rights to private practice’, can at the same time be self-employed and organised into small businesses. In these private settings, they work in private hospitals providing inpatient ser-vices, and/or in their own offices providing outpatient services, and they can treat private patients in public hospitals. Private non-GP specialists operate on a fee-for-service basis and can charge patients what the mar-ket will bear, and receive no remuneration from private hospitals. There are no price controls. Private patients can claim a fixed subsidy from Medicare, which is a fixed amount as determined in the Medicare Benefits Schedule. This fixed amount is usually lower than the fee charged, and so patients face an out of pocket cost. For patients in private hospitals, this out of pocket cost is insurable by some private health insurers (‘no gap’ cover) though patient eligibility for this cover is at the discretion of the specialist. Specialists who are primarily based in the private sector can choose to work in public hospitals as a contractor (Visiting Medical Officer) where they can be paid a fixed payment per session (typ-ically a 4-h period) or by fee-for-service. The salaries of public hospital non-GP specialists are determined by State-level employer bargaining agreements, so salary scales are fixed, though public hospitals have discretion to pay above the award rates.
A previous study, using the same dataset as this paper, found that 48% of medical specialists combined public and private sector work, 19% worked in the private sec-tor only, and 33% worked in the public secsec-tor only [16].
Public sector specialists are likely to be younger, to be international medical graduates, to devote a higher per-centage of time to education and research, more likely to do after hours and on-call work, and more likely to travel to provide services in other areas, compared to private sector specialists. Dual practice and private sec-tor specialists also have higher annual earnings com-pared to public sector specialists.
Data
A discrete choice experiment was conducted as part of Wave 1 (2008) of the Medicine in Australia: Balancing Employment and Life (MABEL) panel survey of doctors [17]. The MABEL survey included the DCE and was sent to the population of doctors using four surveys: hospital non-specialists, doctors enrolled in specialty training programmes, general practitioners, and non-GP special-ists in clinical practice in Australia in 2008 with 10 498 (19%) doctors responding. Doctors were invited using a personalised mailed letter that included a paper copy of the survey and also a username and password if they wished to fill out the survey online. Three reminders were sent. MABEL includes rich data, including annual earnings and other financial questions, work and job characteristics, hours worked, family circumstances, and geographic location. In this paper, we include doctors who filled out the ‘Specialists’ survey, which includes questions on the hours they work in the public and pri-vate sectors.
DCE design
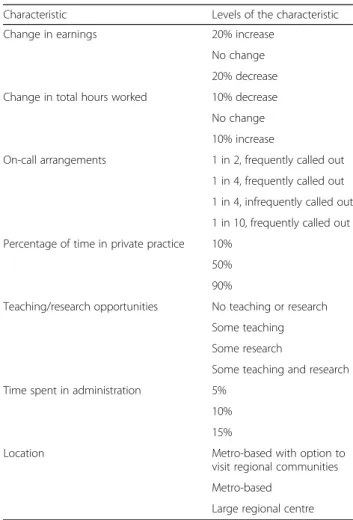
A list of attributes included in the DCE is shown in Table 1, and an example of one DCE question is shown in Fig.1. These were informed by the existing literature and piloting and included attributes most likely to differ between sectors. The questionnaire went through four stages of piloting, including examining face and content validity of the DCEs through face to face interviews with two specialists and a meeting of 12 doctors in specialist training, and a full pilot survey.
The main attribute of interest is the percentage of time spent in private practice. The levels for this attribute are 10%, 50%, and 90%. The latter (50% and 90%) are based on the average hours per week in the private sector of specialists working mainly in private practice [18], and we defined our lower bound (10%) so that specialists who work mainly in the public sector would find this realistic.
The levels of our income attributes are defined as per-cent changes from current income (20% increase, no change, 20% decrease) to avoid having income figures that might be unrealistic for some respondents, such as those working part time [9, 19]. Similarly, hours worked are defined in terms of changes from current hours (10%
increase, no change, and 10% decrease), and these per-centages were obtained from average total hours worked per week across different specialties [18, 20]. Another at-tribute is on-call arrangements, which is a key issue for all specialties [9, 19]. Teaching and research opportunities is included as an attribute, as these are associated with intel-lectual satisfaction and reputation [21]. Time spent doing administrative non-clinical work is another attribute. Any administrative time would mostly generate disutility, but specialists are likely to be willing to trade off doing some administrative work for other perks. Specialists are un-likely to work in rural and remote areas due to lack of in-frastructure (i.e. hospitals). However, specialists can choose between large regional centres and metropolitan areas. Additionally, specialists can also choose to visit rural areas for short periods of time, and there are government specialist outreach programmes to support this financially. SAS was used to generate an efficient fractional factorial experimental design [22]. Zero priors were used to gener-ate the pilot survey as we did not have any other informa-tion. Results from the pilot surveys were used as priors in the experimental design for the main survey [23]. The ex-perimental design produced a fractional factorial design of 36 choices which were randomly assigned to four version of the survey, each with nine choice sets.
Analysis
The specification of the choice model is based on ran-dom utility theory where an indirect utility function is specified and estimated with three alternatives. The util-ityUnijand choice outcomeYnijof physiciannfor alter-nativeifrom choice setjis:
Fig. 1Example of DCE question
Table 1Attributes and levels
Characteristic Levels of the characteristic Change in earnings 20% increase
No change 20% decrease Change in total hours worked 10% decrease
No change 10% increase
On-call arrangements 1 in 2, frequently called out 1 in 4, frequently called out 1 in 4, infrequently called out 1 in 10, frequently called out Percentage of time in private practice 10%
50% 90%
Teaching/research opportunities No teaching or research Some teaching Some research
Some teaching and research Time spent in administration 5%
10% 15%
Location Metro-based with option to visit regional communities Metro-based
Large regional centre
Effects coding is used for the following attributes: on-call, teaching/research opportunities, and location. The teaching/research attribute, which consists of four levels, is dichotomised intononeorsomein the analysis presented here, because constructing the status quo accurately with all four levels was difficult. All the other attributes are treated as continuous variables, and a linear functional form in the respondents’utility function is assumed
Unij¼Xnijβþεnij ð1Þ
for example, Ynij= 1 if Un1j>Un2j&Un1j>Un3j, if al-ternative 1 is preferred to alal-ternatives 2 and 3
n¼1;…N; j¼1;…;J
whereXnijis ak-vector of observed attributes of alterna-tivei, βis a vector of marginal utilities of the attributes, and εnijis i.i.d. extreme value and is estimated using the multinomial logit model. Two job alternatives (A and B) were presented to each doctor, and they were asked which job (A or B) they prefer (forced choice) and then asked which job they would choose: A, B, or their current job (status quo). The latter was included to ac-count for status quo bias. In the analysis, the levels of each attribute in the status quo alternative were con-structed from other questions asked in the survey that represented the doctors’ current job characteristics. For the attributes of earnings and hours worked, a zero-percentage change was used in the status quo alterna-tive. For the percentage of time spent on administration and in the private sector, questions were asked on the actual distribution of working hours across settings (in-cluding public and private) and a separate question asked about the distribution of hours across activities (clinical, non-clinical, management and administration, education and research). The level of on-call for the sta-tus quo alternative was constructed from several ques-tions asking whether the doctor did on-call, how many hours, and how frequently they were called out.
Unobserved heterogeneity in marginal utilities can be modelled using an extension of the multinomial logit, the mixed logit model:
Unij¼Xnijβnþεnij ð2Þ
βn¼~βþηn
whereηnis a vector of mean-zero individual-specific de-viations from the mean marginal utility such thatβnis a vector of individual-specific marginal utilities of each at-tribute with a distribution F(βn;θ) specified by the re-searcher [24]. The vector of parameters θ (the means and standard deviations of the random coefficients βn) characterises the distribution ofβn.We estimate a gener-alised multinomial logit model (G-MNL) [25], which is a mixed logit model that allows for correlation between the parameter distributions of coefficients using a single parameter [26]. Compared to a mixed logit model with uncorrelated coefficients, the GMNL models allows for correlations between the distributions of heterogeneity that is common across all coefficients due to both pref-erence and scale heterogeneity, and so results in an im-proved model fit [26, 27]. Scale heterogeneity is where the variance of the error terms varies across individuals
because of near-lexicographic preferences where mar-ginal utilities for some attributes are very high (i.e. scaled up), or at the other extreme can be due to randomness of behaviour where the idiosyncratic error term domi-nates and an individual is very unsure of their choices. Fiebig et al. [25] argue that the G-MNL model is flexible enough to model data from these‘extreme’respondents, therefore providing a much better fit to the data. The GMNL model is an extension of the mixed logit model by multiplying the error term in (2) according to1/σnor equivalently by multiplying the vector of coefficients by σn:βn¼σnð~βþηnÞwhereσn¼ expðσþτvnÞ,vnNð0 ;1Þ;andσ ¼τ2=2, so there is one extra parameter, τ, to be estimated. Apart from the coefficient for income, which is treated as fixed to aid the calculation of mar-ginal rates of substitution, the coefficients for the remaining attributes are treated as random (using a nor-mal distribution).
To examine the monetary value of private sector work (the compensating differential), we calculate the mar-ginal rate of substitution between the earnings attribute and the private sector attribute. We also calculate these compensating earnings differentials for all other attri-butes using the same methods as in Scott et al. [28]. The measures of risk aversion are discussed in Additional file 1. The measures of risk aversion are interacted with the public-private attribute in the regression model to exam-ine whether preferences for public sector work depend on risk aversion, and whether the magnitude of the mar-ginal utility for the public-private attribute remains stable and statistically significant.
Results
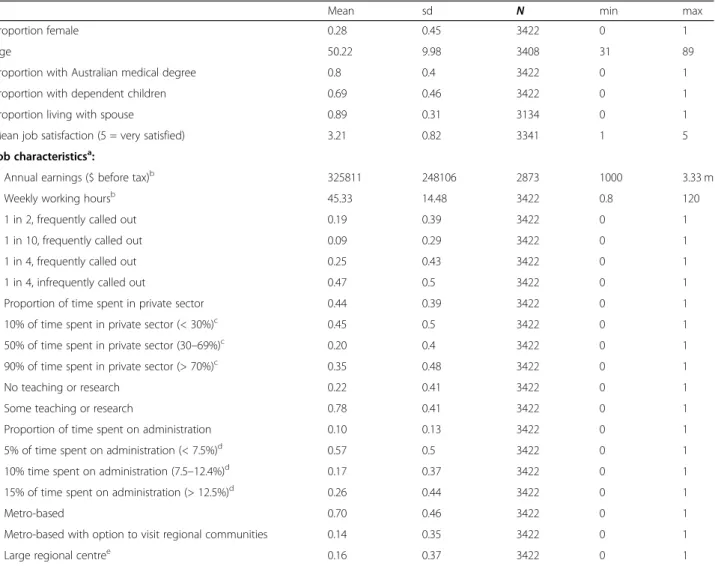
The response rate for specialists was 22.3% (4310/19 579) with a 98.4% contact rate. The final numbers of specialists who completed at least part of the DCE was 3422 with descriptive statistics in Table2. The question-naire was completed online by 27.6% of respondents. Re-spondents were broadly representative of the population of Australian specialists. MABEL respondents were slightly younger (51.2 in MABEL vs 53 years old in population), included more women specialists than the population (26.5% vs 20.6% female), were slightly less likely to come from major cities (major cities 83.7% vs 86.8%: inner regional areas 13% vs 10.6%: outer regional areas 2.7% vs 2.4%: remote areas 0.7% vs 0.2%), and worked an additional 36 min per week (44.4 vs 43.8 h per week).
Table 3 shows the number of times each alternative was chosen (out of 3422 × 9 choice sets = 30 798 choice sets across all respondents) and shows that the status quo was chosen 81% of the time, job A was chosen in 6.5% of the choice sets, and job B in 10.8%.
The results of the GMNL model show this is preferred to a mixed logit model on the basis of the Bayesian In-formation Criteria (BIC) (results available on request). Table 4 shows a strong preference for the status quo (their current job) shown by the large negative
coefficients for the constant terms. The statistically sig-nificant standard deviations for all attributes suggest that the strength of preference for their current job varies across specialists. The signs of the attributes are in the expected direction. Specialists prefer higher earnings, fewer hours, less on-call, more teaching and research op-portunities, less administration, and working in metro-politan areas. For the continuous attributes of earnings, hours worked, percent time in the private sector and percent time in administration, we tested the linearity of each variable (one-by-one) by comparing against models where each of these attributes were re-coded in categor-ies (i.e. non-linear). Likelihood ratio tests confirmed that for each of these attributes the hypothesis of linearity was not rejected.
Table 2Characteristics of specialists responding to the DCE (n= 3422)
Mean sd N min max
Proportion female 0.28 0.45 3422 0 1
Age 50.22 9.98 3408 31 89
Proportion with Australian medical degree 0.8 0.4 3422 0 1
Proportion with dependent children 0.69 0.46 3422 0 1
Proportion living with spouse 0.89 0.31 3134 0 1
Mean job satisfaction (5 = very satisfied) 3.21 0.82 3341 1 5 Job characteristicsa:
Annual earnings ($ before tax)b 325811 248106 2873 1000 3.33 m
Weekly working hoursb 45.33 14.48 3422 0.8 120
1 in 2, frequently called out 0.19 0.39 3422 0 1
1 in 10, frequently called out 0.09 0.29 3422 0 1
1 in 4, frequently called out 0.25 0.43 3422 0 1
1 in 4, infrequently called out 0.47 0.5 3422 0 1
Proportion of time spent in private sector 0.44 0.39 3422 0 1 10% of time spent in private sector (< 30%)c 0.45 0.5 3422 0 1 50% of time spent in private sector (30–69%)c 0.20 0.4 3422 0 1 90% of time spent in private sector (> 70%)c 0.35 0.48 3422 0 1
No teaching or research 0.22 0.41 3422 0 1
Some teaching or research 0.78 0.41 3422 0 1
Proportion of time spent on administration 0.10 0.13 3422 0 1 5% of time spent on administration (< 7.5%)d 0.57 0.5 3422 0 1 10% time spent on administration (7.5–12.4%)d 0.17 0.37 3422 0 1 15% of time spent on administration (> 12.5%)d 0.26 0.44 3422 0 1
Metro-based 0.70 0.46 3422 0 1
Metro-based with option to visit regional communities 0.14 0.35 3422 0 1
Large regional centree 0.16 0.37 3422 0 1
a
Job characteristics are those that are used to construct the levels of the status quo alternative in the DCE based on questions from the MABEL survey
b
For earnings and working hours, the level of the DCE attribute was set to 0% change
c
For the proportion of time spent in the private sector, respondents actual time was allocated to each attribute level in bands, so for example those with less than 30% of their time in the private sector were assigned to the 10% level in the DCE to best represent their actual level
d
For time spent on administration, respondent’s actual time was assigned to each attribute level in bands, so for example respondents who spent less than 7.5% of their time ion administration were allocated to the 5% category in the DCE
e
This level includes all doctors in all non-metropolitan areas: 12.16% in inner regional areas, 2.78% in outer regional areas, and 0.67% in remote areas (based on Australian Standard Geographic Classification: ASGC)
Table 3Choice frequencies
Choice Frequency Percent
Not answered 501 1.6
Job A 2008 6.5
Job B 3339 10.84
Stay at my current job 24 950 81.01 Total choice sets 30 798
On average, specialists prefer to work in the public sector, shown by a negative marginal utility of the per-centage of time spent in private practice. The coefficient measures the effect on utility of a 1% increase in the per-centage of time spent in the private sector. The standard deviation suggests that the marginal utility varies across respondents. Since the coefficient presented is an average of individual specific marginal utilities, these individual marginal utilities were recovered and standardised to have a mean of zero and standard deviation of 1 and are plotted in Fig.2. This has quite a tight distribution with the ma-jority of respondents lying within ± 2 standard deviations of the mean. Fifty-nine percent of specialists prefer
working in the private sector, whilst 41% prefer working in the public sector. However, those preferring the public sector do so more strongly than those preferring the pri-vate sector, such that the mean marginal utility of working in the private sector is negative.
The marginal rate of substitution between private sector work and earnings shows that for a 1% in-crease in the proportion of time spent in the private sector, specialists would need to be compensated 0.057% of their annual income, which is about $186. This can also be expressed in terms of working an extra session (4 h or half a day) in the private sector, representing a more realistic margin. With an average Table 4Results from GMNL model and marginal willingness to pay
Mean (se) SD Marginal WTPd(% annual income) Marginal WTP (AUD$ annual income) Change in earnings 0.096***
(0.004) -Change in hours worked −0.106***
(0.005)
0.057*** (0.006)
−1.10 −$3591
On calla: 1 in 4, frequently called out −0.196*** (0.049)
0.661*** (0.062)
22.24 $72 461
On calla: 1 in 4, infrequently called out 1.118*** (0.069)
0.747*** (0.071)
35.87 $116 885
On calla: 1 in 10, frequently called out 1.416*** (0.062)
0.797*** (0.099)
38.97 $126 976
Percentage of time in private practice −0.006*** (0.001)
0.021*** (0.001)
−0.06 −$187
Teaching/research opportunitiesb: some 0.429*** (0.046)
0.811*** (0.060)
8.90 $28 988
Time spent in administration −0.065*** (0.007) 0.098*** (0.008) −0.67 −$2191 Locationc: Metro-based 0.413*** (0.040) 0.425*** (0.037) 12.83 $41 808
Locationc: Metro-based + option to visit 0.409*** (0.048) 1.042*** (0.070) 12.79 $41 662 Constant (job A) −4.262*** (0.097) 2.155*** (0.099) Constant (job B) −4.190*** (0.089) 1.886*** (0.110) Tau 1.038*** (0.050) Gamma −0.585*** (0.107) Log-Likelihood −12 833 Number of observations 90 891 Chi-sq. (df) 3030 (12)*** AIC 25 716 BIC 25 951 *p< 0.1 **p< 0.05 ***p< 0.01 a
Reference category is‘1 in 2 frequently called out’
b
Reference category is‘none’ c
Reference category is‘large regional centre’ d
specialist spending 44% (19.95 h) of their 45.3 weekly working hours in the private sector, an increase of 4 h per week to 23.95 h represents an increase in the proportion of hours from 44 to 53%. This 9 percent-age point increase would require them to be paid $1680 per year to maintain their utility. This is quite small compared to the average annual income of $325 000 and compared to the value of other attri-butes shown in the last two columns of Table 4. Is the preference for public sector work associated with specialists’characteristics?
To investigate the factors influencing the variation in preferences for public sector work, the standardised measure of the marginal utility in Fig.2is used in an or-dinary least squares (OLS) regression (Table 5). The in-dependent variables focus on aspects of the life/career cycle and include age in 5-year bands, whether they have dependent children, and whether the respondent is an Australian graduate. Separate models are estimated for males and females. Overall, the explanatory power of these models is very low. For men, those aged 65–70 and approaching retirement have a stronger marginal utility for private sector work. This is also the case for women (aged 61–65 years old), but the effect is much stronger than for men. This is likely to reflect a prefer-ence for either boosting retirement income, or more likely a preference for less challenging work as doctors reduce their hours of work before they retire. In addition, female specialists with dependent children have a stronger preference for working more hours in the
private sector. Since we have controlled for income, this is likely to reflect a preference for more autonomy and flexibility over working hours.
We test whether income influences the preference for private sector work by splitting the sample into high-and low-income respondents high-and re-running the models (details and results in Additional file 1). These results suggest that the marginal utility of both earnings and Fig. 2Distribution of standardised marginal utility of the percentage of time in private sector work. Notes: Theβnare distributed according to the distribution functionF(βn;θ,τ) and are the expected values ofβngiven the parameter estimates and the choices made by each individual:E½ βnjYn;Xn; ^θ;^τÞ[29]. Two doctors, who completed the same set of nine choices (Xn) and choose the same alternatives (Yn), will have the same individual-specific estimate of the marginal utilityβn(24)
Table 5Association of life/career cycle factors with the marginal utility of private sector work
Males Females coef se coef se Aged 36–40 −0.049 0.142 −0.024 0.129 Aged 41–45 −0.032 0.138 −0.092 0.129 Aged 46–50 0.058 0.136 −0.007 0.130 Aged 51–55 −0.012 0.136 0.130 0.134 Aged 56–60 0.078 0.140 0.015 0.155 Aged 61–65 0.122 0.142 0.466** 0.197 Aged 65–70 0.257* 0.156 0.395 0.294 Aged 71–75 −0.128 0.186 0.606 0.465 Aged 75–89 −0.073 0.230 0.557 0.644 Has dependent children 0.064 0.057 0.163** 0.070 Australian medical school graduate −0.084 0.055 0.028 0.083 _cons 0.021 0.138 −0.219 0.138
N 2237 870
AdjustedR2 0.002 0.008
private sector work are similar between those with low and high wages and that those with lower wages prefer the public sector and those with higher wages prefer the private sector though these associations are small. Is the preference for public sector work associated with risk attitudes?
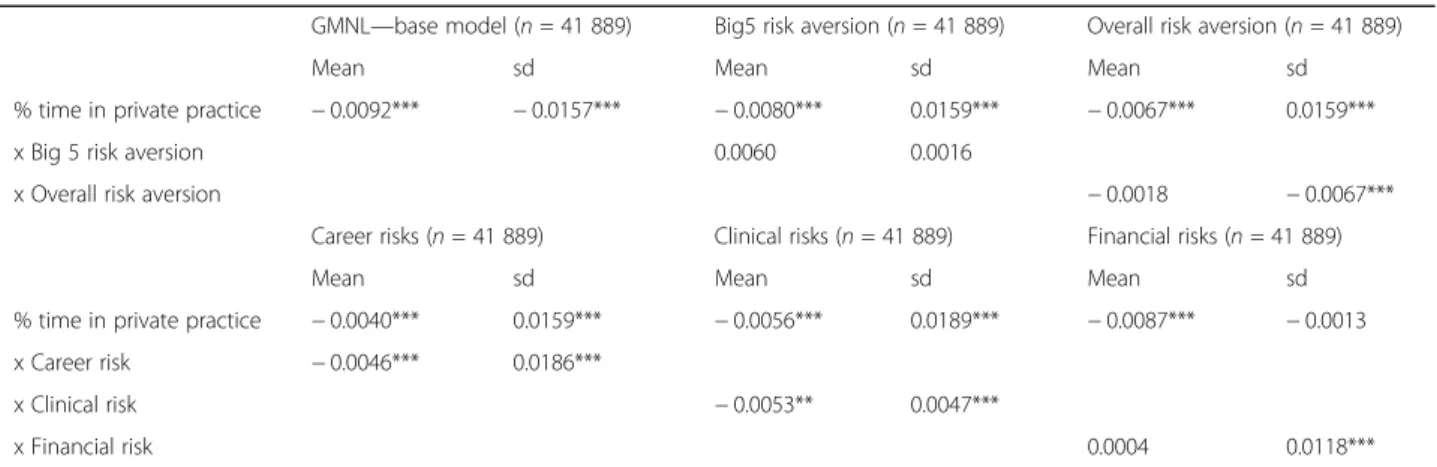
Table 6show the coefficients for the private practice at-tribute and its interaction with each risk aversion meas-ure (full model results available on request). Note that the models including interaction terms have smaller sample sizes (see Additional file 1) since not all respon-dents to Wave 1 responded in Wave 2 (Big 5 risk aver-sion) or in Wave 6 (for risk averaver-sion). The interaction term between the two overall measures of risk aversion and the private practice attribute are not statistically sig-nificant. The domain specific measures show that spe-cialists who are more likely to take career risks prefer to spend more time in the public sector. Although career trajectories are more well-defined in the public sector, there is more tournament-type competition between specialists to work in major teaching hospitals to under-take high-quality research and teaching. This can create more uncertainty and competition when pursuing career options in the public sector. Risk averse doctors prefer the private sector.
Taking clinical risks is also associated with a prefer-ence for more time in the public sector. Since the public sector treats more complex and challenging cases, it makes sense that it would attract doctors who prefer the greater challenges and uncertainty of treating such cases, which are likely to be patients most in need. The inter-action term between the private practice attribute and taking financial risks is not statistically significant. Though there are some associations with risk aversion, the marginal utility of the private sector attribute
remains statistically significant. However, the magnitude of the coefficient is around half that in the base model. This suggests that there is some evidence that risk atti-tudes in specific domains partly explain the observed preference for public sector work, though overall mea-sures of risk attitudes were not statistically significant.
Discussion
This paper provides new evidence on factors influencing the preferences of medical specialists for public or pri-vate sector work. After controlling for the key differ-ences between public and private sector medical jobs, including earnings, as well as risk aversion, the results show only a weak preference towards spending more time in the public sector overall and among low wage earners, and a slight preference for time in the private sector among high wage earners. Doctors averse to clin-ical and career risk have a stronger preference for the private sector, contrary to the existing literature on public-private job choices, but reflecting the particular characteristics of physician’s jobs. Other job characteris-tics that differ between sectors are much more import-ant to specialists than the amount of time spent in the public or private sector. This confirms our previous re-search using revealed preference data on hours worked that found little difference in the marginal utility of pub-lic and private sector work (Cheng et al. [16]).
These results suggest that non-wage factors play a stronger role in sector choice compared to wages and the sector itself. In Australia, medicine is the occupation delivering the highest earnings, and so the marginal util-ity of income for this group is likely to be small relative to lower earning occupations, and there may also be less variation in the marginal utility of income compared to other occupations. Our results also show that risk aver-sion is not only about financial uncertainty, but also Table 6Preferences for time spent in private practice and risk aversion
GMNL—base model (n= 41 889) Big5 risk aversion (n= 41 889) Overall risk aversion (n= 41 889)
Mean sd Mean sd Mean sd
% time in private practice −0.0092*** −0.0157*** −0.0080*** 0.0159*** −0.0067*** 0.0159***
x Big 5 risk aversion 0.0060 0.0016
x Overall risk aversion −0.0018 −0.0067***
Career risks (n= 41 889) Clinical risks (n= 41 889) Financial risks (n= 41 889)
Mean sd Mean sd Mean sd
% time in private practice −0.0040*** 0.0159*** −0.0056*** 0.0189*** −0.0087*** −0.0013 x Career risk −0.0046*** 0.0186***
x Clinical risk −0.0053** 0.0047***
x Financial risk 0.0004 0.0118***
Each GMNL model is the same as in Table4, except for the addition of the single interaction term and reduced sample size *p< 0.1
**p< 0.05 ***p< 0.01
about clinical and career uncertainty, and these may be more important drivers of behaviour.
The conclusions rest on the assumption that we have controlled for all other differences between public and private sector jobs. We included the most important job attributes from the literature, respondents were asked to assume that other factors were the same between jobs, and we examined the role played by risk attitudes. How-ever, we cannot rule out other unobserved factors, though these are only likely to play a minor role. If im-portant, they are likely to reduce the preference for pub-lic sector work to close to zero, strengthening our conclusions that it is the characteristics of the sector ra-ther than a preference for working in the public sector.
A weak preference for the public sector may reflect the culture of medical practice in Australia. For some specialties where only public sector work is possible, or where the norm is dual practice, the amount of time spent in the private sector may be heavily influenced by specialty-specific norms. Our results are therefore likely to vary across specialties though sample sizes by spe-cialty were too small, and there are no specific hypoth-eses about how the results might vary.
We did not include specific tests of‘rationality’or tests of continuity of preferences, such as identifying attribute non-attendance [30–32]. Though we cannot rule this out, unlike many other DCEs completed by patients or the general public where the choice tasks and attributes may be unfamiliar, our sample of doctors are highly edu-cated and very familiar with the attributes presented and so could be less likely to provide ‘irrational’ responses, make errors, or ignore attributes and employ decision heuristics because of the difficulty of the choice task. Our use of a GMNL model does help to more flexibly model unobserved preference and scale heterogeneity compared to a simple mixed logit with uncorrelated co-efficients, and so may capture differences in the error variances across individuals that can reflect the random-ness of responses due to the adoption of different deci-sion rules that are common to all coefficients [25].
Our response rate was 22.3% which is good for a sample of physicians [33]. There were some small differences in age, gender, hours worked, and geographic location, and we cannot observe representativeness with respect to other characteristics (unless they are correlated with ob-served characteristics) that may lead to bias. In particular, if more income-oriented physicians are less likely to fill out surveys and these are more likely to work in the pri-vate sector, then this could bias our results and underesti-mate the strength of preference for private sector work.
Conclusions
In terms of policy conclusions, sector choice is more likely to be influenced by non-wage attributes of public
and private sector jobs, and reductions in clinical uncer-tainty in public hospitals (e.g. through the use of clinical guidelines) could play a role. Specialists seem to be happy with their current balance of hours between the public and private sector. That may be largely because there is no regulation or restrictions about which sector they work in, and so their choices are optimal. Though choices might be optimal for specialists, they might not be for patients. Further research is required as to whether these choices are also socially optimal in terms of the effect of changes in doctors’allocation of time be-tween sectors on patients’health outcomes and costs.
Supplementary information
Supplementary informationaccompanies this paper athttps://doi.org/10. 1186/s12960-020-00498-4.
Additional file 1.The measures of risk aversion.
Abbreviations
MABEL:Medicine in Australia: Balancing Employment and Life; GP: General practitioner; DCE: Discrete choice experiment; G-MNL: Generalised multinomial logit; AMPCo: Australasian Medical Publishing Company; BIC: Bayesian Information Criteria; OLS: Ordinary least squares;
ASGC: Australian Standard Geographic Classification; WTP: Willingness to pay
Acknowledgements
We thank the thousands of doctors who filled out the survey each year and the MABEL research team.
Authors’contributions
AS: conceptualisation, methodology, formal analysis, writing original draft and review and editing, supervision, funding acquisition. JHH: software, formal analysis, writing review and editing. JW: conceptualisation, methodology, formal analysis, writing review and editing. The author(s) read and approved the final manuscript.
Funding
This paper used data from the MABEL longitudinal survey of doctors conducted by the University of Melbourne and Monash University. Funding for MABEL comes from the National Health and Medical Research Council (Health Services Research Grant APP454799: 2008-2011; and Centre for Re-search Excellence in Medical Workforce Dynamics APP1019605: 2012-2016) with additional support from the Department of Health (in 2008) and Health Workforce Australia (in 2013).
Availability of data and materials
De-identified MABEL data are available on application from the Australian Data Archivehttps://dataverse.ada.edu.au/dataverse.xhtml?alias=ada&q= MABEL. The dataset relating to this study that includes the discrete choice experiment is not included in the above due to confidentiality, but the data may be made available on request to the authors.
Ethics approval and consent to participate
The study was approved by The University of Melbourne Faculty of Business and Economics Human Ethics Advisory Group (Ref. 0709559) and the Monash University Standing Committee on Ethics in Research Involving Humans (Ref. CF07/1102–2007000291). There are no conflicts of interest.
Consent for publication
Not applicable.
Competing interests
Author details
1Melbourne Institute: Applied Economic and Social Research, The University of Melbourne, Level 5 FBE Building, 111 Barry Street, Melbourne, VIC 3010, Australia.2FAFO Institute for Labour and Social Research, Borggata 2B, 0608 Oslo, Norway.3Department of Economics, University of Manitoba, Winnipeg, MB R3T 5V5, Canada.
Received: 17 March 2020 Accepted: 23 July 2020
References
1. McPake B, Russo G, Hipgrave D, Hort K, Campbell J. Implications of dual practice for universal health coverage. Bull World Health Organ. 2016;94(2): 142–6.
2. Eggleston K, Bir A. Physician dual practice. Health Policy. 2006;78(2–3): 157–66.
3. González P, Macho-Stadler I. A theoretical approach to dual practice regulations in the health sector. J Health Econ. 2013;32(1):66–87. 4. Socha KZ, Bech M. Physician dual practice: a review of literature. Health
Policy. 2011;102(1):1–7.
5. Johannessen K-A, Hagen TP. Physicians’engagement in dual practices and the effects on labor supply in public hospitals: results from a register-based study. BMC Health Serv Res. 2014;14(1):299.
6. Cheng TC, Kalb G, Scott A. Public, private or both? Analyzing factors influencing the labour supply of medical specialists. Canadian Journal of Economics/Revue canadienne d'économique. 2018;51(2):660–92.
7. Saether E. Physicians’labour supply: the wage impact on hours and practice combinations. Labour. 2005;19(4):673–703.
8. Mandeville KL, Lagarde M, Hanson K. The use of discrete choice experiments to inform health workforce policy: a systematic review. BMC Health Serv Res. 2014;14(1):367.
9. Scott A. Eliciting GPs’preferences for pecuniary and non-pecuniary job characteristics. J Health Econ. 2001;20:329–47.
10. Buurman M, Delfgaauw J, Dur R, Van den Bossche S. Public sector employees: risk averse and altruistic? J Econ Behav Organ. 2012;83(3): 279–91.
11. Dohmen T, Falk A, Huffman D, Sunde U, Schupp J, Wagner GG. Individual risk attitudes: measurement, determinants, and behavioral consequences. J Eur Econ Assoc. 2011;9(3):522–50.
12. Falk A, Becker A, Dohmen T, Enke B, Huffman D, Sunde U. Global evidence on economic preferences*. Q J Econ. 2018;133(4):1645–92.
13. Caliendo M, Fossen F, Kritikos AS. Personality characteristics and the decisions to become and stay self-employed. Small Bus Econ. 2014;42(4): 787–814.
14. Zhao H, Seibert SE. The big five personality dimensions and entrepreneurial status: a meta-analytical review. J Appl Psychol. 2006;91(2):259.
15. AIHW. Australia’s hospitals at a glance. Australian Institute of Health and Welfare: Canberra; 2018.
16. Cheng TC, Joyce CM, Scott A. An empirical analysis of public and private medical practice in Australia. Health Policy 2013;111(1):43-51.
17. Joyce CM, Scott A, Jeon S-H, Humphreys J, Kalb G, Witt J, et al. The "Medicine in Australia: Balancing Employment and Life (MABEL)" longitudinal survey - protocol and baseline data for a prospective cohort study of Australian doctors’workforce participation. BMC Health Serv Res. 2010;10(1):50.
18. ABS. Private medical practitioners, report no. 8689.0. Canberra: Australian Bureau of Statistics; 2002.
19. Ubach C, Scott A, French F, Awramenko M, Needham G. What do hospital consultants value about their jobs? A discrete choice experiment. Br Med J. 2003;326:1432.
20. AIHW. National health labour force series, medical labour force 2003. Canberra: Australian Institute of Health and Welfare; 2003.
21. Borges NJ, Navarro AM, Grover A, Hoban JD. How, when, and why do physicians choose careers in academic medicine? A literature review. Acad Med. 2010;85(4):680–6.
22. Carlsson F, Martinsson P. Design techniques for stated preference methods in health economics. Health Econ. 2002;12:281–94.
23. Kuhfeld WF. Marketing research methods in SAS: experimental design choice, conjoint, and graphical techniques. SAS 9.1 Edition TS-722. 2005. 24. Train KE. Discrete choice methods with simulation. 2nd ed. New York:
Cambridge University Press; 2009.
25. Fiebig DG, Keane MP, Louviere J, Wasi N. The generalized multinomial logit model: accounting for scale and coefficient heterogeneity. Mark Sci. 2010; 29(3):393–421.
26. Hess S, Train K. Correlation and scale in mixed logit models. Journal of Choice Modelling. 2017;23:1–8.
27. Hess S, Rose JM. Can scale and coefficient heterogeneity be separated in random coefficients models? Transportation. 2012;39(6):1225–39.
28. Scott A, Witt J, Humphreys J, Joyce C, Kalb G, Jeon SH, et al. Getting doctors into the bush: general practitioners’preferences for rural location. Soc Sci Med. 2013;96:33–44.
29. Greene W. NLOGIT version 4.0. Referecne guide. New York: Econometric Software Inc; 2007.
30. Lagarde M. Investigating attribute non-attendance and its consequences in choice experiments with latent class models. Health Econ. 2013;22(5): 554–67.
31. Hole AR. A discrete choice model with endogenous attribute attendance. Econ Lett. 2011;110(3):203–5.
32. Scott A. Identifying and analysing dominant preferences in discrete choice experiments: an application in health care. J Econ Psychol. 2002; 23(3):383–98.
33. Scott A, Jeon S-H, Joyce C, Humphreys J, Kalb G, Witt J, et al. A randomised trial and economic evaluation of the effect of response mode on response rate, response bias, and item non-response in a survey of doctors. BMC Med Res Methodol. 2011;11:126.
Publisher’s Note
Springer Nature remains neutral with regard to jurisdictional claims in published maps and institutional affiliations.