Hosting Customer Clustering Based On
Log Web Server Using K-Means Algorithm
Mutiara Auliya Khadija
, Wiranto, and Abdul Aziz
Universitas Sebelas Maret, Surakarta, Central Java, Indonesia.Abstract—To compete in global industries, a company must have a good business strategy. Especially for domain and hosting company that has many competitors there. The business strategy could be found with hosting customer behavior based on log web server analytics. The most important log web server associated with customer access is recorded in the access.log file. Potential customers were read from access activity in the form of request method /pesan on access.log. One of popular method for data mining from log server is Clustering with K-Means Algorithm. This algorithm was chosen because K-Means has a fast execution time, easy to implement, and good for a big numeric data. The evaluation technique determining the optimal value of K is used Elbow Method and the Calinski Harabasz Index. K-Means algorithm can be used to determine the pattern of hosting customers based log web server. The results of this research indicate that the clustering process based on web server log with K-Means Algorithm can be used to know the pattern of customer hosting. There are total 5 clusters for data by week and data access time. The pattern of hosting customers that are formed in ordering a succession of clusters 1,2,3,4,0. The most ordered areas are Jakarta in cluster 1, Bandung Semarang, Surabaya on cluster 2 and Medan, Tangerang, Malang, Yogyakarta on cluster 3. The frequency of booking is mostly done at the beginning of the month at 12.00 - 23.59. This customer behavior could be a reference to know the best business strategy to expand the marketing in cluster 4 and 0 and help any other stakeholder for making some policy to develop the company.
Index Terms—Data Mining; Clustering; Hosting Customer K-Means Algorithm; Log Web Server.
I. INTRODUCTION
In this global area, the website is important for changing information. Websites cannot be standing alone without domain and hosting provider [1]. In Indonesia, there are lots of domain and hosting provider, one of them is DomaiNesia. DomaiNesia is a domain and hosting provider that focuses on the service quality without compromising cost efficiency [2]. Increasing the number of website in Indonesia caused the customer of domain and hosting provider has grown up. Needs some method for compete and struggle from the competitors. One method that could be used is analysis the hosting customer behaviours [1]. Customer behaviours is a behaviour that consumers consider in searching, buying, using, evaluating and ignoring products, services, or ideas that are expected to satisfy consumers [3]. Customer behaviour analysis could be used to develop business strategy, helping the stakeholder for making some policy, and to distributing ideas between customer [4].
Domain and hosting provider use website as the main media for selling. So, their website has some log web server. Log web server contains data about what happens to the
server. One of them is access.log that could be found IP address, time access, request method and status code [5]. Finding and processing information from website services can be done by web mining. There are several types of web mining, one of them is web usage mining which is a data mining technique to find the interaction between website visitors through weblog data [6]. Web usage mining could be processing by clustering method. Clustering is a method for creating groups of objects or clusters, in which very similar objects are inserts in a single cluster. One of a popular method for data mining from log server is clustering with K-Means Algorithm. K-K-Means Algorithm is a clustering method of the data with partition system and good for big numeric data[7]. According to this problem, so it is required a clustering based web server log using K-Means Algorithm to find out customer hosting behaviours to formulate and decide the business strategy for the company.
II. LITERATURE REVIEW A. Clustering
Clustering is a method for creating clusters of objects or clusters, such that very similar objects are inserted in one cluster whereas objects in different clusters have quite distinct differences [7]. There are two methods, Hierarchical Clustering and Partitioning Clustering. Hierarchical Clustering for grouping data to be a hierarchy. Partitioning Clustering is cluster method that decided the number of clusters first [8].
B. K- Means Algorithm
The K-Means algorithm is one of the partitional algorithms because of K-Means based on determining the initial number of groups by defining the initial centroid value. The K-Means algorithm is efficient in clustering with big data. But, it depends on cluster centre and numerical data. Step by step of K-Means Algorithm:
1. Arbitrarily choose k objects from the access.log. 2. Find the number of users frequently by calculating the
mean value.
3. Calculate the distance between the centroid with each record in the dataset. To calculate the distance between centroid with each record using Euclidean Distance. 4. Reassign each object to the cluster to which the object
is most similar based on mean value. 5. Update the cluster means often.
6. Similarly group dissimilar the objects in another cluster.
There are several methods for deciding the number of the cluster such as Elbow Method, AIC, BIC, DIC. The elbow criterion is a common rule of thumb to determine what
number of clusters should be chosen. In the Elbow Method, the K value taken represents a significantly decreased value and forms the elbow [8]. To analyse the value of K used has been optimal, then tested. There are two tests of internal and external testing. Internal tests include the Silhouette Index, Calinski- Harabasz Index, Davies Bouldin Index. The Calinski and the Harabasz Index are the most commonly tested averages between the sum of square (Bk) and within the sum of square (Wk) [9].
C. Log Web Server
Log Web Server could be used to analyse what, when and who accessed the website. There are 3 log web servers, server.log, acess.log and error.log [10]. There are two formats of log web server that is Common and Combines Log Format.
(%h) : IP Address Host (%l) : Client Identity (%u) : userid
(%t) : time server accessed the page (\"%r\") : Request Method
(%>s) : status code (%b) : Byte
Access.log is a file that records every access on the web server. This log is usually used to analyse if things happen in the server. Access.log can be used to obtain user behaviour patterns. The attributes used are IP Address, Time Server, Request Method and status code [11].
D. User Behavior
Customer pattern is a pattern or pattern formed from a user activity [3]. In relation to this research that is about the activity of website access on the internet [12].
III. METHODOLOGY
The following methodology for doing the research on customer hosting clustering based weblog server using K-Means Algorithm.
A. Data Collection
At this step, collect raw data from access.log. The web server log used is the access.log server of www.domainesia.com. Access.log of Apache server used is logged web server from January 1 to February 25, 2017. Furthermore that required is data of IP Address in every region. For this data, a database of MaxMind GeoLite is used as Figure 1.
Figure 1: Raw Data Log Server B. Preprocessing
At this step, the data that has been collected will be selected, cleaned and transformed so that the data is ready for clustering. The stages are,
1. Data Cleaning
Data cleaning aims to dispose of damaged data and clean from twin data and outliers
2. Attribute Selection
The attributes required in access.log are IP address, time, request method and status code
3. Pattern Discovery
Pattern Discovery is a process for grouping some data into specific classes based on similarity of properties. To be able to know the pattern of customers in order, then required page /pesan as Figure 2. Then do data analysis to know geolocation data from each IP Address, data analysis to see customer behaviour in ordering for eight weeks in one region, as well as data analysis to see customer behaviour in order based on access time. Data segmentation based on access time will be divided into 4-time categories for each region.
Figure 2: Request Method /pesan C. Clustering
The data that has been processed by preprocessing, then analysed using K-Means Algorithm. The clustering process is done by the steps in K-Means Algorithm using the system. The system is built with Python 2.7.
D. Analysis Data
In the data analysis could be seen clustering results web server log. The observed pattern is the pattern of customers who place orders based on weeks and times of access. After that is done testing to prove whether the cluster is optimal.
IV. RESULT A. Data Description
The data is access.log webserver of www.domainesia.com from January 1 to February 25, 2017. After that take some attributes such as IP address, time, request method and status code. The total data access.log that is processed in January as many as 17,444 data and in February as many as 15,503 data. Binding IP Address data with each region can be done by using the MaxMind database of GeoLite and Geolocation command in Linux.
B. Preprocessing
At this step, the data will be processed with several stages ie data cleaning and attribute selection. Then, the data will be searched for the pattern by selecting the page /pesan to identify the ordering. Based on IP address that located at access.log page /pesan then grab the data geolocation using the database from MaxMind and combined with Linux geolocation commands. The results of the grab process among others are state, regional, city, longitude and latitude as Figure 3.
After that, data area/city of each IP Address will be accumulated and grouped by week and based on access time. For grouping per week, the data will be grouped into 8 weeks (M1- M8) with details such as Table 1.
Figure 3: Result of Grab IP Address Table 1
Data Details by Week Weeks
(M1-M8) Duration M1 (Week 1) 1 January- 7 January 2017 M2 (Week 2) 8 January - 14 January 2017 M3 (Week 3) 15 January - 21 January 2017 M4 (Week 4) 22 January - 28 January 2017 M5 (Week 5) 29 January - 4 February 2017 M6 (Week 6) 5 February - 11 February 2017 M7 (Week 7) 12 February - 18 February 2017 M8 (Week 8) 19 February - 25 February 2017
Here are some sample data after preprocessing process for grouping each week with total data as a whole that is 19,732 data seen in Table 2
Table 2 Sample Data by Week
Region M1 M2 M3 M4 M5 M6 M7 M8
Banda Aceh 5 3 1 7 1 2 6 7
Bandung 208 142 130 138 114 143 145 151
As for grouping based on access time, data will be categorised into four access times with details such as Table 3.
Table 3
Data Details by Access Time Time Category Time Duration
Time I 00.00 - 05.59 Time II 06.00 – 11.59 Time III 12.00 – 17.59 Time IV 18.00 – 23.59
The data after preprocessing process with total data as a whole for grouping each access time is 18,937 shown in Table 4.
Table 4
Data Examples by Access Time Name of Region Time Duration
Time 1 Time 2 Time 3 Time 4
Banda Aceh 4 7 12 20
Bandung 171 370 476 339 After that, the two data will be added provincial name along with latitude and longitude used for visualisation of clustering.
C. Clustering
The preprocessing dataset is then clustered using K-Means Algorithm. For the implementation of k value using Elbow Method. For a selection of random value experiment with seed = 10. The first thing is to determine the value of k first with experiment k = 2 to k = 10 with a random value (seed) as much as 10. Then will be calculated the distance between centroid by using Euclidean Distance. To determine the optimal k value, this research uses Elbow Method. In Elbow Method, the value of the cluster to be taken is a value that has
decreased significantly and formed the elbow. The value of k for data by week is seen in figure 4 while for data based on access time shown in graphic figure 5. Graph in Elbow Method is a graph formed by comparison of SSE value (Sum of Square Error).
Figure 4: SSE Chart of Elbow Method Based on Sunday
Figure 5: SSE Chart Elbow Method Based on Access Time Figure 4 shows the elbow that is at k = 5. While in the figure 5 that form the elbow is at k = 5. For that, both data use k = 5.
D. Data Analysis
Based on the clustering obtained cluster value of 5 of each data. The value of means centroid using k = 5 on the dataset by week is seen in Table 5.
Table 5
Cluster Result Based on Sunday
Cluster Based on Week
M1 M2 M3 M4 M5 M6 M7 M8 0 4.0 2.3 2.4 1.7 2.5 1.6 2.2 2.09 1 812 676 1145 813 1831 1245 1818 515 2 197 168 138.6 126 116 145.3 122.6 117.6 3 77 50 55.25 44 54 55.5 34.5 37.75 4 25.7 19.7 14.5 16.8 17.2 13.5 16.5 15.72 Based on Table 5, customers who are in cluster 0, 2, 3 and cluster 4 often make purchase on Week 1. For customers in cluster 1, often make purchase on Sunday 5. Based on the value of means centroid generated from Sunday 1 to Sunday 8 has the largest value is cluster 1, and the smallest is cluster 0, while the value of means centroid using k = 5 on the dataset based on access time is seen in Table 6.
Table 6
Cluster Results Based on Access Time
Cluster Based on Time Access
Time I Time II Time III Time IV 0 2.22 3.91 6.28 5.83
1 937 2120 2887 2455
2 150.6 335.6 468.3 367.6 3 66.4 76.2 140.6 164.4 4 11.73 29.08 42.47 36.78
Based on Table 6, customers who are in clusters 0, 1, 2 and four often make purchase at time III (12:00 to 17:59). While on cluster 3 often make reservations at the time IV (at 18:00 to 23:59). From the means centroid generated, from time I to time IV which has the greatest value is cluster 1 and the lowest is in cluster 0.
The comparison of each cluster object from each data is shown in Figure 6.
Figure 6: Comparison Object Every Cluster
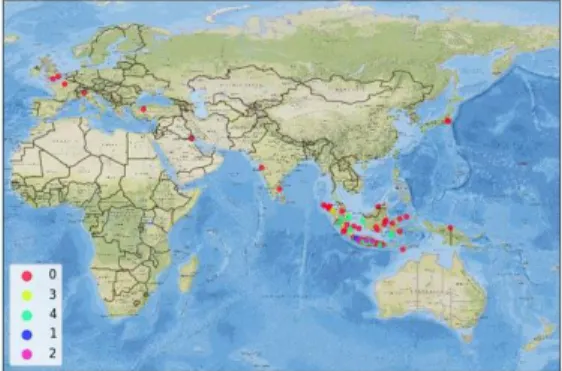
Having known the spread of each cluster object can be visualised in the map as shown in Figures 7 and 8.
Figure 7: Clustering Map of Hosting Customer Based on Week
Figure 8: Clustering Map of Hosting Customer Based on Time Access
In the two pictures, there are differences in cluster members shown in Table 9.
Table 9 Differences of Cluster Region Cluster differences
Week based Time-based
Padang 0 4 Pekanbaru 0 4 Batam 0 4 Klaten 0 4 Nganjuk 0 4 Porong 0 4 Boydton 0 4 Magelang 4 0 Singapore 4 3 E. Testing
The test is performed to prove whether the value of k = 5 that has been determined in the Elbow Method is the optimal cluster value or not. The tests were performed using the Calinski and Harabasz Index. The Calinski and Harabasz Index is one of the tests based on the average between the sum of square (Bk) and within the sum of square (Wk). Where k is the total cluster and N is total of data.
(1) The highest score is the optimal number of clusters [9]. Calinski and the Harabasz Index are among the best tests in addition to Silhouette and PBM [13]. Based on this test, the highest score is at k = 5 for each data. In the data based on the week obtained the highest score at k = 5 with the value 2876.357305, while the data based on access time got the highest score at k = 5 with the value 2764.113903. This is by the initial determination using the elbow method.
V. CONCLUSION
Based on the results of research can be concluded that clustering web server log by using K-Means Algorithm can be used to see the pattern of hosting customers with the most optimal cluster value for both data that k = 5. The clustering results obtained are the most hosting customers who make purchases respectively located in clusters 1, 2, 3, 4, 0. The most ordered regions are Jakarta in cluster 1, then Bandung, Semarang, Surabaya on cluster 2, then Medan, Tangerang, Malang, Yogyakarta in cluster 3. The frequency of ordering at most on Sunday 1 is cluster 0, 2, 3, 4 and Sunday 5 for cluster 1. While the frequency of ordering based on access time at most time category III (at 12.00-17.59) that is cluster 0, 1, 2, 4 and IV time (18.00-23.59) for cluster 3. The most frequent ordering frequency is at the beginning of the month and in productive hours is 12.00 - 23.59. A business strategy that can be formulated based on this research is the company can expand marketing on cluster 4 and cluster 0. The company can hold promo discount or auction domain / hosting in the area at 12.00 until 23:59. At that time, the company can add CS and TS. Also, the balance domain hosting should also be considered.
REFERENCES
[1] K. Hans-Ruediger, Handbook of Research on Managing and Influencing Consumer Behavior. IGI Global, 2014.
[2] “Tentang DomaiNesia.” [Online]. Available: https://www.domainesia.com/about/. [Accessed: 26-Jun-2017]. [3] L. G. Schiffman and L. L. Kanuk, Consumer Behavior [With 2 Volumes
of Cases]. Pearson College Division, 2006.
[4] Rangkuti. F, Riset Pemasaran. Gramedia Pustaka Utama, 2001. [5] G. Sreedhar, Web Data Mining and the Development of
Knowledge-Based Decision Support Systems. IGI Global, 2016.
[6] B. Liu, Web Data Mining: Exploring Hyperlinks, Contents, and Usage Data. Springer Science & Business Media, 2011.
[7] G. Gan, C. Ma, and J. Wu, Data Clustering: Theory, Algorithms, and Applications. SIAM, 2007.
[8] I. H. Witten, E. Frank, M. A. Hall, and C. J. Pal, Data Mining: Practical Machine Learning Tools and Techniques. Morgan Kaufmann, 2016.
[9] Y. Liu, Z. Li, H. Xiong, X. Gao, and J. Wu, “Understanding of Internal Clustering Validation Measures,” IEEE Int. Conf. Data Min., vol. 10, 2010.
[10] K. Senthil A. V., Web Usage Mining Techniques and Applications Across Industries. IGI Global, 2016.
[11] D. Racha, “Web Usage Mining For extracting Users’ Navigational Behavior,” Int. J. Eng. Comput. Sci., vol. 3, no. 5, pp. 5989–5995, 2014. [12] D. A. Menascé and V. A. F. Almeida, Scaling for E-business: Technologies, Models, Performance, and Capacity Planning. Prentice Hall Professional, 2000.
[13] L. Vendramin, R. J. G. B. Campello, and E. R. Hruschka, “Relative Clustering Validity Criteria: A Comparative Overview,” Wiley Period. Inc Stat. Anal. Data Min., vol. 3, pp. 209–235, 2010.