Building Business Intelligence & Analytics
Capabilities - A Work System Perspective
Completed Research Paper
Martin Fadler
Faculty of Business and Economics
(HEC), University of Lausanne
1015 Lausanne, Switzerland
[email protected]
Christine Legner
Faculty of Business and Economics
(HEC), University of Lausanne
1015 Lausanne, Switzerland
[email protected]
Abstract
Although enterprises believe that they can achieve a competitive advantage with big data and AI, their analytics initiatives’ success rate still lags behind expectations. Existing research reveals that value creation with business intelligence and analytics (BI&A) is a complex process with multiple stages between the initial investments in BI&A resources and ultimately obtaining value. While prior research mostly focused on value generation mechanisms, we still lack a thorough understanding of how enterprises actually build BI&A capabilities. We explain the process in our research using work system theory (WST). Based on case studies and focus groups, we identify four prevalent BI&A capabilities: reporting, data exploration, analytics experimentation, and analytics production. For each identified BI&A capability, we derive patterns for BI&A resource orchestration, using the WST lens. Our findings complement the BI&A value creation research stream by providing insights into capability building.
Keywords: Business Intelligence, Analytics, Big Data Analytics, Capability Building, Resource Orchestration, Work System Theory
Introduction
Digital applications and connected devices create an ever-increasing amount of data (Chen et al. 2012), a phenomenon known as big data. This phenomenon, combined with major breakthroughs in data infrastructure technologies and with artificial intelligence (AI) proliferation, allows enterprises to identify new data monetization opportunities, which have resulted in improved existing business processes, while simultaneously innovating and creating new business models (Wixom and Ross 2017). Although enterprises believe that they can achieve a competitive advantage with big data and AI (Ransbotham et al. 2019; Ransbotham and Kiron 2017), their analytics initiatives’ success rate still lags behind expectations and many struggle to obtain a return on investment (Davenport and Bean 2019; Grover et al. 2018; Shim and Guo 2015). This lag raises fundamental questions about how investments in analytics create business value and reflects the ongoing debate on information systems’ (IS) overall business value (Kohli and Grover 2008; Schryen 2013).
In the context of business intelligence and analytics (BI&A), researchers have analyzed value creation by using different theoretical lenses with various focuses and scopes, including business intelligence systems (Trieu 2017), business analytics (Seddon et al. 2017), and big data analytics (Grover et al. 2018). These studies identify how BI&A creates organizational and strategic value for enterprises, but also reveal that value creation materializes by means of complex processes from initial investments in analytics resources in order to obtain the actual value. While this stream of research provides important insights into the
relationship between resources, capabilities, and value creation, its focus is mainly on the value generation mechanisms. With reference to the research framework by Grover et al. (2018) research framework, the capability building process has received far less attention than the capability realization process. Consequently, “little is known so far about the processes and structures necessary to orchestrate these resources into a firm-wide capability” (Mikalef et al. 2018, p. 569).
To address this gap, we ask the following research question:
How do enterprises build business intelligence and analytics capabilities?
In line with literature, we use BI&A as unifying term to designate “the techniques, technologies, systems, practices, methodologies, and applications that analyze critical business data to help an enterprise better understand its business and market and make timely business decisions” (Chen et al. 2012). We consider big data analytics (BDA), resulting from increasing data volumes and variety, evolving data infrastructure technologies and the proliferation of artificial intelligence, as evolution of BI&A or “BI&A 3.0” (Chen et al. 2012).
To explain how BI&A capabilities are built, our research uses a work system theory (WST) lens (Alter 2013), which “[…] replaces the prevailing system-as-technical-artifact perspective with a genuine system perspective for focusing on IT-reliant systems in organizations” (p. 74). Based on a multi-method research approach (Venkatesh 2016) comprising case studies and focus groups, we identify four prevalent capabilities in the BI&A context: reporting, data exploration, analytics experimentation, and analytics production. In respect of each identified BI&A capability, we derive BI&A resource orchestration patterns by analyzing data collected from the field through a WST lens. Our findings complement the research stream on BI&A value creation with insights into capability building. The findings also contribute to addressing the questions outlined in the research agenda by Grover et al. (2018) with regard to building BDA capabilities, i.e. the ability to integrate, disseminate, explore, and analyze big data. Our results not only inform the academic research community, but are also relevant for practitioners, who can use the identified BI&A work systems to define roles, processes, and technologies, thereby laying the foundation for value generation with BI&A.
The remainder of this paper is structured as follows: first, we summarize the existing research on BI&A and identify the research gap. Second, we outline our multi-method research design and the WST’s theoretical lens. Third, we use WST to identify BI&A capabilities and the corresponding capability building process. Afterwards, we discuss our findings, which leads to our conclusion and outlook for future research.
Background
Since electronic data processing’s early beginnings, digital data have been analyzed to improve businesses’ efficiency and effectiveness. The field has evolved continuously, currently encompassing traditional approaches to business intelligence (Chen et al. 2012), as well as innovative ways of analyzing big data and enabling AI (Davenport 2018). In recent years, researchers have created a fundamental understanding of BDA as an emerging field. This understanding has resulted in studies clarifying BDA concepts, technologies, and applications (Watson 2014, 2019), as well as integrating BDA into the broader BI&A field (Chen et al. 2012).
Two perspectives dominate the IS literature on BI&A: the first stream sheds light on the evolution of BI&A in enterprises, with a focus on key concepts, applications, and technologies. The second stream aims to explain value generation in the BI&A context. While these findings identify different stages, ranging from investments in BI&A resources to obtaining value, they provide few insights into the way enterprises orchestrate their resources and build BI&A capabilities.
Evolution of Business Intelligence and Analytics
Since its early applications in the 1970s in the form of decision support systems (DSS), the BI&A field has not stopped evolving. The first DSS generation used a dedicated data repository and model basis (Sprague 1980) to calculate the key performance indicators and deliver reports on historic data in structured formats. This application-centric architecture was subsequently replaced by new DSS applications, such as executive information systems, and dashboards/scorecards (Watson 2014). Data warehouses allowed companies to
integrate data from multiple operational systems in a pre-defined structure and to support a wide variety of applications simultaneously, such as queries, online analytical processing (OLAP) or data mining. Establishing a central repository for all enterprise data had the advantage of simplifying the BI&A delivery (Watson 2009). As early as in 1989, Howard Dresner coined the term business intelligence (BI) as “[…] a broad category of applications, technologies, and processes for gathering, storing, accessing, and analyzing data to help business users make better decisions” (Watson 2009, p. 491). Enterprise data warehouses allowed companies to process data in real-time and thereby support decision-making not only at strategic/tactical level, but also at operational level (Watson 2009).
The advent of the internet made new data sources available through web applications. Mining social graphs or even, for instance, their customers’ opinions allowed enterprises to significantly improve their understanding of their environment. Since analytics capabilities have gained increasing importance, the term (business) analytics is often used in conjunction or interchangeably with business intelligence (Chen et al. 2012; Davenport 2006). With the emergence of smartphones and the ubiquity of sensors embedded in connected devices, data are collected on a more granular level than before. This change allows enterprises to accurately trace and analyze their business operations, but also requires them to rethink the way they manage data and deliver BI&A. Today, data “are so large (from terabytes to exabytes) and complex (from sensor to social media data) that they require advanced and unique data storage, management, analysis, and visualization technologies” (Chen et al. 2012). Traditional enterprise data warehouses cannot cope with big data requirements, due to their lack of flexibility in terms of modifying data structures and dealing with multiple data formats (Jukić et al. 2015; Sivarajah et al. 2017). Companies are therefore extending their existing data infrastructures to build more comprehensive enterprise analytics platforms. The latter comprise data lakes, which store data in a raw format without a pre-defined structure, to enable data exploration and experimentation (Farid et al. 2016; Madera and Laurent 2016; Watson 2017) as well as analytics products with capabilities that clearly go beyond the mere aggregation and visualization of data and also comprise artificial intelligence (Watson 2017). In this context, experts argue that machine learning applications’ strong reliance on data might lead to high technical debts (Sculley et al. 2015).
Value Generation through Business Intelligence and Analytics
Even though enterprises understand that they can achieve a competitive advantage with big data and advanced analytics (Ransbotham and Kiron 2017), their analytics initiatives' success rate lags behind expectations and many struggle to obtain a return on investment (Davenport and Bean 2019; Grover et al. 2018; Shim and Guo 2015). This struggle raises questions about how BI&A investments create value and reflects the general debate on IS’ business value (Kohli and Grover 2008; Schryen 2013). Different models have been proposed (see Table 1) to explain the value creation of business intelligence systems (Trieu 2017), business analytics (Seddon et al. 2017), and big data analytics (Grover et al. 2018).
Trieu (2017) introduce a BI business value framework to integrate findings from the fragmented literature and to guide researchers. Based on the seminal IT business value process model by Soh and Markus (1995), she shows that BI creates value in a chain of required conditions ranging from BI investments to BI assets, to BI impacts. She distinguishes three core processes: (1) the BI conversion process, which converts BI investments to BI assets through BI management and additional investments in non-BI resources. (2) The BI use process: once BI investments have been converted, BI assets can be used to generate BI impacts. BI effective/ineffective use patterns affect this generation process’s performance. (3) Competitive process: this process transforms the BI impacts into organizational performance, which affects the firm’s competitive position. Trieu (2017) extends the adapted Soh and Markus (1995) view by means of the findings by Schryen (2013) and Melville et al. (2004) by including context/environmental factors (firm, industry, country) and latency effects, which affect the BI business value generation process.
Based on an analysis of 16 models from the literature, Seddon et al. (2017) derive a business analytics success model comprising process and variance models. The process model builds on the observation that “prime drivers of business value from business analytics are actions driven by new insights and improved decision making” (ibid p. 244). The enabling technology and analytical specialists are the analytical resources used “by people in many parts of the organization” to generate insights and make decisions. Decisions lead to value-creating actions that either change or use the existing organizational resources and lead to organizational benefits from the analytics’ use. The variance model provides a complementary view of the process model, and comprises a long-term organizational benefits model and a short-term project
model. The short- and long-term organizational benefits depend on various factors. In the short-term project model (S), these factors include (S1) BA tools’ functional fit, (S2) readily available high-quality data, (S3) analytical people, and (S4) overcoming organizational inertia. In the long-term model (L), the benefits depend on (L1) the analytics leadership, (L2) enterprise-wide analytics orientation, (L3) well-chosen targets, (L4) the extent to which evidence-based decision making is embedded in the organization’s “DNA,” and (L5) the on-going business analytics improvement projects.
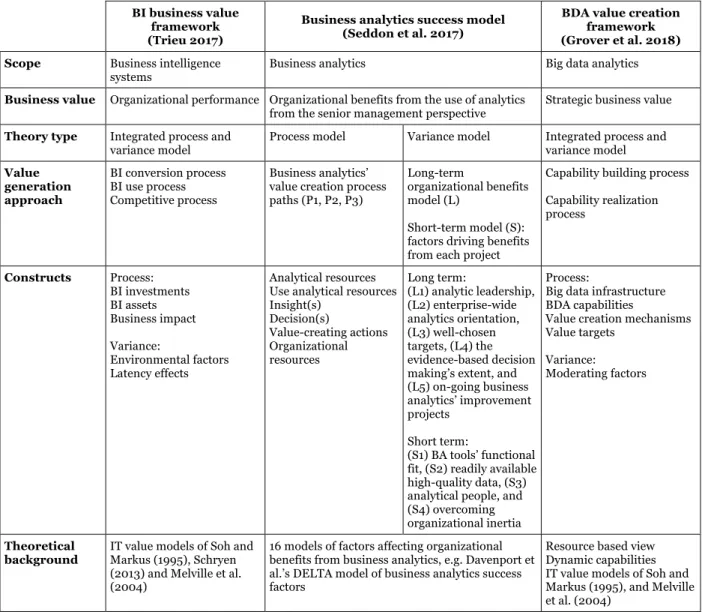
Table 1 Prior studies on BI&A value generation
BI business value framework (Trieu 2017)
Business analytics success model (Seddon et al. 2017)
BDA value creation framework (Grover et al. 2018) Scope Business intelligence
systems
Business analytics Big data analytics
Business value Organizational performance Organizational benefits from the use of analytics from the senior management perspective
Strategic business value
Theory type Integrated process and variance model
Process model Variance model Integrated process and variance model Value generation approach BI conversion process BI use process Competitive process Business analytics’ value creation process paths (P1, P2, P3)
Long-term
organizational benefits model (L)
Short-term model (S): factors driving benefits from each project
Capability building process
Capability realization process Constructs Process: BI investments BI assets Business impact Variance: Environmental factors Latency effects Analytical resources Use analytical resources Insight(s) Decision(s) Value-creating actions Organizational resources Long term: (L1) analytic leadership, (L2) enterprise-wide analytics orientation, (L3) well-chosen targets, (L4) the evidence-based decision making’s extent, and (L5) on-going business analytics’ improvement projects
Short term:
(S1) BA tools’ functional fit, (S2) readily available high-quality data, (S3) analytical people, and (S4) overcoming organizational inertia
Process:
Big data infrastructure BDA capabilities
Value creation mechanisms Value targets
Variance:
Moderating factors
Theoretical
background IT value models of Soh and Markus (1995), Schryen (2013) and Melville et al. (2004)
16 models of factors affecting organizational benefits from business analytics, e.g. Davenport et al.’s DELTA model of business analytics success factors
Resource based view Dynamic capabilities IT value models of Soh and Markus (1995), and Melville et al. (2004)
Grover et al. (2018) investigate how BDA creates strategic value from the resource-based view’s lens. In their study, they focus on descriptive, predictive and prescriptive analytics, as well as on an analytics portfolio comprising text, predictive, audio, video, social media, geographic, streaming, and graph analytics. These authors suggest a conceptual framework that builds on dynamic capabilities’ general framing and on IT value models that Soh and Markus (1995), as well as Melville et al. (2004), proposed. According to this framework, value is created through two main processes: building BDA capabilities and realizing BDA capabilities. Building BDA capabilities involves investment in data, technological, and human resources to establish a BDA infrastructure (big data asset, analytics portfolio, and human talent). The latter activity leverages this BDA infrastructure to develop valuable BDA capabilities, i.e. the “ability to integrate, disseminate, explore, and analyze big data” (p. 398). The realization of BDA requires six distinct value creation mechanisms “that mediate the linkage between BDA capabilities and value targets": (1)
transparency and access, (2) discovery and experimentation, (3) prediction and optimization, (4) customization and targeting, (5) learning and crowd-sourcing, and (6) continuous monitoring and proactive adaptation. The value targets could result in functional or symbolic strategic value.
Research Gap
The presented models help us understand how investments in BI&A resources create business value in terms of strategic and organizational performance. These models also reveal that value creation is a complex process with multiple stages between the initial investments in BI&A resources and eventually obtaining actual value. However, prior research mostly focused on value generation mechanisms, but do not explain how enterprises actually structure and deploy their BI&A resources to build BI&A capabilities. According to Grover et al. (2018), the latter remains an important research topic, because “without appropriate organizational structures and governance frameworks in place, it is impossible to collect and analyze data across an enterprise and deliver insights [in]to where they are most needed” (p. 417). Moreover, “little is known so far about the processes and structures necessary to orchestrate these resources into a firm-wide capability” (Mikalef et al. 2018, p. 569). Among the few studies, Schüritz et al. (2017) analyze analytics competence centers to identify organizational design patterns, while Kettinger et al. (2019) investigate how to build an information management capability to develop guidelines for senior executives. Although both studies explain BI&A capability building, they focus only on partial aspects and follow a different research aim. We conclude that existing research remains fragmented and without a clear theoretical framing. Work system theory (WST) is a promising lens for studying capability building in the context of BI&A. A work system is a “[…] system in which human participants and/or machines perform work (processes and activities) using information, technology, and other resources to produce specific product/services for internal or external customers” (Alter 2013). The work system perspective therefore helps us understand how resources (participants, information, technologies) are orchestrated (by means of processes/activities) to build capabilities (products/services for customers). Several researchers have applied WST to specific BI&A applications. Alter (2004), for instance, analyzes a decision support system to demonstrate the WST perspective’s usefulness. Heart et al. (2018) use the WST to design and implement a big data analytics tool for improving clinical decisions. Marjanovic (2016) investigates BI&A-supported, knowledge-intensive business processes by means of the WST lens. We conclude that using the WST lens is a promising approach to systematically analyze how enterprises orchestrate their tangible and intangible BI&A resources, and build BI&A capabilities.
Methodology
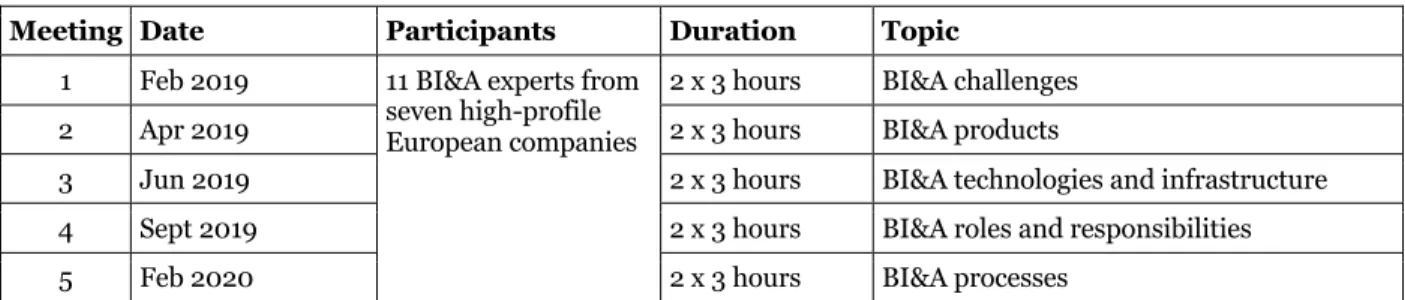
We use a multi-method research design (Venkatesh 2016) to investigate how enterprises build their BI&A capabilities. Our research activities started in February 2019, when we formed an expert group to investigate BI&A challenges as part of a multi-year research program on data management. Over a period of one year, we worked closely with 11 BI&A experts from seven high-profile European companies. All of the experts represent large corporations from a diversity of industries with ongoing initiatives regarding leveraging BI&A. These experts are responsible for establishing governance structures (including the definition of roles, responsibilities, and processes) and have a broad overview of the BI&A in their respective company. This setup provided us with unique access to field data from ongoing BI&A initiatives in European companies.
We collected data by means of four case studies and five focus group meetings, which we then analyzed through the WST lens. Using the two different qualitative data collection procedures (case studies and focus group meetings) allowed us to gain a broader understanding of the current state of BI&A in enterprises. The four case studies specifically allowed us to study companies with a comparable maturity. After reflecting on the four cases with a broader group of experts and in the context of the literature, we generalized our findings in the form of BI&A work systems.
Case Studies
From discussions in the expert group, we selected four (of the seven) companies for a detailed investigation of their BI&A environment and management approach (see Table 2). These four case companies have an enterprise data warehouse and an enterprise data lake as a BI&A infrastructure; they also have data scientist
teams that explore and experiment with data. To enable their organizations to work with BI&A at scale, they have defined roles, processes, and responsibilities as part of their governance organization. Since each case company has a relatively high BI&A maturity and belongs to a different industry, the case selection process followed a literal replication logic allowing the results to be analytically generalized (Benbasat et al. 1987; Yin 2003).
We gathered information on each case company from multiple sources, i.e. primary sources (interviews) and secondary sources (internal documents), which allowed triangulation and ensured the construct validity (Yin 2003). As a starting point, we conducted an initial semi-structured interview with the key informants to gain an understanding of their roles, as well as their companies’ processes, technologies, and infrastructures. These interviews gave us the opportunity to understand the challenges and approaches in greater depth. In parallel, we collected primary data through the internal documents that the firms provided (e.g. BI&A platform designs, role models, and organizational structures). These documents not only informed us about their approach, but also about the context and related topics, such as the technical infrastructure, as well as the established roles and processes.
Table 2 Case companies
Company Industry # Employees Revenue / Key informants BI&A context
A Consumer goods $50–100 b / ~80 000 Data governance manager, enterprise data architect
Organization: central data and analytics management organization Infrastructure: central big data platform for the innovation and industrialization of analytics use cases
B Public transportation $1–50 b / ~35 000
Leader business information management, data governance manager, big data platform architect
Organization: central data management organization and central/decentralized data science team
Infrastructure: corporate data lake for data exploration/experimentation and the operation of analytics use case
C Industry products $50–100 b / ~110 000 Project manager data lake
Organization: Central data management organization and advanced analytics group
Infrastructure: Operation of multiple data lakes and data warehouses
D Consumer goods $1–50 b / ~30 000 Head of data and analytics, head of data governance
Organization: Central data and analytics management organization with a high business intelligence maturity
Infrastructure: Operation of one central enterprise data warehouse with extensions to undertake analytics
Focus Group Meetings
The experts met physically five times between February 2019 and February 2020 (see Table 3). The first meeting was held in February 2019 to discuss the challenges of managing data lakes compared to traditional BI environments. The group realized and agreed that established approaches could not be transferred to data lake environments where data enable data exploration and experimentation. It became clear that the key challenge lies in managing both environments simultaneously, and that BI&A management should encompass the complete "enterprise analytics platform," meaning all the components that deliver BI&A products, including existing BI and data lake environments. The participants also concluded that they needed a comprehensive approach covering the technological and the organizational aspects. In respect of the technological aspects, the participants called for an understanding and descriptions of the existing and the emerging components of the "enterprise analytics platform." In respect of the organizational aspects,
the participants called for a clarification of the roles, responsibilities, and processes. Based on the findings of this initial focus group, we conducted five subsequent focus group meetings. At each meeting, we investigated one crucial topic in depth in order to contribute to the larger picture of how enterprises should build their BI&A capabilities.
Table 3 Focus group meetings
Meeting Date Participants Duration Topic
1 Feb 2019 11 BI&A experts from seven high-profile European companies
2 x 3 hours BI&A challenges 2 Apr 2019 2 x 3 hours BI&A products
3 Jun 2019 2 x 3 hours BI&A technologies and infrastructure 4 Sept 2019 2 x 3 hours BI&A roles and responsibilities 5 Feb 2020 2 x 3 hours BI&A processes
Theoretical Integration
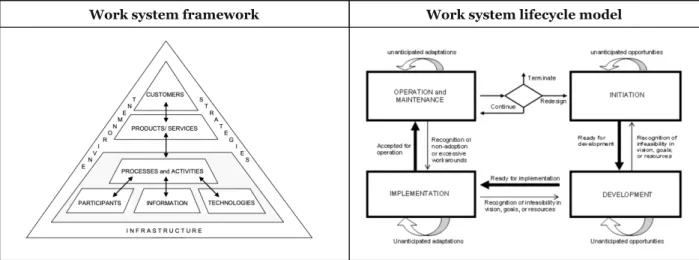
To integrate our findings from the field with those from the literature, we used the theoretical WST lens and analyzed our data according to the work systems framework’s and lifecycle model’s components. We chose the WST (Alter 2013) for the following two reasons: First, it “[…] replaces the prevailing system-as-technical-artifact perspective with a genuine system perspective for focusing on IT-reliant systems in organizations” (Alter 2013, p. 74). Second, the WST provides a suitable, systematic approach to describe how tangible and intangible resources are orchestrated in an enterprise. In the context of BI&A, it helps provide an understanding of how the required capabilities are built.
The WST comprises three core components: the work system definition, the work system framework, and the work system lifecycle model. A work system is defined as a “[…] system in which human participants and/or machines perform work (processes and activities) using information, technology, and other resources to produce specific product/services for internal or external customers” (Alter 2013). The work systems’ elements and the relationships between them are described by means of the work system framework (see Figure 1). The Customers, which are displayed at the top, are the receivers of Products/Services, which they use “[…] for purposes other than performing work activities within the work system” (Alter 2013). Products/Services deliver a certain value to these Customers and are a direct outcome of the work system. These products or services are created through a certain set of Processes/Activities, which requires Participants, Information, and Technologies. Participants are responsible for at least one Process/Activity, but can simultaneously be a Customer. Information represents the “[…] informational entities that are used, created, captured, transmitted, stored, retrieved, manipulated, updated, displayed, and/or deleted by processes/activities” (Alter 2013). Technologies are used in Processes/Activities to provide customers with Products/Services. While the previous elements describe a work system’s key elements from an inside perspective, the elements Infrastructure, Strategies, and Environment influence the work system from the outside. Infrastructure comprises the resources shared between work systems. Strategies influence the work system’s the lifecycle and may include the companies’ strategy, the business unit strategy, and the work system strategy. The Environment encompasses the “[…] relevant organizational, cultural, competitive, technical, regulatory, and demographic environment within which the work system operates, and that affects the work system’s effectiveness and efficiency.”
Figure 1 Work system framework and lifecycle (Alter 2013)
While the work system framework is a snapshot of a certain point in time, the work system lifecycle model describes how a work system evolves over time. This system comprises four phases representing planned changes: Initiation, Development, Implementation, and Operation & Maintenance. The need for a particular work system is addressed and specified in the Initiation phase. After the specification of the requirements, the resources for implementing the work system are created and allocated in the Development phase, which also includes, for instance, the development of software. In the Implementation phase, the work system is implemented in the organization through change management and, for instance, through the work system participants’ training. After this phase, the work system is in the Operation & Maintenance phase.
Building Business Intelligence and Analytics Capabilities with Work
Systems
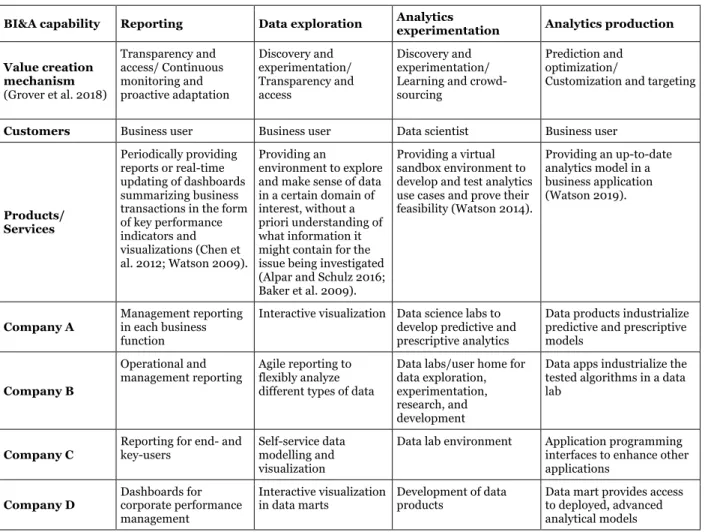
By analyzing our data and the literature, we identify four types of BI&A capabilities prevalent in the case companies and extend prior studies (see Table 4): Reporting, Data exploration, Analytics experimentation, and Analytics production. Based on the WST, these BI&A capabilities serve specific Customers and Products/Services, which we will present below, together with evidence from the cases and links to the BI&A literature.
Four Types of Business Intelligence and Analytics Capabilities
The reporting capability comprises periodically providing business users with reports, as well as digital dashboards summarizing the business transactions in the form of key performance indicators and visualizations (Chen et al. 2012; Watson 2009). While companies A and D solely focus on managers as end users, companies B and C also address users on an operational level, who could, for instance, be shop-floor workers at their production facilities. This capability creates value in the form of Transparency and access and Continuous monitoring and proactive adaptation according to the mechanisms that Grover et al. (2018) suggest.
Table 4 BI&A capabilities in case companies
BI&A capability Reporting Data exploration Analytics experimentation Analytics production
Value creation mechanism (Grover et al. 2018) Transparency and access/ Continuous monitoring and proactive adaptation Discovery and experimentation/ Transparency and access Discovery and experimentation/ Learning and crowd-sourcing
Prediction and optimization/
Customization and targeting
Customers Business user Business user Data scientist Business user
Products/ Services Periodically providing reports or real-time updating of dashboards summarizing business transactions in the form of key performance indicators and visualizations (Chen et al. 2012; Watson 2009). Providing an environment to explore and make sense of data in a certain domain of interest, without a priori understanding of what information it might contain for the issue being investigated (Alpar and Schulz 2016; Baker et al. 2009).
Providing a virtual sandbox environment to develop and test analytics use cases and prove their feasibility (Watson 2014). Providing an up-to-date analytics model in a business application (Watson 2019). Company A Management reporting in each business function
Interactive visualization Data science labs to develop predictive and prescriptive analytics
Data products industrialize predictive and prescriptive models Company B Operational and management reporting Agile reporting to flexibly analyze different types of data
Data labs/user home for data exploration, experimentation, research, and development
Data apps industrialize the tested algorithms in a data lab
Company C Reporting for end- and key-users Self-service data modelling and visualization
Data lab environment Application programming interfaces to enhance other applications Company D Dashboards for corporate performance management Interactive visualization in data marts Development of data products
Data mart provides access to deployed, advanced analytical models
The Data exploration capability allows in-depth and flexible data analysis “without an a priori understanding of what patterns, information, or knowledge it might contain” (Baker et al. 2009, p. 534). In a dedicated environment, business users analyze their domain of interest’s data with self-service BI tools to explore and make sense of the data in the investigation context (Alpar and Schulz 2016). Companies A and
D call this BI&A product “interactive visualization,” while Company C uses the term “self-service data” and Company B “agile reporting.” In keeping with the mechanisms that Grover et al. (2018) suggest, this capability creates value in the form of Discovery and experimentation and Transparency and access. The Analytics experimentation capability allows enterprises the possibility to develop analytics use cases and prove their feasibility. A data scientist should develop and test analytics algorithms in a virtual sandbox environment (Watson 2014). All the case companies provide access to a dedicated environment in order to allow access to datasets in their raw format for research and development purposes. While companies A-C run their analytics experimentations on a data lake, Company D uses a data mart connected to its enterprise data warehouse. In keeping with the mechanisms that Grover et al. (2018) suggest, this capability creates value in the form of Discovery and experimentation and Learning and crowd-sourcing.
The analytics models that prove feasible are deployed and made accessible with the Analytics production capability, which in turn ensures that the analytics models remain up-to-date throughout their lifecycle (Watson 2019). A business user accesses an analytics model in business applications. Companies A-C operate their Analytics production in a dedicated environment on the data lake. For instance, Company C provides access to analytics models via an application programming interface (APIs). Company D operates advanced analytical models with a data mart connected to the enterprise data warehouse. In keeping with the mechanisms that Grover et al. (2018) suggest, this capability creates value in the form of Prediction and optimization and Customization and targeting.
Business Analytics and Intelligence Work Systems
In the following, we describe how the identified BI&A capabilities are built using the work system framework and lifecycle. We describe each work system’s Customers and Products/Services, the required resources with Participants, Information, and Technologies, and resource orchestration with Processes/Activities.
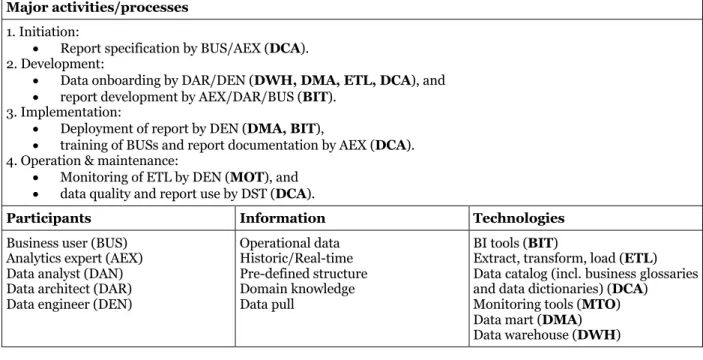
Reporting Work System
The Reporting work system (see Table 5) enables enterprises to create transparency and monitor business operations to improve operational and strategic decision making. Operational data (e.g. business transactions or machine data) are aggregated on a continuous basis to calculate key performance indicators and create visualizations. The operational level’s time horizon of analysis is usually shorter than that of for the management level.
The trigger is usually an information need that a business user expresses. In the Initiation phase, the business user specifies the analytics product (here, the key performance indicators and the report) by defining the decisions that the report needs to support, including aspects such as the frequency or form of delivery. An analytics expert with business domain knowledge usually supports the report specification process.
In the Development phase, an analytics expert identifies the required data for the report and assesses whether they are available in the enterprise data warehouse or in a data catalog. If the data are not available or accessible in the required form, they first need to be onboarded to the data warehouse. In this case, a data architect identifies and models the data according to the reports’ data requirements. In addition, a data engineer must extract, transform, and load (ETL) the data into the data warehouse/data mart. If the data are available and accessible in the required form in the data warehouse, either the analytics expert or a data analyst develops the report directly by means of a BI tool. Once a first version of the report has been created, the Business user validates it. The analytics expert creates material with which to train others to use the report.
In the Implementation phase, the data engineer deploys the report, business users are trained to use the report, and the report is documented in a data catalog, along with explanations of its general mechanism and information on access to report and training material.
In the Operation & Maintenance phase, a data engineer monitors the ETLs, while a data steward monitors the data quality in general and the report’s use in particular.
Table 5 Reporting Work System Customers Products/Services
Business user Periodically providing reports or real-time updating of dashboards summarizing business transactions in the form of key performance indicators and visualizations (Chen et al. 2012; Watson 2009).
Major activities/processes
1. Initiation:
• Report specification by BUS/AEX (DCA). 2. Development:
• Data onboarding by DAR/DEN (DWH, DMA, ETL, DCA), and
• report development by AEX/DAR/BUS (BIT). 3. Implementation:
• Deployment of report by DEN (DMA, BIT),
• training of BUSs and report documentation by AEX (DCA). 4. Operation & maintenance:
• Monitoring of ETL by DEN (MOT), and
• data quality and report use by DST (DCA).
Participants Information Technologies
Business user (BUS) Analytics expert (AEX) Data analyst (DAN) Data architect (DAR) Data engineer (DEN)
Operational data Historic/Real-time Pre-defined structure Domain knowledge Data pull BI tools (BIT)
Extract, transform, load (ETL) Data catalog (incl. business glossaries and data dictionaries) (DCA)
Monitoring tools (MTO) Data mart (DMA) Data warehouse (DWH)
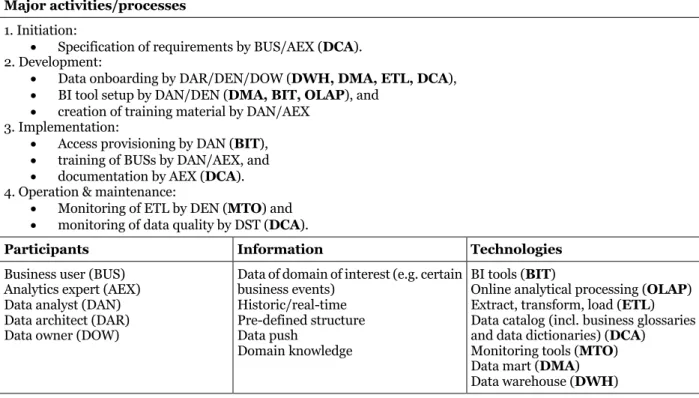
Data Exploration Work System
The Data exploration work system (see Table 6) allows, depending on the issue being investigated, the flexible analyzing a certain domain of interest’s data and from different perspectives. This system supports decisions requiring an in-depth data analysis. Depending on the domain, data can stem from various sources and be of different types. Data are pushed to the access tools and give customers the flexibility to select and analyze the required data themselves. This work system relies on data warehouse architecture with online analytical processing and powerful data visualization tools to allow data to be explored in a self-service way.
In the Initiation phase, a business user identifies and specifies data requirements and access modalities with the support of an analytics expert, which support the analysis of the domain of interest and support the task at hand.
In the Development phase, the required data are onboarded to the data warehouse. First, a data architect identifies and models the required data. Thereafter, a data engineer implements the extract, transform, and load process according to the data models that the data architect provides. The BI tool is set up according to the specification. Finally, the analytics expert and data analyst create training material.
In the Implementation phase, data analysts and analytics experts train business users in conducting descriptive and diagnostic analytics with the BI tool. This capability requires customers to be data literate. The analytics expert documents the data and training material in a data catalog.
In the Operation & Maintenance phase, data are continuously pushed to the access tool through the extract, transform, and load process which the data engineer monitors. A data steward takes data quality measures and ensures that the data are fit for purpose.
Table 6 Data Exploration Work System Customers Products/Services
Business user Providing an environment to explore and make sense of data in a certain domain of interest, without a priori understanding of what information it might contain for the issue being investigated (Alpar and Schulz 2016; Baker et al. 2009).
Major activities/processes
1. Initiation:
• Specification of requirements by BUS/AEX (DCA). 2. Development:
• Data onboarding by DAR/DEN/DOW (DWH, DMA, ETL, DCA),
• BI tool setup by DAN/DEN (DMA, BIT, OLAP), and
• creation of training material by DAN/AEX 3. Implementation:
• Access provisioning by DAN (BIT),
• training of BUSs by DAN/AEX, and
• documentation by AEX (DCA). 4. Operation & maintenance:
• Monitoring of ETL by DEN (MTO) and
• monitoring of data quality by DST (DCA).
Participants Information Technologies
Business user (BUS) Analytics expert (AEX) Data analyst (DAN) Data architect (DAR) Data owner (DOW)
Data of domain of interest (e.g. certain business events) Historic/real-time Pre-defined structure Data push Domain knowledge BI tools (BIT)
Online analytical processing (OLAP) Extract, transform, load (ETL) Data catalog (incl. business glossaries and data dictionaries) (DCA)
Monitoring tools (MTO) Data mart (DMA) Data warehouse (DWH)
Analytics Experimentation Work System
The Analytics experimentation (see Table 7) work system provides the possibility to test analytics use cases’ feasibility through iterative experiments. A sample dataset is made available in a dedicated environment where experts can access it by, for instance, using interactive programming and development tools. This sample dataset comes with its own requirements and, for instance, requires labels for machine learning tasks.
In the Initiation phase, the analytics use case is specified either by means of a top-down (strategic initiation) or bottom-up (business user initiation) approach. Whatever the case, a team comprising an analytics expert (domain knowledge), a data architect (data knowledge) and a data scientist (analytics knowledge) specifies the use case. Besides technical requirements, the specification includes a calculation of the business case and agreements to obtain the data, which might involve further interactions with data stewards and data owners. Thereafter, the use case experiences a funnel process, in which the data and analytics board, which includes business sponsors and senior managers, review and eventually prioritize it. Once the use case has been prioritized, the Development phase starts.
In the Development phase, the architect models the required data, which the data engineer extracts from the source system(s) and loads it in its raw format to the data lake. After onboarding the data on the data lake, a data engineer creates a dedicated sandbox environment to access the dataset. The relevant data steward and data engineer document the newly onboarded data in the data catalog. In an ideal case, the required data are already onboarded on the data lake and only require the latter steps.
In the Implementation phase, the data scientist is given access to the sandbox environment. An analytics expert could help the data scientist understand the business side of the analytics use case.
In the Operation & Maintenance phase, the data scientist tests different algorithmic approaches’ feasibility regarding addressing the analytics use case. This usually involves multiple iterations of the analytics model’s building and evaluation, and might require a data engineer to change or onboard more data.
Table 7 Analytics Experimentation Work System Customers Products/Services
Data scientist Providing a virtual sandbox environment to develop and test analytics use cases and prove their feasibility (Watson 2014).
Major activities/processes
1. Initiation:
• Analytics use case specification by AEX/DAR/DSC/DOW (DCA)and
• analytics use case prioritization by DAB 2. Development:
• Data onboarding by DAR/DEN/DOW (DLA, EL, DCA),
• creation and configuration of sandbox environment by DEN (DLA, VSO), and
• data documentation by DEN/DST (DCA) 3. Implementation:
• Sandbox provision to DSC by DEN (SEN) and
• support in business understanding of use case by AEX 4. Operation & maintenance:
• Analytics model development by DSC (IDE, ICO, SEN, CRE, DCA)
Participants Information Technologies
Data and analytics board (DAB) Analytics Expert (AEX)
Data architect (DAR) Data owner (DOW) Data scientist (DSC) Data engineer (DEN) Data steward (DST)
Domain knowledge
Sample dataset (incl. labels) Historic data
Structured/Unstructured Raw format
Reference data Pre-trained models
Integrated development environment (IDE)
Interactive computing tools (ICO) Extract and load (EL)
Programming libraries (PLI) Sandbox environment (SEN) Virtualization software (VSO) Code repositories (CRE)
Data catalog (incl. business glossaries and data dictionaries) (DCA)
Data lake (DLA)
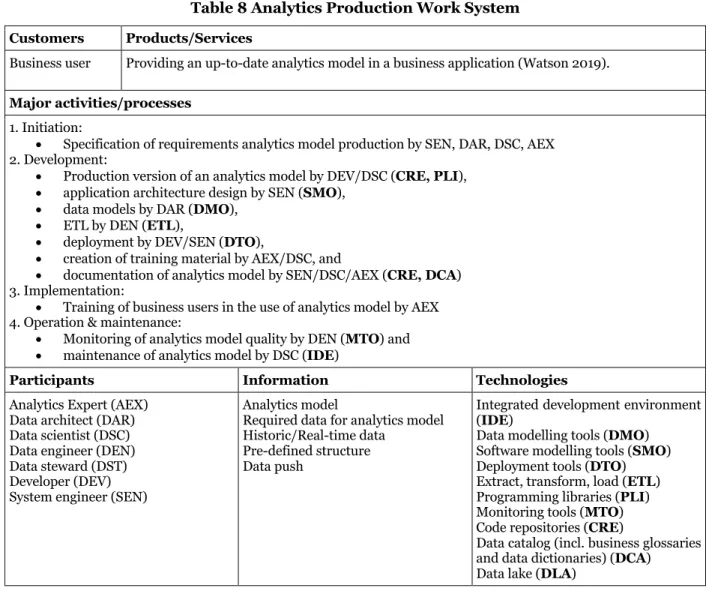
Analytics Production Work System
The Analytics production work system (see Table 8) deploys analytics models and ensures that they generate business value throughout their lifecycles. While an analytics model is usually developed by using historic data, the deployed model requires access to real-time data and might even use these data to optimize itself over time.
In the Initiation phase, a system engineer, a data architect, the responsible data scientist, and an analytics expert review the successfully tested analytics model and specify the requirements for the production. Their tasks include clarifying how often an analytics model needs to be retrained (as part of the analytics model lifecycle) and, for instance, how the quality can be monitored.
In the Development phase, the analytics model needs to be optimized for production according to the specification. First, a developer, with the responsible data scientist’s support, converts the analytics model to a production-ready form. Second, a system engineer designs the application architecture according to the enterprise architecture. Third, a data architect provides the data models and a data engineer implements the extract, transform, and load process accordingly. The developer and system engineer then test and deploy the analytics model. In the meantime, the responsible analytics expert and data scientist create a plan and material to train business users in using the analytics model. The system engineer, data scientist, and analytics expert document the analytics model.
In the Implementation phase, Business users are trained to use the analytics model. While the use does not necessarily require any data management or knowledge of statistics, skills in change management are needed for successful implementation of analytics applications.
In the Operation & Maintenance phase, business users use the analytics model in business applications. The data engineer continuously monitors the analytics model’s quality. In case of changes in the underlying data distribution, which might lead to a drop in the analytics model’s accuracy, the data scientist needs to newly optimize the model.
Table 8 Analytics Production Work System Customers Products/Services
Business user Providing an up-to-date analytics model in a business application (Watson 2019).
Major activities/processes
1. Initiation:
• Specification of requirements analytics model production by SEN, DAR, DSC, AEX 2. Development:
• Production version of an analytics model by DEV/DSC (CRE,PLI),
• application architecture design by SEN (SMO),
• data models by DAR (DMO),
• ETL by DEN (ETL),
• deployment by DEV/SEN (DTO),
• creation of training material by AEX/DSC, and
• documentation of analytics model by SEN/DSC/AEX (CRE, DCA) 3. Implementation:
• Training of business users in the use of analytics model by AEX 4. Operation & maintenance:
• Monitoring of analytics model quality by DEN (MTO) and
• maintenance of analytics model by DSC (IDE)
Participants Information Technologies
Analytics Expert (AEX) Data architect (DAR) Data scientist (DSC) Data engineer (DEN) Data steward (DST) Developer (DEV) System engineer (SEN)
Analytics model
Required data for analytics model Historic/Real-time data
Pre-defined structure Data push
Integrated development environment (IDE)
Data modelling tools (DMO) Software modelling tools (SMO) Deployment tools (DTO) Extract, transform, load (ETL) Programming libraries (PLI) Monitoring tools (MTO) Code repositories (CRE)
Data catalog (incl. business glossaries and data dictionaries) (DCA)
Data lake (DLA)
Integration of the Four BI&A Work Systems
While we outline the four BI&A work systems separately, commonalities can be identified across BI&A work systems:
• Participants: The analytics expert, data architect, and data engineer are key roles to build BI&A capabilities and are required in all BI&A work systems. The analytics expert is the business domain expert of the Participants and has a two-fold role: to identify and specify business requirements for BI&A products, but also to support their implementation into the organization by training business users and documenting products from a business perspective. While the data architect mainly helps identify and model enterprise data in the Development phase, the data engineer is needed in the Development phase to implement “data pipelines” (some form of ETL process) and in the Operation & Maintenance phase to ensure these data pipelines remain available. Data modelling and data engineering expertise could therefore be bundled in a center of excellence. It could also be
argued that the opposite holds true with regard to data analysts and data scientists, who need to collaborate with business users and analytics experts for whom a decentralized model seems to make more sense. While analytics experts reside in their respective business functions, they should be coordinated centrally to democratize BI&A knowledge correctly.
• Technologies/Infrastructures: The four work systems obviously share many infrastructure requirements. Reporting and Data exploration are generally enabled by means of a data warehouse, while the Analytics experimentation and Analytics production work systems leverage a data lake infrastructure. The former two are complemented by BI tools to visualize and analyze data in an interactive way. All four work systems benefit from a data catalog solution.
• Processes/Activities: The work systems Reporting, Data exploration, and Analytics experimentation all require the data and tool requirements to be specified in the initiation phase. This could potentially be bundled with a request management process (or use case funnel) that prioritizes requests and allocates resources centrally. Moreover, the analytics model lifecycle spans two work systems. An analytics model’s feasibility is first tested in the Analytics experimentation work system and, if this test is successful, it is productized in the Analytics production work system. While the separation of the two work systems seems to be reasonable from a capabilities perspective, both work systems require effective alignment to ensure a seamless transition from an analytics model prototype to an analytics model in production.
Since we can identify commonalities in the BI&A work systems, we argue that a company may lose synergies if they manage their existing BI environments and emerging big data infrastructures separately. From our case analysis, we find that managing the four work systems as an integrated "enterprise analytics platform" creates benefits at organizational and infrastructure level, and helps build superior BI&A capabilities.
Conclusion and Implications
Value creation from BI&A is a complex process with multiple stages ranging from the initial investments in resources to obtaining actual value. While existing research mainly focusses on value creation mechanisms, our study addresses resource orchestration and capability building for BI&A. From four case studies and intense exchanges with experts in focus group meetings, we identify four BI&A capabilities prevalent in companies and discussed in the literature: Reporting, Data exploration, Analytics experimentation, and Analytics production. For each BI&A capability, we identify patterns in the form of a work system with its specific components. The work system framework provides a structured approach to identify tangible, intangible, and human resources, as well as analyze how these resources are orchestrated to create BI&A capabilities. We thereby do not only explain how enterprises build specific BI&A capabilities, but also suggest potential synergies by identifying commonalities across the suggested BI&A work systems. Our research therefore addresses important questions outlined in the research agenda for BDA related to analytics capabilities’ creation, i.e. the ability to integrate, disseminate, explore, and analyze big data, by Grover et al. (2018). On a more general level, we showcase how WST can be used to understand resource orchestration and capability building in IS research.
Our study does have limitations. First of all, the study is of qualitative nature and only allows analytical generalization. Quantitative studies are therefore needed to validate our findings. Furthermore, it should be noted that our sample in both the expert group and the case studies comprises large corporations with high levels of specialization. This implies that the findings might not be transferrable to smaller companies. Our findings allow practitioners to not only understand the essential resources and their interplay, but also to map them to their organizational context. The documentation in the form of work systems equips enterprises with the possibility to analyze their current situation and define an appropriate organizational and infrastructure setup for their analytics initiatives. While we view the BI&A work systems separately, our findings suggest that companies should manage their existing BI environments in conjunction with their emerging analytics infrastructures to enable synergies between the different work systems. From an academic perspective, our research contributes to understanding resource orchestration and capability building as a prerequisite to value generation with BI&A. In this field, we see promising research opportunities related to all four BI&A work systems, as well as their integration into an "enterprise analytics platform." For instance, the transition from Analytics experimentation to Analytics production remains a challenge in practice and requires an in-depth analysis.
References
Alpar, P., and Schulz, M. 2016. “Self-Service Business Intelligence,” Business & Information Systems Engineering (58:2), pp. 151–155.
Alter, S. 2004. “A Work System View of DSS in Its Fourth Decade,” Decision Support Systems (38:3), pp. 319–327. Alter, S. 2013. “Work System Theory: Overview of Core Concepts, Extensions, and Challenges for the Future,”
Journal of the Association for Information Systems (14:2), pp. 72–121.
Baker, J., Jones, D., and Burkman, J. 2009. “Using Visual Representations of Data to Enhance Sensemaking in Data Exploration Tasks,” Journal of the Association for Information Systems (10:7), pp. 533–559.
Benbasat, I., Goldstein, D. K., and Mead, M. 1987. “The Case Research Strategy in Studies of Information Systems,” MIS Quarterly, pp. 369–386.
Chen, H., Chiang, R. H., and Storey, V. C. 2012. “Business Intelligence and Analytics: From Big Data to Big Impact.,” MIS Quarterly (36:4), pp. 1165–1188.
Cornelissen, J. 2018. “The Democratization of Data Science,” Harvard Business Review, pp. 2–4.
Davenport, T., and Bean, R. 2019. “Big Data and AI Executive Survey 2019,” New Vantage Partners LLC, pp. 1–16. Davenport, T. H. 2006. “Competing on Analytics,” Harvard Business Review.
(https://hbr.org/2006/01/competing-on-analytics).
Davenport, T. H. 2018. “From Analytics to Artificial Intelligence,” Journal of Business Analytics (1:2), pp. 73–80. Farid, M., Roatis, A., Ilyas, I. F., Hoffmann, H.-F., and Chu, X. 2016. CLAMS: Bringing Quality to Data Lakes, ACM
Press, pp. 2089–2092.
Grover, V., Chiang, R. H. L., Liang, T.-P., and Zhang, D. 2018. “Creating Strategic Business Value from Big Data Analytics: A Research Framework,” Journal of Management Information Systems (35:2), pp. 388–423. Heart, T., Ben-Assuli, O., and Shlomo, N. 2018. “Using the Work System Theory to Bring Big Data Analytics to the
Inpatient Point of Care,” in ICIS 2018 Proceedings, San Francisco, CA, pp. 1–9.
Jukić, N., Sharma, A., Nestorov, S., and Jukić, B. 2015. “Augmenting Data Warehouses with Big Data,” Information
Systems Management (32:3), pp. 200–209.
Kettinger, W. J., Zhang, C., and Li, H. 2019. “Information Management Capabilities in the Digital Era: The Senior Manager’s Perspective,” in ICIS 2019 Proceedings, pp. 1–15.
Kohli, R., and Grover, V. 2008. “Business Value of IT: An Essay on Expanding Research Directions to Keep up with the Times,” Journal of the Association for Information Systems (9:1), pp. 23–39.
Madera, C., and Laurent, A. 2016. “The Next Information Architecture Evolution: The Data Lake Wave,” in Proceedings of the 8th International Conference on Management of Digital EcoSystems, MEDES, New York, USA: ACM, pp. 174–180. (http://doi.acm.org/10.1145/3012071.3012077).
Marjanovic, O. 2016. “Improvement of Knowledge-Intensive Business Processes Through Analytics and Knowledge Sharing,” in ICIS 2016 Proceedings, Dublin, Ireland, December 11, pp. 1–19.
Melville, N., Kraemer, K., and Gurbaxani, V. 2004. “Review: Information Technology and Organizational Performance: An Integrative Model of It Business Value,” MIS Quarterly (28:2), pp. 283–322.
Mikalef, P., Pappas, I. O., Krogstie, J., and Giannakos, M. N. 2018. “Big Data Analytics Capabilities: A Systematic Literature Review and Research Agenda,” Information Systems and E-Business Management (16:3), pp. 547–578.
Ransbotham, S., Khodabandeh, S., Fehling, R., LaFountain, B., and Kiron, D. 2019. “Winning With AI,” MIT Sloan
Management Review, pp. 1–23.
Ransbotham, S., and Kiron, D. 2017. “Analytics as a Source of Business Innovation,” MIT Sloan Management Review, pp. 1–16.
Schryen, G. 2013. “Revisiting IS Business Value Research: What We Already Know, What We Still Need to Know, and How We Can Get There,” European Journal of Information Systems (22:2), pp. 139–169.
Schüritz, R., Brand, E., Satzger, G., and Bischhoffshausen, J. 2017. “How to Cultivate Analytics Capabilities within an Organization? - Design and Types of Analytics Competency Centers,” in Proceedings of the 25th
European Conference on Information Systems (ECIS), Guimarães, Portugal, June 5, pp. 389–404.
Sculley, D., Holt, G., Golovin, D., Davydov, E., Phillips, T., Ebner, D., Chaudhary, V., Young, M., Crespo, J.-F., and Dennison, D. 2015. “Hidden Technical Debt in Machine Learning Systems,” in Advances in Neural
Information Processing Systems 28 (NIPS 2015), C. Cortes, N. D. Lawrence, D. D. Lee, M. Sugiyama, and
R. Garnett (eds.), Montreal, Canada, pp. 2503–2511.
Seddon, P. B., Constantinidis, D., Tamm, T., and Dod, H. 2017. “How Does Business Analytics Contribute to Business Value?: How Does Analytics Contribute to Business Value?,” Information Systems Journal (27:3), pp. 237– 269.
Shim, J. P., and Guo, C. 2015. “Big Data and Analytics: Issues, Solutions, and ROI,” Communications of the Association for Information Systems (37), pp. 797 – 810.
Sivarajah, U., Kamal, M. M., Irani, Z., and Weerakkody, V. 2017. “Critical Analysis of Big Data Challenges and Analytical Methods,” Journal of Business Research (70), pp. 263–286.
Soh, C., and Markus, M. L. 1995. “How IT Creates Business Value: A Process Theory Synthesis,” in International
Conference on Information Systems, Amsterdam, Netherlands, pp. 29–41.
Sprague, R. H. 1980. “A Framework for the Development of Decision Support Systems,” MIS Quarterly (4:4), pp. 1– 26.
Trieu, V.-H. 2017. “Getting Value from Business Intelligence Systems: A Review and Research Agenda,” Decision Support Systems (93), pp. 111–124.
Watson, H. 2014. “Tutorial: Big Data Analytics: Concepts, Technologies, and Applications,” Communications of the Association for Information Systems (34:1).
Watson, H. J. 2009. “Tutorial: Business Intelligence – Past, Present, and Future,” Communications of the Association for Information Systems (25:487–510), p. 26.
Watson, H. J. 2017. “Preparing for the Cognitive Generation of Decision Support,” MIS Quarterly (16:3).
Watson, H. J. 2019. “Update Tutorial: Big Data Analytics: Concepts, Technology, and Applications,” Communications of the Association for Information Systems, pp. 364–379.
Wixom, B., and Ross, J. 2017. “How to Monetize Your Data,” MIT Sloan Management Review (58:3), p. 7.
Yin, R. 2003. Case Study Research: Design and Methods, Third Edition, Applied Social Research Methods Series, Vol 5, London, UK: Sage Publications, Inc.