2017
Multi-omic biomarker discovery and
network analyses to elucidate the
molecular mechanisms of lung
cancer premalignancy
https://hdl.handle.net/2144/27344GRADUATE SCHOOL OF ARTS AND SCIENCES AND
COLLEGE OF ENGINEERING
Dissertation
MULTI-OMIC BIOMARKER DISCOVERY AND NETWORK ANALYSES TO ELUCIDATE THE MOLECULAR MECHANISMS
OF LUNG CANCER PREMALIGNANCY
by
ANNA MARIA TASSINARI
B.S., University of Massachusetts, 2009 M.S., Boston University, 2014
Submitted in partial fulfillment of the requirements for the degree of
Doctor of Philosophy 2017
© 2017
ANNA MARIA TASSINARI All rights reserved
First Reader _________________________________________________________ Jennifer Beane, Ph.D.
Assistant Professor of Medicine
Second Reader _________________________________________________________ Avrum Spira, M.D., M.Sc.
iv
To my husband Nate, for your unconditional love, boundless compassion, and disarming humor I could not live without.
To Mom, for your unwavering encouragement, inspiration, and excellence I will forever admire and aspire to achieve.
v
This work would not have been possible without:
My advisors and mentors – Jen, Avi and Marc: Thank you for your enthusiasm and passion for science you all shared with me. I will forever be grateful for the trust you’ve placed in me and the independence you’ve granted me. Thank you for providing me with room to grow and an opportunity to learn from my mistakes.
The Computational Biomedicine Group: Thank you for teaching me something new every day, fostering critical thinking and exchanging ideas, and inspiring
discussions.
The Bioinformatics Program: Thank you for taking the chance and giving me the unique opportunity to learn from so many brilliant scientists in the field. And thank you for always having my back.
My family - Mom and Dad Krentowicz: Thank you for your love which has not lessened despite the 4,000 miles between us. I miss you.
My extended family - Jo and Dan Tassinari: Thank you for welcoming me into your family with open arms and creating a home away from home for me.
My friends - Thank you for restoring my sense of belonging and all the memories we’ve created together. I will always cherish them.
My rock - Nate Tassinari: there are no words to describe my gratitude for your care, support and encouragement throughout this journey. You are the rock. You are the sea.
vi
TO ELUCIDATE THE MOLECULAR MECHANISMS OF LUNG CANCER PREMALIGNANCY
ANNA MARIA TASSINARI
Graduate School of Arts and Sciences, and College of Engineering, 2017 Major Professors: Jennifer Beane, Assistant Professor of Medicine and Avrum Spira,
Professor of Medicine
ABSTRACT
Lung cancer (LC) is the leading cause of cancer death in the US, claiming over 160,000 lives annually. Although CT screening has been shown to be efficacious in reducing mortality, the limited access to screening programs among high-risk individuals and the high number of false positives contribute to low survival rates and increased healthcare costs. As a result, there is an urgent need for preventative therapeutics and novel interception biomarkers that would enhance current methods for detection of early-stage LC.
This thesis addresses this challenge by examining the hypothesis that
transcriptomic changes preceding the onset of LC can be identified by studying bronchial premalignant lesions (PMLs) and the normal-appearing airway epithelial cells altered in their presence (i.e., the PML-associated airway field of injury). PMLs are the presumed precursors of lung squamous cell carcinoma (SCC) whose presence indicates an
high-vii
biopsies to develop biomarkers of PML presence and progression, and to understand regulatory mechanisms driving early carcinogenesis.
First, I utilized mRNA sequencing data from normal-appearing airway brushings to build a biomarker predictive of PML presence. After verifying the power of the 200-gene biomarker to detect the presence of PMLs, I evaluated its capacity to predict PML progression and detect presence of LC (Aim 1). Next, I identified likely regulatory mechanisms associated with PML severity and progression, by evaluating miRNA expression and gene coexpression modules containing their targets in bronchial lesion biopsies (Aim2). Lastly, I investigated the preservation of the PML-associated miRNAs and gene modules in the airway field of injury, highlighting an emergent link between the airway field and the PMLs (Aim 3).
Overall, this thesis suggests a multi-faceted utility of PML-associated genomic signatures as markers for stratification of high-risk smokers in chemoprevention trials, markers for early detection of lung cancer, and novel chemopreventive targets, and yields valuable insights into early lung carcinogenesis by characterizing mRNA and miRNA expression alterations that contribute to premalignant disease progression towards LC.
viii
DEDICATION ... iv
ACKNOWLEDGMENTS ... v
ABSTRACT ... vi
TABLE OF CONTENTS ... viii
LIST OF TABLES ... xiii
LIST OF FIGURES ... xv
LIST OF ABBREVIATIONS ... xvii
CHAPTER ONE: Introduction ... 1
1.1. Tobacco-Induced Lung Cancer As The Leading Cause Of Cancer Death .. 1
1.2. Bronchial Premalignant Lesions (PMLs) And Their Role In Lung Carcinogenesis ... 2
1.3. Role of Biomarkers in Disease Management ... 4
1.4. Concepts and Methodologies ... 7
1.4.1. RNA and miRNA ... 7
1.4.2. High-Throughput Sequencing and Microarrays ... 8
1.4.3. Genomic Biomarker Development ... 10
1.4.4. Network Analyses in Transcriptomics ... 11
ix
for Lung Cancer Premalignancy in the Airway Field of Injury ... 16
2.1. Background ... 16
2.1. Methods ... 20
2.1.1. Sample Collection ... 20
2.1.2. RNA Library Preparation and RNA Sequencing ... 24
2.1.3. Data Generation, Summarization and Quality Control ... 24
2.1.4. Gene expression-based prediction of smoking status ... 25
2.1.5. Biomarker Discovery Pipeline ... 26
2.1.6. Biomarker Validation Pipeline ... 35
2.2. Results ... 37
2.2.1. Sample Population ... 37
2.2.2. Performance Metrics ... 39
2.2.3. Selection of Best Model and Final Gene Signature ... 40
2.2.4. Positive and Negative Controls ... 41
2.2.5. Validations ... 42
2.2.6. Biological Enrichment and Pathway Analysis ... 44
2.3. Discussion ... 69
2.4. Conclusions ... 76
CHAPTER THREE: Identifying miRNA/mRNA Regulatory Interactions Associated with Severity of Lung Cancer Premalignant Lesions ... 77
x
3.2.1. Sample Collection and Histological Grading ... 80
3.2.2. RNA and miRNA Library Preparation and Sequencing ... 80
3.2.3. Data Generation, Summarization and Quality Control ... 81
3.2.4. Defining Lesion Progression ... 83
3.2.5. miRCAT – miRNA Combined Association with Traits ... 84
3.2.6. Constructing Gene Coexpression Network ... 86
3.2.7. Identifying Genes Associated with PML Grade and Progression ... 88
3.2.8. Defining miRNA Gene Targets ... 89
3.2.9. Defining miRNA “Gene Neighbors” ... 89
3.2.10. Identifying miRNA Associated with Gene Modules ... 90
3.2.11. Identifying miRNA Associated with PML Grade and Progression ... 90
3.2.12. Functional Enrichment ... 91
3.3. Results ... 91
3.3.1. Demographic and Clinical Characteristics of Sample Population ... 91
3.3.2. Gene, miRNA and Sample filtering ... 91
3.3.3. Genes Associated with PML Grade and Progression ... 93
3.3.4. miRNAs Associated with PML Grade and Progression ... 94
3.3.5. Biological Enrichment and Pathway Analysis ... 96
3.4. Discussion ... 115
xi
Associated with Lung Carcinogenesis in the Field, the Lesion and the Tumor ... 121
4.1. Background ... 121
4.2. Methods ... 122
4.2.1. Sample Collection: Bronchial Brushes from the PCGA ... 122
4.2.2. Sample Collection: Tumor Biopsies from the TCGA ... 122
4.2.3. Redefining Lesion Grade and Progression ... 122
4.2.4. Identifying genes and miRNAs Associated with Grade and Progression in Bronchial Brushings ... 123
4.2.5. Testing Preservation of Biopsy-Derived Gene Modules Associated with PML Grade and Progression in Bronchial Brushes ... 124
4.2.6. Testing Preservation of Biopsy-Derived miRNAs Associated with PML Grade and Progression in Lung SCC Tumors ... 126
4.3. Results ... 126
4.3.1. Sample Population: The PCGA brushes ... 126
4.3.2. Sample Population: The TCGA ... 126
4.3.3. Genes and miRNAs Associated with Traits of Interest in Bronchial Brushings ... 127
4.3.4. Shared Gene and miRNA Alterations Present in the Field, the Lesion and the Tumor ... 127
4.4. Discussion ... 136
xii
BIBLIOGRAPHY ... 144 CURRICULUM VITAE ... 159
xiii
Table 2.1 Performance measures used to evaluate performance of the biomarker. ... 47
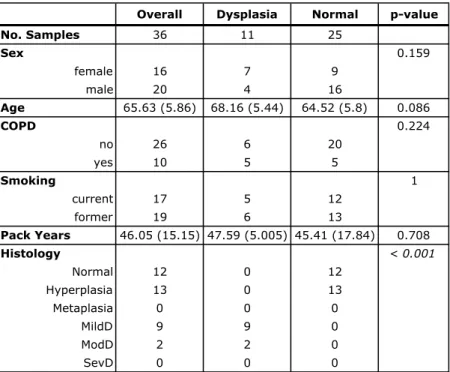
Table 2.2 Demographic characteristics of the discovery and validation sets stratified by dysplasia status. ... 48
Table 2.3 Demographic characteristics of the RNA-Seq cross-sectional bronchial brushing dataset stratified by dysplasia status. ... 49
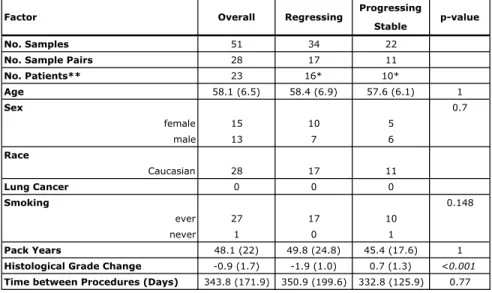
Table 2.4 Demographic characteristics of the RNA-Seq paired PML dataset stratified by PML progression/regression. ... 50
Table 2.5 Demographic characteristics of the microarray overlapping PML dataset stratified by dysplasia status. ... 51
Table 2.6 Demographic characteristics of the microarray independent PML dataset stratified by dysplasia status. ... 52
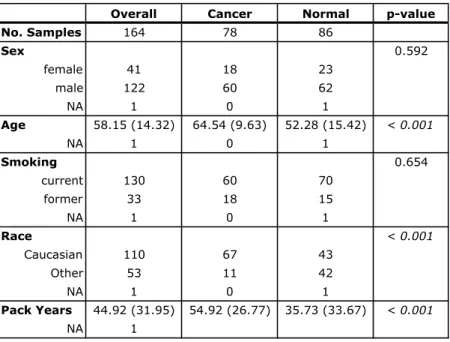
Table 2.7 Demographic characteristics of the microarray lung cancer bronchial brushing dataset 1 stratified by cancer status. ... 53
Table 2.8 Demographic characteristics of the microarray lung cancer bronchial brushing dataset 2 stratified by cancer status. ... 54
Table 2.9 Demographic characteristics of the RNA-Seq lung tumor biopsy dataset 1 stratified by cancer status. ... 54
Table 2.10 Biomarker performance in cross-validation. ... 55
Table 2.11 Best model performance ... 56
xiv
dysplasia status. ... 99
Table 3.2 Sample quality control results. ... 100
Table 3.3 WGCNA gene coexpression module sizes ... 103
Table 3.4 Gene modules significantly associated with traits. ... 104
Table 3.5 Summary of miRNAs significantly associated with traits of interest. ... 109
Table 3.6 Summary of miRNAs associated with gene modules via target sets and “neighborhoods”. ... 109
Table 3.7 miRNAs and the mediating modules universally associated with grade. ... 110
Table 3.8 miRNAs and the mediating modules universally associated with progression. ... 110
Table 3.9 miRNAs and mediating modules universally associated with smoking ... 111
Table 3.10 miRNAs and mediating modules universally associated with subtype ... 112
Table 3.11 Functional enrichment of 14 coexpression modules discovered in lesion biopsies. ... 113
Table 4.1 Demographic characteristics of the RNA-Seq PML bronchial brushing dataset stratified by dysplasia status. ... 130
xv
Figure 2.1 Biomarker discovery and validation pipelines. ... 46
Table 2.10 Biomarker performance in cross-validation. ... 55
Figure 2.2 Biomarker performance in cross validation. ... 57
Figure 2.3 Biomarker performance on positive and negative controls. ... 58
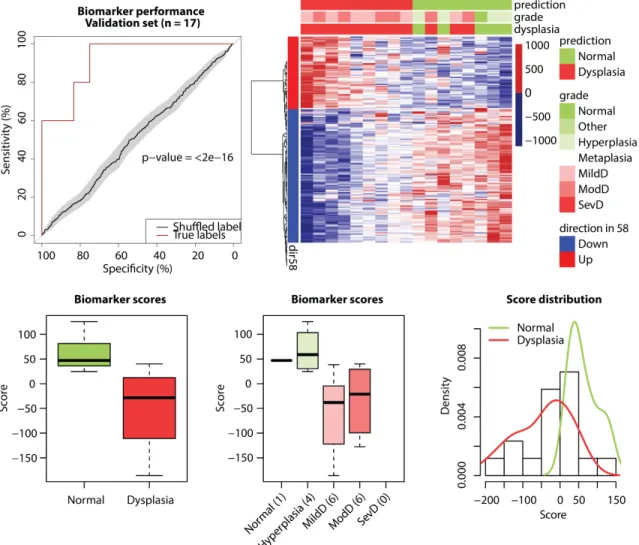
Figure 2.4 Summary of biomarker performance measures used to select the best model. 59 Figure 2.5 Biomarker performance in validation set (n=17). ... 60
Figure 2.6 Biomarker performance in an overlapping microarray set (n=36). ... 61
Figure 2.7 Biomarker performance in an independent microarray set (n=158). ... 62
Figure 2.8 Biomarker performance in a longitudinal RNA-Seq dataset (n=51). ... 63
Figure 2.9 Performance of biomarker score differences predicting progressing and stable/regressing PMLs (n=28 pairs). ... 64
Figure 2.10 Biomarker performance in a microarray lung cancer set 1. ... 65
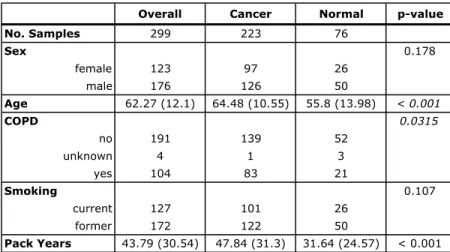
Figure 2.11 Biomarker performance in a microarray lung cancer set 2 (n=299). ... 66
Figure 2.12 Biomarker performance in an RNA-Seq lung SCC tumor biopsy dataset (n=553). ... 67
Figure 3.1. Example lung map of biopsy locations and corresponding histology grades changing over time. ... 79
Figure 3.3 Conceptual representation of miRCAT results. ... 101
Figure 3.4 Summarized module eigengene relationships. ... 102
Figure 3.5 Consensus WGCNA. ... 103
xvi
Figure 3.8 Progression and subtype-associated miRNAs from cluster 2 ... 106
Figure 3.9 Grade and subtype-associated miRNAs from cluster 3 ... 107
Figure 3.10 Grade-associated miRNAs from cluster 4 ... 107
Figure 3.11 Target overlaps in clusters containing coexpressed miRNAs. ... 108
Figure 4.1 Biopsy-derived module preservation in brushing data. ... 132
Figure 4.2 Biopsy-derived modules are enriched in brushes and tumor biopsies. ... 133
Figure 4.3 Trait associated miRNAs are enriched in brushes and tumor biopsies. ... 134
Figure 4.4 Targets of trait associated miRNAs are enriched in brushes and tumor biopsies. ... 135
xvii cfDNA cell-free DNA
CIS Carcinoma in situ
CT Computer Tomography
ctDNA circulating tumor DNA DNA Deoxyribonucleic Acid FDR False Discovery Rate FET Fisher’s Exact Test
GSEA Gene Set Enrichment Analysis
miRNA microRNA
NLST National Lung Screening Trial NSCLC Non-Small Cell Lung Cancer
PC Principal Component
PCA Principal Component Analysis PCGA Pre-Cancer Genome Atlas PML Premalignant Lesion RNA Ribonucleic Acid
SCC Squamous Cell Carcinoma TCGA The Cancer Genome Atlas
CHAPTER ONE:Introduction
1.1. Tobacco-Induced Lung Cancer As The Leading Cause Of Cancer Death
Every 200 seconds someone in the U.S. loses their battle with lung cancer 51. While the great majority of these deaths could be prevented by eliminating their main cause - the active exposure to tobacco smoke, lung cancer could be cured even in long-time heavy smokers if it was detected early, i.e. before it has spread to lymph nodes or metastasized. In fact, only about 18% of patients live with the diagnosis more than 5 years - a number shockingly low in comparison to breast cancer’s (90%), prostate cancer’s (99%), and colorectal cancer’s (65%) 5-year survival rates 51. Yet, there exists a significant disparity among these cancers in research funding. In 2014, the National Cancer Institute awarded an estimated $254mln (https://fundedresearch.cancer.gov) to lung cancer research, paying more than twice as much to breast cancer which accounts for only a quarter as many annual deaths 51. Counterintuitively, lung cancer’s societal burden, which can be quantified as years of life lost (YLL) or disability-adjusted life-years (DALY) significantly surpasses that of other leading cancers, contributing to increased health-care and economic costs 27. Motivated by the low survivability and high
societal costs, many researchers have focused their efforts on developing much needed early lung cancer screening methods, that would allow detection in subjects presenting without evident symptoms.
In 2002-2004 the National Lung Screening Trial (NLST) recruited over 50,000 participants with smoking history to compare the efficacies of low-dose computed-tomography (CT) and chest radiography (X-ray) in reducing mortality from lung cancer by detecting tumors at an early stage 109. Participants were randomized into two groups, screened annually for 3 years with the group-assigned method and followed. The NLST Research Team found that low-dose CT performed better at detecting clinically
significant abnormalities and ultimately led to a reduction in deaths 15-20% larger as compared to X-ray. However, the rate of overdiagnosis by CT (percentage of suspected lung tumors ending up being slow-growing and non-life threatening or completely benign) of non-small cell lung cancer (NSCLC) was high, at 22.5% 32,91. These results suggest that benefits from early lung cancer detection with CT should be weighed against the potentially incurred extra healthcare cost as well as health risks including unnecessary surgery or harmful chemotherapy in overdiagnosed cases, and that refocusing efforts on the precancerous stages of disease where intervention benefits outweigh the risks may improve lung cancer mortality rates just as well.
1.2. Bronchial Premalignant Lesions (PMLs) And Their Role In Lung
Carcinogenesis
Bronchial premalignant lesions (PMLs) are histological abnormalities in the central airways, characterized by variably thickened basement membrane separating the epithelium from the underlying connective tissue 1. They can be observed and sampled
via autofluorescence bronchoscopy, and reproducibly graded by a pathologist 86. The
natural history of PMLs, which follows a step-wise progression model whereby normal cells proceed through pathological stages from basal-cell hyperplasia and squamous metaplasia, to mild, moderate and severe dysplasia, to carcinoma in-situ, has been well documented 63,748,103.
Collectively referred to as dysplasia, PMLs are the presumed precursors of lung squamous cell carcinoma (SCC) 55. Several premalignant lesion prevalence studies showed that high-grade dysplasia has a higher prevalence in patients with invasive carcinoma and that the lesion number and severity correlate with increased risk for developing lung cancer 8,10,48,90,127. What is more, subjects with lesions that progress or persist over time, have been shown to have increased risk of progressing to invasive SCC
83, and more often than not, the invasive SCC was observed to develop at a location that
was different from the location of the monitored lesion 136. In addition, there exists limited evidence that mortality from lung cancer could improve by 90% if the
premalignant lesions were detected and treated early 31. However, because of the fact that PMLs are dynamic and do not strictly follow the linear progression model (their
histology might worsen and improve multiple times within a patient 22) there is a lack of a well-established causal link between the lesions and the disease, which may explain why the current standard of care excludes monitoring PMLs in the context of prevention or early detection of lung cancer. Thus, pursuing PML detection and monitoring in the
context of early stage diagnostics may help refine the link between premalignant disease and lung tumorigenesis.
1.3. Role of Biomarkers in Disease Management
Biomarker discovery is a promising area of research focusing on deciphering predictive signatures responsible for disease onset, development, or prognosis, and applying these signatures to improve disease diagnosis, management, and treatment. The National Institutes of Health Biomarkers Definitions Working Group defines a biomarker as “a characteristic that is objectively measured and evaluated as an indicator of normal biological processes, pathogenic processes, or pharmacologic responses to a therapeutic intervention.” 124 Depending on their intended clinical purpose, biomarkers can aid in disease-risk assessment (e.g. serum-based biomarker for Alzheimer’s disease 76 or blood
gene expression-based biomarker for sarcoidosis 150), detection of preexisting conditions (e.g. lipid-based biomarker for Acute kidney injury 29,108), determination of disease progression rate (e.g. imaging-based biomarkers for Parkinson’s disease 81 and Alzheimer’s disease 82), and patient stratification for improved targeted therapy (e.g. EGFR mutations in non-small cell lung cancer 129). In addition, many biomarker-based
diagnostics use non-invasive procedures making them more accessible, easier to administer, and posing lesser patient burden.
Of great interest to this work are lung cancer biomarkers. A wide range of sample types, platforms and molecules have been used over the past several decades to develop
biological markers that would aid in the identification of subjects at high risk for developing lung cancer or those with a potentially curable early-stage disease (as reviewed in Brothers et al.23). Among epigenetic biomarkers, many focus on processes involved in DNA methylation, which can affect downstream phenotypes without the modification of the DNA itself. For example, Belinsky et al. have used genome-wide methylation profiling of sputum and lung biopsy samples to identify P16-INK4A (CDKN21) as hypermethylated in lung tumors and sputum samples of smokers17. This result was recapitulated one year later in another study that used paired serum and lung tissues 35. In addition, high methylation of SHOX2 was determined to be indicative of the presence of malignant disease in subjects with suspect lung cancer using bronchial fluid aspirated during bronchoscopy 106 and plasma 65. More recently, a risk classification
model was used to identify a panel of three genes whose methylation status was capable of identifying subjects at varied lung cancer risk levels (i.e., RASSF1A was found to be hypermethylated in the high-risk group with at least 60% chance of developing lung cancer, while 3OST2 and PRDM14 were hypermethylated in the low-risk groups) 52. Among gene expression-based biomarkers, some utilize easily accessible bronchial brushings of normal-appearing epithelium and the notion of field cancerization, which characterizes the transcriptomic changes in the normal airway as reflective of smoking status and lung cancer. For example, Spira et al. have developed an 80-gene biomarker that distinguished between samples from subjects with and without lung cancer with 83% accuracy 120. A follow-up study has demonstrated the biomarker’s independence from
clinical covariates and its increased value as a component of a combined clinicogenomic model 14. The biomarker has since been refined 141 and validated 114. Another study identified a panel of 14 antioxidant and DNA repair-associated genes whose extreme expression (either low or high) was prevalent in brushes from subjects with and without lung cancer 19. In addition, several blood-based gene-expression diagnostic biomarkers have been attempted. Although white blood cells have been shown to share alternations characteristic of lung tumors 113,146, a limited number of transcriptomic studies
demonstrates high performance in plasma and serum, mostly due to the instability of circulating mRNA 23. However, several studies have now turned to liquid biopsy as a means to identify blood-based biomarkers using circulating tumor DNA (ctDNA) and cell-free DNA (cfDNA), which are believed to be released into the bloodstream via processes such as apoptosis and necrosis, and whose levels can be easily monitored in patients over time. Although still in nascent stages of development and validation, these proof-of-concept biomarkers show great promise in monitoring tumor burden 33,37,128, identification of mechanisms of resistance in EGFR-mutated NSCLC 89,117, prediction of response to chemotherapy with carboplatin in KRAS-mutated NSCLC 87, or prediction of
response to tyrosine kinase inhibitor in EGFR-mutated NSCLC 77. Finally, miRNA-based biomarkers have played a significant role in lung cancer diagnosis and assessment of premalignant disease. In a 2009 study, Mascaux et al. have identified a panel of miRNAs dysregulated in premalignant lesion biopsies of varied severity 79. In another study, a small set of miRNAs were shown to discriminate between subjects with stage I SCC and
controls 143. Interestingly, several miRNA-based biomarkers have also leveraged liquid
biopsy in plasma samples. Boeri and Sozzi et al. have identified 21 and validated in large Italian cohort, a plasma-based miRNA panel, which when coupled with low-dose CT (LDCT), reduced the LDCT rate of overdiagnosis five-fold 118. Furthermore, the 24-miRNA biomarker was also evaluated from a perspective of disease prognosis. At baseline, biomarker scores from 84 subjects with LC detected by LDCT were binned according to the estimated level of risk, and checked again at follow-up five years later. Survival rates were found to be strongly correlated with assigned risk groups 110. Also utilizing plasma samples, Shen et al. found miR-21, miR-210 and miR-486-5p to be capable of distinguishing plasma samples from subjects with malignant vs. benign solitary pulmonary nodules (SPNs) detected previously by CT (or controls) with 75% sensitivity and 85% specificity 112. Similarly, a panel of 13 miRNAs discovered using sputum samples, was shown to differentiate between malignant and benign SPNs and offer potential reduction in CT-related overdiagnosis rates 142.
1.4. Concepts and Methodologies
1.4.1. RNA and miRNA
Phenotypic diversity is believed to be vastly influenced by variation in gene expression patterns. An intermediary between DNA and protein, mRNA molecules (messenger RNAs) carry genetic information from the cell’s nucleus to the cytoplasm, and the control of their transcription from DNA and translation into protein plays a
crucial role in the regulation of gene expression and thus cell function. Molecular events impacting the behavior of oncogenes and tumor-suppressor genes, such as mutations, gene amplifications, and chromosomal rearrangements are well described in
carcinogenesis (as reviewed in Brothers et al.96). Recently, post-transcriptional
regulation mediated by microRNAs (miRNAs) has been observed to play an important role in lung carcinogenesis 93. miRNAs are short (~22 nt) non-protein-coding
single-stranded RNAs (ssRNAs) which regulate gene transcription by binding via imprecise sequence-specific base-pairing to their mRNA target’s 3’ end. One miRNA can regulate tens to hundreds of genes at once, and it is said that 30% of protein-coding genes are affected by miRNAs 75,93. In cancer, dysregulation of oncogenic miRNAs can promote excessive cell proliferation and impairment of apoptosis by targeting tumor suppressors for degradation, expression reduction, or both 57. Recently, Perdomo et al demonstrated the importance of miR-4423 in primate-specific repression of lung carcinogenesis and regulation of airway epithelial cell differentiation 94. miRNAs promise clinical utility as disease biomarkers and potential therapeutic targets due to their increased stability and tissue-specific expression compared to mRNAs.
1.4.2. High-Throughput Sequencing and Microarrays
The detection and quantification of gene expression is possible thanks to DNA microarrays. A microarray is a microscope slide with thousands of tiny holes containing probes of genes or other known DNA sequences organized in a grid. mRNA samples
collected from studied individuals are first converted into cDNA (complementary DNA), labeled with distinct color dyes and allowed to hybridize (bind) to the chip. The
expression of each gene in a sample is treated as proportional to the observed intensity of color in a location on the chip with a given gene. Although newer technologies have started to replace microarrays in many research labs, historically these arrays have facilitated the creation of an extensive collection of differential expression studies that should not be overlooked.
More recently, next generation sequencing (NGS) has taken transcriptomics by the storm by offering a wider dynamic range of detection, the ability to identify novel transcripts, reduced background noise, and increased cost-effectiveness due to
multiplexing capabilities. RNA-Seq protocol typically involves isolating total RNA from samples under investigation. For mRNA-specific sequencing, the naturally
polyadenylated (poly-A) mRNA molecules are first purified using oligo-dT magnetic beads and fragmented. Then, the RNA fragments are reverse transcribed into the first strand complementary DNA (cDNA), after which the second cDNA strand is also
synthesized. Fragment ends are repaired (overhangs are converted into blunt ends), and a single A nucleotide is added to the 3’ end. Indexing adapters containing a complimentary T nucleotide are then ligated to the cDNA fragments. Using PCR, DNA libraries carrying adapters are amplified and then summarized to reflect overall transcript abundance (Illumina®). Because miRNAs lack the poly-A tail, additional steps have to be taken to select for these small molecules prior to reverse transcriptase. Specifically, total RNA can
be size-fractionated by gel electrophoresis, which involves cutting and purifying a gel fragment containing only sequences of desired length (~22 nucleotides) 66.
Most analyses in this thesis rely on RNA and miRNA-Seq transcriptomics
experiments, but microarrays play an important role in validating of some of the findings.
1.4.3. Genomic Biomarker Development
A typical biomarker development process involves multiple stages designed to ensure proper formulation of the biomarker, its adequate validation (both from a computational as well as a clinical utility point of view), and finally translation into the clinic 41. The general idea behind the various steps is to provide a robust and useful tool that will fulfill an unmet need, be easy to administer, and pose great benefit and minimal risk to the patient.
Briefly, at the discovery stage markers are first identified using methodologies aimed at answering a predefined question. This may include genes or miRNAs whose expression correlates with treatment response, disease prognosis, or subject
risk-stratification. Ideally, the biomarker can then be internally validated on a random subset of samples left out of the biomarker discovery process to prevent bias. Alternatively, cross-validation approaches can also be employed in cases where samples size is small. In addition, at this stage, biomarker’s independence from clinical and demographic covariates (e.g. sex, age, smoking status, prior cancer history) is also established. Then, external validation in additional independent datasets takes place, as well as experimental
validation of biomarker candidates. Clinical utility is then assessed by evaluating
performance metrics such as sensitivity (percentage of subjects with a condition who are identified as such), specificity (percentage of subjects without a condition who are identified as such), positive predictive value (probability of a positive test correctly identifying subjects with a condition) and negative predictive value (probability of a negative test correctly identifying subjects without a condition).
1.4.4. Network Analyses in Transcriptomics
Unlike monogenic diseases (e.g. sickle-cell anemia or Huntington’s), lung cancer is a complex disease, in which atypical phenotype is manifested through an abnormality not in a single gene but the entire complex molecular machinery. To understand how these anomalies cause disease phenotypes, it is essential to study the entire system, as the organization within biological networks is not random 11.
Typically, biological networks can be visually represented by graphs –
mathematically derived net-like structures containing nodes connected to each other with edges. While nodes often correspond to molecular components of the cell, edges can represent a wide array of biological interactions between them. For example, metabolic networks represent the biochemical and molecular processes that take place in a cell in order to maintain life, with many subnetworks corresponding to metabolic pathways 20. Cell signaling networks showcase how individual signaling pathways affect each other, elucidating the manner in which a biological system may respond to a signal. In
protein-protein interaction networks 56. In epistasis interaction networks, genes are connected if
there exists an interaction between them when one is knocked out or down-regulated 107. Edges in disease-gene interaction networks represent mutational events that cause or contribute to the disease and typically connect a phenotype to a genotype underscoring the complexity of disease. In drug interaction networks, therapeutics are linked to their targets, highlighting the many-to-many relationships 88. Finally, gene regulatory networks
display cellular mechanisms governing cell function by regulation of mRNA transcription and translation into protein 60.
Of great interest to this work are gene coexpression networks, which use
expression-profile correlation as a measure of gene similarity and are becoming popular tools in biomedical research 116. Weighted Gene Coexpression Network Analysis
(WGCNA) 147 described in detail in Chapter 3 has been successfully applied in late onset Alzheimer’s disease (LOAD) to identify an immune and microglia module strongly associated with pathophysiology of LOAD, and TYROBP as a master regulator
implicated in neuronal damage 18. Another study used WGCNA to develop a small-cell lung cancer specific classifier with capacity to stratify patients for therapy. Spleen tyrosine kinase (SYK) was identified as a potential oncogene which could be targeted in
SYK-positive patients 135. In general, network-based approaches offer advantages in biological and clinical settings, as they provide system-wide context for single genes implicated in a disease and elucidate the influence of interconnectedness of cellular components on phenotype. What is more, they may aid in disease classification and drug
target identification (reviewed in Barabasi et al. 11). Finally, we can use them to
understand the molecular modifications that take place in a diseased or otherwise perturbed system, by exploring the topological alterations we observe in a network.
1.5. Dissertation Aims
This thesis examines the hypothesis that transcriptomic changes preceding the onset of lung cancer can be identified by studying bronchial premalignant lesions (PMLs) and the normal-appearing airway epithelial cells altered in their presence (i.e., the PML-associated airway field of injury). In the following aims, I leverage high-throughput mRNA and miRNA sequencing data from bronchial brushings and lesion biopsies to develop biomarkers of PML presence and progression, and to understand regulatory mechanisms driving early carcinogenesis.
Aim1: Develop and validate a gene expression-based biomarker for lung cancer premalignancy in the airway field of injury
Since PMLs are the presumed precursors of squamous cell carcinoma and tend to occur more frequently in patients with invasive carcinoma, they constitute risk factors for developing lung cancer. Currently detectable only via autofluorescence bronchoscopy, PMLs are not monitored as part of standard of care partially due to limited access to and relative invasiveness of the technology, as well as lack of reliable surrogate endpoints (i.e. intermediate markers such as PML regression that (a) may strongly correlate with and (b) be more easily measured in lieu of true endpoints such as a decrease in lung
cancer-related mortality). In addition, PML histology within a patient can vary greatly and more peripheral lesions may be missed by bronchoscopy. Thus, to address these challenges, in this aim I utilized mRNA sequencing data from normal-appearing airway brushings obtained from the main stem bronchus using widely-available white-light bronchoscopy, to build a biomarker predictive of PML presence, with a capacity to identify PMLs likely to progress. Given the field’s potential to reflect the overall health of the airway, the biomarker could help identify high-risk smokers in need of a more aggressive follow-up.
Aim2: Identify miRNA/mRNA regulatory interactions associated with severity and progression of lung cancer premalignant lesions
Although the natural history of PMLs is thought to follow a step-wise process in which histologically normal cells gradually acquire the characteristics of cytological atypia, the PMLs are dynamic and can worsen and improve multiple times within a patient. In addition, little is known about the effects of mRNA/miRNA interactions on lesion progression. In this aim, I sought to find out if gene and miRNA expression extracted from lesion biopsies harbored information about PMLs’ potential to change over time. I identified likely regulatory mechanisms associated with PML severity and progression, by evaluating miRNA expression and gene coexpression modules containing their targets in bronchial lesion biopsies.
Aim3: Identify shared genomic and regulatory alterations associated with lung carcinogenesis in the field, the lesion and the tumor.
Gene expression extracted from bronchial brushings proved to have great utility in detecting the presence of PMLs in Aim1. Additionally, in Aim 2 gene expression extracted from lesion biopsies was demonstrated to be reflective of PML severity and progression. In this aim, I examined the preservation of the PML-associated miRNAs and gene modules in the airway field of injury, highlighting an emergent link between the airway field and the PML and thus a potential for leveraging bronchial brushes to monitor PMLs over time. In addition, I evaluated the preservation of PML-associated regulatory mechanisms in tumors.
CHAPTER TWO:Developing and Validating a Gene Expression-Based Biomarker for Lung Cancer Premalignancy in the Airway Field of Injury
2.1. Background
Bronchial premalignant lesions (PMLs) are histological abnormalities in the airway characterized by the presence of dysplastic tissue 8. Although typically presumed to be precursors for lung squamous cell carcinoma (SCC), PML presence anywhere in the airway can be a risk marker for the development of any subtype of lung cancer 54. Several premalignant lesion prevalence studies showed that high-grade dysplasia was often present in patients with invasive carcinoma 127 and that the lesion number and severity correlate with increased risk for developing lung cancer [reviewed in Banerjee et al.10]. In addition, mortality from lung cancer is estimated to improve by 90% if the premalignant lesions were detected and treated early 10. In light of this evidence, pursuing PML detection in the context of chemoprevention looks promising, and could help identify high-risk patients in need of such an intervention.
Although CT screening has been successful at detecting early stage lung cancers, it is not sensitive enough to detect central lesions. As an alternative, airway monitoring can be performed with the use of flexible bronchoscopy. In order to visualize the lesions, the procedure requires the use of an autofluorescent light that makes the affected
bronchial mucosa appear brown in comparison to the surrounding unaffected tissue which appears green. While fairly effective, with 89% sensitivity (as opposed to 67% of white
light bronchoscopy) 36, autofluorescence bronchoscopy is not commonly available and
many major health centers across the country lack the access to this equipment. A much more conventional and accessible technology is white-light bronchoscopy, which, while widely used as a follow-up diagnostic in patients with suspect lung cancer nodules detected by CT, lacks the sensitivity to detect PMLs and central cancers such as SCC . In addition, due to the lack of successful chemopreventive agents and effective risk
assessment methods, the need for intermediate end-point biomarkers that would account for more than just demographic and clinical characteristics is clear 63.
Cigarette smoke is a known carcinogen 50 which induces smoking-related airway damage. Upon exposure, the genomic response of cytologically normal epithelial cells that line the respiratory tract becomes altered, reflecting the existence of an airway “field of injury”. In the past couple of decades, several studies have demonstrated the validity of this hypothesis 111,119. In 2007, Beane et al. have used bronchial brushings to identify subsets of gene expression changes that were slowly reversible or irreversible upon smoking cessation 15. In the context of chemoprevention, whereby “pharmaceutical interventions slow or reverse the progression of pre-malignancy to invasive cancer” 121,
in a study by Gustafson et al. the PI3K pathway, which plays a crucial role in cell growth and survival, was shown to be upregulated in the normal airway of subjects with
dysplasia and respond to chemoprevention treatment with myo-inositol 44. Similarly, in a placebo-controlled trial conducted by Keith et al.62, treatment with iloprost (a
average dysplasia grade across all observed lesions among former smokers. In the context of chronic obstructive pulmonary disease (COPD), Steiling et al. have identified
transcription factor ATF4 as a transcriptional regulator of the airway gene expression response 122, while Androutsopoulos et al. found that genes implicated in the metabolism of xenobiotics, including the cytochrome P450 enzyme CYP1A1, were upregulated in the normal airway of smokers with COPD 6. Similarly, miRNA expression modifications
have been demonstrated in the normal airway exposed to tobacco smoke 105and linked to smoking-related medical conditions: A set of antioxidant genes was found to be
upregulated in smokers with chronic bronchitis 46. Multiple miRNAs have been identified as slowly-reversing their expression upon smoking cessation and linked to lung cancer due to their association with cell differentiation and inflammatory disease pathways 138.
Finally, miR-218 was identified as a tumor suppressor regulating inhibition of cancer cell proliferation and EGFR-mediated migration in NSCLC 151. Given the strong genomic signal resulting from cigarette-smoke exposure, the airway may be a marker for not only smoking status, but also the underlying disease state that is caused by the smoking-related gene and miRNA modifications.
Spira et al have previously developed a gene-expression biomarker for lung cancer 120utilizing the airway field of injury hypothesis. The biomarker was built using airway brushings from 77 patients undergoing bronchoscopy, and achieved accuracy, sensitivity and specificity of 83%, 80%, and 84%, respectively, on an independent test set. When coupled with cytopathology as compared to bronchoscopy alone, the
biomarker showed a two-fold increase in diagnostic sensitivity. The 80-gene signature predicted cancer in patients with negative cytopathology with 95% certainty; similarly, both negative tests predicted the patient to be cancer-free with 70% certainty. In addition, a follow-up study has demonstrated the biomarker’s independence from clinical
covariates and its increased value as a component of a combined clinicogenomic model
14. More recently, the gene-expression based biomarker was refined and validated in a
large clinical trial 114,141. The 17-gene biomarker provides an intermediate step between a non-diagnostic bronchoscopy and invasive nodule biopsy, in patients with intermediate pulmonary nodules detected by CT. These promising results suggest that the large-scale adoption of such lung cancer diagnostic biomarkers in the clinic could reduce patient care costs and shorten the wait time before a final diagnosis is made improving outcome and patient’s quality of life.
In this chapter, we are extending this paradigm by developing a gene-expression based biomarker using cytologically normal airway epithelial cells that reflect the presence of premalignant lesions in high-risk smokers. This valuable tool developed to detect and assess bronchial premalignant lesions could aid in stratification of high-risk patients into chemoprevention trials, identification of the most effective chemopreventive agent, and detection of lesions warranting aggressive follow-up.
2.1. Methods
2.1.1. Sample Collection
Bronchial brushings of normal-appearing airway collected cross-sectionally from high-risk subjects with and without PMLs profiled by RNA-Seq
Autofluorescence bronchoscopy was performed to obtain bronchial airway brushings from subjects enrolled in the British Columbia Lung Health Study (BC-LHS) at the British Columbia Cancer Agency (BCCA) (Vancouver, BC) between June 2000 and March 2011130. In addition, during the procedure PMLs were sampled (if present) and evaluated by a team of pathologists. Histological lesion grade was assigned to each sampled PML and the worst histology observed was recorded and assigned to the corresponding, normal-appearing brushing. The study participants with normal or hyperplasia histology enrolled in the BC-LHS were current or recent former smokers between 50 and 75 years old with no prior history of lung cancer, who smoked for at least 20 years and whose estimated 3-year lung cancer risk was at least 2%. Baseline bronchial brushes were collected from subjects with evidence of PMLs enrolled in multiple
chemoprevention studies, were current or recent former smokers between 40 and 79 years old with no prior history of lung cancer and at least 30 pack years (i.e. having smoked 1 pack a day for 30 years).
Bronchial brushes of normal-appearing epithelium from 84 BCCA subjects (1 brush from each subject) with and without PMLs were selected to undergo mRNA-Seq
while ensuring balanced clinical covariates, such as age, pack years, race, sex, and COPD status.
The data is available from NCBI’s Gene Expression Omnibus (GEO) using the accession ID GSE79315.
Bronchial brushings of normal-appearing airway collected longitudinally from high-risk subjects with history of PMLs profiled by RNA-Seq
Additional bronchial airway brushings were obtained from subjects participating in the High-Risk Lung Cancer-Screening Program at Roswell Park Cancer Institute (RPCI) (Buffalo, NY) between December 2009 and March 2013. These subjects were at high risk for developing lung cancer by either having a prior history of lung or
aerodigestive cancers or by being a current or recent former smoker at least 50 years of age, with at least 20 smoked pack years. Fifty-one bronchial brushes of normal-appearing epithelium from 23 RPCI subjects with and without PMLs were profiled by mRNA-Seq (18 subjects had 2 procedures and 5 subjects had 3 procedures). Samples were classified as stable/progressive if the worst histological grade at the second time point for a given patient remained the same or worsened, and regressive if the worst histological grade at the second time point improved. The RPCI samples were utilized in biomarker validation to evaluate its power to identify subjects with progressing lesions by calculating
differences in the biomarker score between sequential procedures. The data is available as part of GSE79315.
Bronchial brushings of normal-appearing airway collected cross-sectionally from subjects with and without COPD and PMLs profiled by microarrays
A total of 238 bronchial airway brishings from current and former smokers with and without COPD and PMLs were profiled on Affymetrix Human Gene 1.0 ST Array as described in Steiling et al122 and used as an external source of validation samples to further evaluate the biomarker’s ability to detect PMLs. CEL files with mRNA expression were downloaded from GEO (GSE37147) and processed by Dr. Jennifer Beane using Robust Multi-array Average (RMA) 53 and the Ensembl Gene CDF v16.0.0 file
(http://brainarray.mbni.med.umich.edu/Brainarray/Database/CustomCDF/16.0.0/ensg.asp
) to standardize gene annotation. Fourty four samples were filtered out based on sex mismatches and quality. A subset of 36 samples profiled on microarrays as part of the study originated from BCCA subjects and was used as an overlapping validation set. The remaining 158 bronchial airway brushings obtained and profiled in the same manner from additional subjects at high risk of developing lung cancer, were used as an independent validation set.
Bronchial brushings of normal-appearing airway collected cross-sectionally from subjects with and without lung cancer and profiled by microarrays.
Current and former smokers with suspect lung cancer underwent flexible bronchoscopy as part of two additional microarray studies. A total of 164 samples
in GEO as GSE4115. A total of 299 samples described by Silvestri et al114 were profiled
on Affymetrix Human Gene 1.0 ST Array and deposited in GEO as GSE66499. These extra bronchial brushing datasets were downloaded from GEO in CEL format and processed using Robust Multi-array Average (RMA) 53 and the Ensembl Gene CDF v16.0.0 file
(http://brainarray.mbni.med.umich.edu/Brainarray/Database/CustomCDF/16.0.0/ensg.asp
) to standardize gene annotation. Both studies were used to validate the biomarker’s ability to distinguish brushings from subjects with and without lung cancer.
Tumor and adjacent normal biopsies collected cross-sectionally from subjects with lung squamous cell carcinoma and profiled by RNA-Seq.
Tumor (n=502) and matched adjacent normal (n=51) samples collected from subjects with squamous cell lung cancer were profiled by mRNA-Seq by The Cancer Genome Atlas (TCGA) Research Network Team 137. RSEM-normalized log2-transformed counts along with the corresponding clinical data were downloaded from the UCSC Xenabrowser, which provides access to TCGA’s Genomic Data Commons (GDC) Data Portal, and used to evaluate the biomarker’s ability to distinguish normal from tumor samples originating from subjects diagnosed with lung cancer.
The Institutional Review Boards (IRBs) of all participating institutions approved the studies and all subjects provided written informed consent.
2.1.2. RNA Library Preparation and RNA Sequencing
Total RNA was extracted from bronchial brushings using miRNeasy Mini Kit (Qiagen). Sequencing libraries were prepared from total RNA samples using Illumina® TruSeq® RNA Kit v2 and multiplexed in groups of four using Illumina® TruSeq® Paired-End Cluster Kit. Each sample was sequenced on the Illumina® HiSeq® 2500 to generate 100-nucleotide paired-end reads. Demultiplexing and generation of FASTQ files were performed using Illumina® CASAVA v1.8.2.
2.1.3. Data Generation, Summarization and Quality Control
For the BCCA samples, sequencing reads in FASTQ format were aligned to the reference human genome (hg19) using TopHat (v2.0.4) 132 with default parameters. The insert size mean and standard deviation were determined empirically based on alignment results using MISO 61. Reads were realigned using TopHat and the insert size parameters. Alignment and quality metrics were calculated using RSeQC v2.3.3 140. To assess 3’ bias per sample, the gene-body ratio metric was derived as the ratio between the average read coverage at 80% of the gene length and the average coverage at 20% of the gene length. Gene count estimates were derived using Python-based HTSeq-count 4 and the Ensembl
v64 annotation in the General Transfer Format (GTF). Gene filtering was first conducted on normalized counts per million (CPM) calculated using edgeR and a modified version of the mixture model employed in the SCAN.UPC 95 Bioconductor package.A gene was
included in downstream analyses if the mixture model classified it as “on” (i.e. “signal”) in at least 15% of the samples.
In addition, to provide cross-platform compatibility, biomarker discovery and validations were performed on common 11,926 genes present on the RNA-Seq platform (Illumina HiSeq 2500 used with Ensembl v64 GTF) and two microarray platforms (Affymetrix GeneChip Human Gene 1.0 ST Array used with custom ENSG Homo sapiens CDF from Brainarray v11 and Affymetrix Human Genome U133A Array used with custom ENSG Homo sapiens CDF from Brainarray v16).
For the RPCI samples, gene counts were computed using RSEM 72 and Bowtie 69 with Ensembl v74 GTF annotation.
The sample and gene filtering methods for the (a) overlapping and independent bronchial brushing samples from subjects with and without COPD and PMLs profiled by microarray 122, (b) the bronchial brushing samples from subjects with and without lung cancer profiled by microarray 114,120, and (c) the TCGA LUSC tumor and adjacent normal biopsies from subjects with lung cancer profiled by RNA-Seq 137, are described in the corresponding publications.
2.1.4. Gene expression-based prediction of smoking status
Microarray data from Beane et al. 16(Gene Expression Omnibus [GEO] accession ID GSE7895) was re-analyzed by Dr. Jennifer Beane using Robust Multi-array Average (RMA) 53 and the Ensembl Chip Definition File (CDF v16.0.0)
(http://brainarray.mbni.med.umich.edu/Brainarray/Database/CustomCDF/16.0.0/ensg.asp
). The limma R package 99 was used to identify genes differentially expressed between current (n=52) and never (n=21) smokers as previously described 15. Ninety-four genes (FDR<0.001) were differentially expressed between current and never smokers. The weighted voting algorithm 134 was trained on z-score normalized microarray data (n=73) across the 94 genes and used to predict smoking status in the 75 mRNA-Seq samples summarized with z-scored log2-transformed counts per million (log2 CPM).
2.1.5. Biomarker Discovery Pipeline
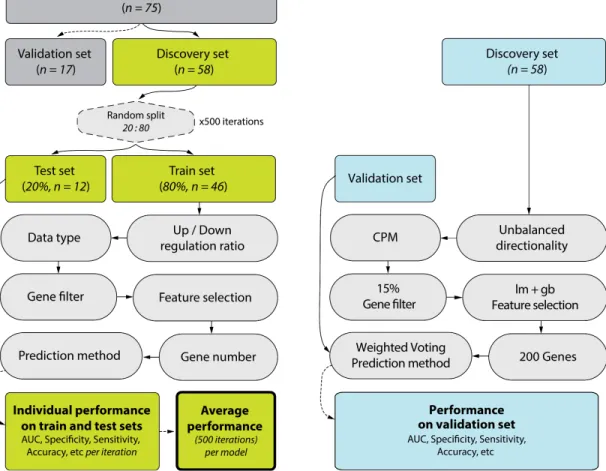
A gene expression biomarker discovery pipeline was developed to test thousands of parameter combinations to identify a biomarker capable of distinguishing between samples from subjects with and without PMLs. Samples were first assigned by batch (corresponding to sequencing lane) to either a discovery set (n=58) or a validation set (n=17), and the validation set was excluded from biomarker development. The biomarker was developed using subsets of the discovery set established by randomly splitting the samples into training (80%, n=46) and test (20%, n=12) sets 500 times, setting a common random seed of 150112. In each iteration, training set samples were passed through a series of six biomarker discovery steps, and the last step involving class prediction was in addition applied to the test set samples. The flowchart in Figure 2.1 and the following sections describe the pipeline steps in detail:
1. Balancing Signature
We tested gene signatures consisting either of an equal or unequal number of genes up- and down-regulated in subjects with dysplastic lesions.
2. Input Data Preprocessing
We tested three input data types. HTSeq-count (v0.5.4) 3 was used to derive gene count estimates (raw counts). In addition, Cufflinks (v2.0.2) 133 was used to derive reads
per kilobase per million mapped reads (RPKM) using BAM files containing only
properly paired reads. We also calculated log2-transformed counts per million (CPM) by applying edgeR (v3.8.6) 101 to raw counts using the “TMM” method (weighted trimmed mean of M-values 102).
3. Gene Filtering
Signal-basedgene filtering was conducted as described in detail in the Methods. In short, a gene was included in downstream analyses if the mixture model classified it as “on” in at least 1%, 5%, 10% or 15% of the samples. For CPM input data type, we recalculated CPM values using raw counts after filtering out genes.
4. Feature Selection
To identify genes differentially expressed (DE) between samples with and without premalignant lesions (PMLs), we applied several algorithms to our filtered dataset. The algorithms used were as follows:
1. edgeR: We applied the edgeR package (v3.8.6) 101 to raw counts only. After
calculating normalization factors (calcNormFactors) and estimating common (estimateGLMCommonDisp) and tagwise (estimateGLMTagwiseDisp) dispersion factors, we identified DE genes associated with the presence of PMLs using a generalized linear model, correcting for sex, COPD status, and smoking status covariates. For balanced signatures, the sign of the log2-fold change of expression between conditions determined gene directionality. For all models regardless of balancing, gene importance was defined by FDR-adjusted p-value from likelihood ratio tests (glmLRT).
2. edgeRgb: We used the edgeR package as described in #1, additionally correcting for gb-ratio (described in section 2.1.3).
3. lm: We applied the limma package (v3.22.7) 134to CPMs, RPKMs, or voom-transformed raw counts 70. Voom transformation was applied using a linear model, adjusting for sex, COPD status, and smoking status covariates, after calculating normalization factors. We used the same model to identify DE genes associated with the presence of PMLs. For balanced signatures, the sign of the moderated t-statistic obtained via eBayes and topTable determined gene directionality. For all models regardless of balancing, gene importance was defined by the magnitude of the t-statistic.
4. lmgb: We used the limma package as described in #3, additionally correcting for gb-ratio (described in section 2.1.3).
5. glmnet: We applied the glmnet package (v1.9-8) 38 to CPMs, RPKMs, or
voom-transformed raw counts (as in #3) to identify DE genes associated with the presence of PMLs. For balanced signatures, gene directionality was determined by the sign of the t-statistic obtained via limma by running a linear model described in #3. We carried out the following series of steps using all genes for unbalanced signatures and separately using up- and down-regulated genes for balanced signatures: First, RPKMs and CPMs were z-score normalized, while raw counts were voom-transformed. Then, due to the binary character of our response variable (dysplasia status), a logistic regression model was fit using the binomial distribution family and elastic net mixing parameter α= 0.5 (indicating a tradeoff between ridge and lasso regressions). The standardize option was set to FALSE, causing the coefficients to be returned on the original scale, thus allowing their magnitude to be interpreted as gene importance. Next, a range of regularization parameters λ was generated via leave-one-out cross-validation (nfolds = 46), and the λ giving the minimum mean cross-validated error (lambda.min) was chosen to estimate the coefficients. Finally, DE genes were defined as having non-zero coefficients and then sorted by importance based on the coefficients’ magnitude.
6. randomForest: We applied the randomForest package (v4.6-12) 73to CPMs, RPKMs, and voom-transformed raw counts (as in #3), setting the number of trees (ntree) to 100 and importance to TRUE. For balanced signatures, the sign of the t-statistic as described in #5 determined gene directionality. For all models
regardless of balancing, gene importance was determined by the magnitude of the importance variable, defined as the mean decrease in accuracy over both
conditions.
7. DESeq: We applied the DESeq package (v1.18.0) 2 to unmodified raw counts only. DE analysis to find genes associated with the presence of PMLs included data normalization (estimation of the effective library size), variance estimation, and inference for two experimental conditions, as outlined in the DESeq package vignette
(https://www.bioconductor.org/packages/3.3/bioc/vignettes/DESeq/inst/doc/DESe q.pdf). For balanced signatures, the sign of the log2-fold change of expression between the two conditions determined gene directionality. For all models regardless of balancing, gene importance was defined by FDR.
8. SVA: We applied the sva package (v3.12.0) 71 to CPMs, RPKMs, or
voom-transformed raw counts. Raw counts were voom-voom-transformed using a linear model including only dysplasia status as the predictor variable. The number of surrogate variables (SVs) not associated with dysplasia status was estimated using the default approach of Buja and Eyuboglu 24 (“be” method). SVs were then
identified using the empirical estimation of control probes (“irw” method), and up to 5 were added as covariates in the linear model (limma package). The adjusted model was then used to once again voom-transform raw counts, and subsequently fitted to identify DE genes associated with the presence of PMLs. For balanced
signatures, the sign of the moderated t-statistic obtained via topTable determined gene directionality. For all models regardless of balancing, gene importance was defined by the magnitude of the t-statistic.
9. pAUC (partial AUC) 80: We applied the rowpAUCs function in the genefilter package (v1.48.1) 39 to CPMs, RPKMs, or voom-transformed raw counts (as in #3). We used 10 class label permutations and a sensitivity cutoff of 0.1 for a specificity range of 0.9-1. For balanced signatures, the sign of the moderated t-statistic obtained via limma’s topTable determined gene directionality. For all models regardless of balancing, gene importance was defined by the magnitude of the t-statistic.
5. Gene Signature Size
After the feature selection step, we selected the top scoring 10, 20, 40, 60, 80, 100, or 200 genes, making sure that for balanced signatures, half originated from an ordered list of up-regulated genes, and half from an ordered list of down-regulated genes.
6. Prediction Method
For each set of genes, we applied multiple prediction methods to predict dysplasia status (presence of PMLs) in a training set of 46 samples and a test set of 12 samples. These training and test set samples differed in each iteration, which resulted from randomly splitting the 58 discovery set samples. The following prediction methods were used:
1. glmnet: We used glmnet (v1.9-8) 38 to first estimate a range of penalty parameters
λ in 10-fold cross validation using the binomial distribution family parameter and
α= 0 to ensure all feature-selected genes were included in predictions. Dysplasia status was then predicted as a binary class, using lambda.min penalty.
2. wv (weighted voting) 40: We used the weighted voting algorithm to predict dysplasia status.
3. svm (Support Vector Machine) 30: We used the svm function in the e1071 package (v1.6-7) 84 with linear kernel and 5-fold cross validation for class prediction. 4. rf (random forest): We used the randomForest package (v4.6-12) 73 with 1000
trees, requesting a matrix of class probabilities as output.
5. nb (Naïve Bayes): We used the naiveBayes function in the e1071 package (v1.6-7) with default parameters.
Each of the prediction algorithms generated a vector of predicted scores and a vector of predicted labels for all samples in the training and test sets.
Evaluating Performance
We considered all statistically and computationally viable combinations of the above six parameters. The predicted class labels calculated for each model (i.e., a combination of parameters), coupled with true class labels were then used to calculate performance metrics for the biomarker.
For each model, we calculated these metrics for each of the 500 iterations (different training and test sets assembled from the discovery set samples) and then averaged over all iterations. In addition to the standard performance metrics, we
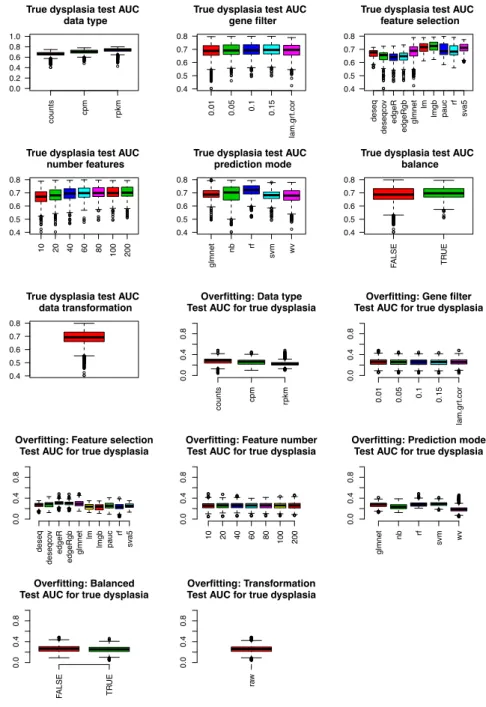
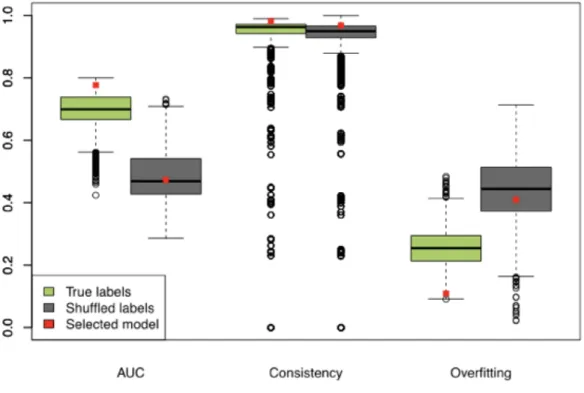
calculated model overfitting and gene selection consistency. The overfitting metric was calculated as the difference between the train set AUC and the test set AUC. Specifically, a model performing well on the training set but poorly on the test set would suggest a high degree of overfitting and thus achieve a high overfitting score. For each model, the gene selection consistency metric was calculated as the average (“normalized” to biomarker size in a given model) percentage of genes passing the gene filter, that were selected into the final gene committee in all 500 iterations:
For example, a model resulting in a 10-gene biomarker would have the highest consistency (1) if it selected the same 10 genes in all 500 iterations (10 unique genes selected altogether). The same model would have the lowest consistency (0) if it selected a different set of 10 genes in all iterations (10 genes x 500 iterations = 5000 unique genes altogether).
Selecting Best Performing Model
In selecting the best model, we considered the degree of model overfitting, model gene selection consistency and test set AUC. First, we identified top 10% least overfitting models. Simultaneously, we identified top 10% most consistent models. Finally, the
!"#$%$&'#!( = 1 −# .#%/.' 0'#'$ %# 122 %&'31&%"#$ − 4%"5136'3 $%7' 4%"5136'3 $%7' × # %&'31&%"#$ − 4%"5136'3 $%7'
model with the highest test set AUC among models fulfilling both criteria was chosen as the final model.
Selecting Final Gene Signature
Due to the nature of internal cross-validation, the biomarker genes selected by the best model may differ (only slightly, assuming the model is highly consistent) between iterations due to differences in the sample composition of the training set in each cross-validation. Therefore, we generated the final gene signature by training the best
biomarker model using all 58 discovery set samples and best model parameters, allowing the pipeline to discover a new “consensus” signature.
Positivie and Negative Controls
The biomarker discovery pipeline was also used to develop control biomarkers. As positive controls, we used smoking status and sex phenotypes to identify biomarkers that could successfully distinguish former from current smokers, and females from males, respectively. As negative controls, we used randomly shuffled labels for dysplasia status, smoking status, and sex. Label shuffling was conducted preserving the association between gene expression profiles and remaining phenotypes; i.e., in the case of shuffled dysplasia status, only dysplasia status was shuffled while other phenotypes and the corresponding gene expression profile remained unchanged and linked to the same sample ID.
2.1.6. Biomarker Validation Pipeline
We tested the performance of the final biomarker using the biomarker discovery pipeline in validation mode. In this mode, the pipeline takes in the entire discovery set (n = 58) as the training set, and an external validation set as the test set. The test set is first corrected for gb-ratio (RNA-Seq quality metric) using limma, and the residual data is used as input. Both training and test sets are then z-score normalized. The pipeline is run using only the final model to generate prediction labels and prediction scores for the test set samples. Finally, pROC package (v1.8) 100 is used to visualize and quantify biomarker performance by plotting a ROC curve using prediction scores as the response and the dichotomous phenotype as the predictor, and extracting the AUC value from the resulting ROC object.
Detecting PML Presence Using Bronchial Brushings from Subjects With and Without PMLs Profiled by RNA-Seq
To validate the biomarker’s ability to detect the presence of PMLs, we tested the performance of the biomarker in smokers with and without PMLs (n=17 samples) left out of the biomarker discovery process. To assess the robustness of the results, we randomly permuted dysplasia status labels 100 times, obtaining biomarker scores for all 17 samples in each of the iterations. We then concatenated the 100 newly generated biomarker score sets for randomized labels, creating a predictor vector consisting of 1700 scores.
creating a response vector of the same length. This allowed us to visualize the performance of the biomarker on true and randomized labels in a single ROC curve. Moreover, we evaluated the biomarker’s platform dependence by testing its ability to detect PMLs in an overlapping and an independent set of microarray samples.
Detecting PML Progression Using Longitudinally-Collected Bronchial Brushings from Subjects With History of PMLs Profiled by RNA-Seq
To validate the biomarker’s ability to predict sample progression/regression, we first used the biomarker to score the longitudinally collected RPCI samples (n=51). Next, we calculated the difference in scores between two consecutive time points for each patient (later time point biomarker score - earlier time point biomarker score). For example, a subject with 3 samples from 3 different time points would have 3 scores, and thus two score differences could be calculated; a subject with 2 samples from 2 time points would have 2 scores, and thus 1 score difference. Each pair of samples was assigned a “progressing/stable” or “regressing” phenotype. A “progressing/stable” phenotype indicated that the worst histological grade of PMLs sampled during the baseline procedure increased in severity or remained unchanged at follow-up; while a “regressing” phenotype indicated that the worst histological grade of PMLs sampled at baseline decreased in severity at follow-up. We quantified the ability of the score difference to predict the “progression/regression” phenotype by plotting a ROC curve,
using the vector of score differences as the predictor variable, and the progression/regression phenotype as the response variable.
Detecting Lung Cancer Presence Using Bronchial Brushings from Subjects With and Without Lung Cancer Profiled by Microarray
To validate the biomarker’s ability to detect the presence of lung cancer, we tested the model in microarray and RNA-Seq samples from subjects with and without lung cancer.
Functional Enrichment
The final biomarker genes’ role in relevant biological pathways and processes was evaluated using Enrichr 28. Enrichment was tested using Fisher’s Exact Test in gene enrichment categories such as BioCarta, Reactome, GO, KEGG, etc, calculated for the gene overlap between the biomarker genes and genes implicated in each considered pathway.
2.2. Results
2.2.1. Sample Population
Cytologically normal epithelial cells were collected via bronchial airway
brushings using autofluorescence bronchoscopy from current and former smokers at the BCCA. Sample and gene filtering yielded 13,870 out of 51,979 genes and 82 samples (n=2 excluded due to quality or sex annotation mismatches) for analysis. Data from